Data analytics and visualization play an integral role in the scientific process - allowing a way to see the unseen by creating images of experimental data or theoretical simulation results. The projects listed on this page represent recent or current collaborative efforts between the CRD (Machine Learning and Analytics Group (formerly, Data Analytics and Visualization Group and others performing scientific research in both simulation/computational and experimental sciences.
Jump to year 2021, 2020, 2019, 2018, 2017, 2015, 2014, 2013, 2012. For research highlights before 2012, please visit the group’s archival visualization vignettes page.
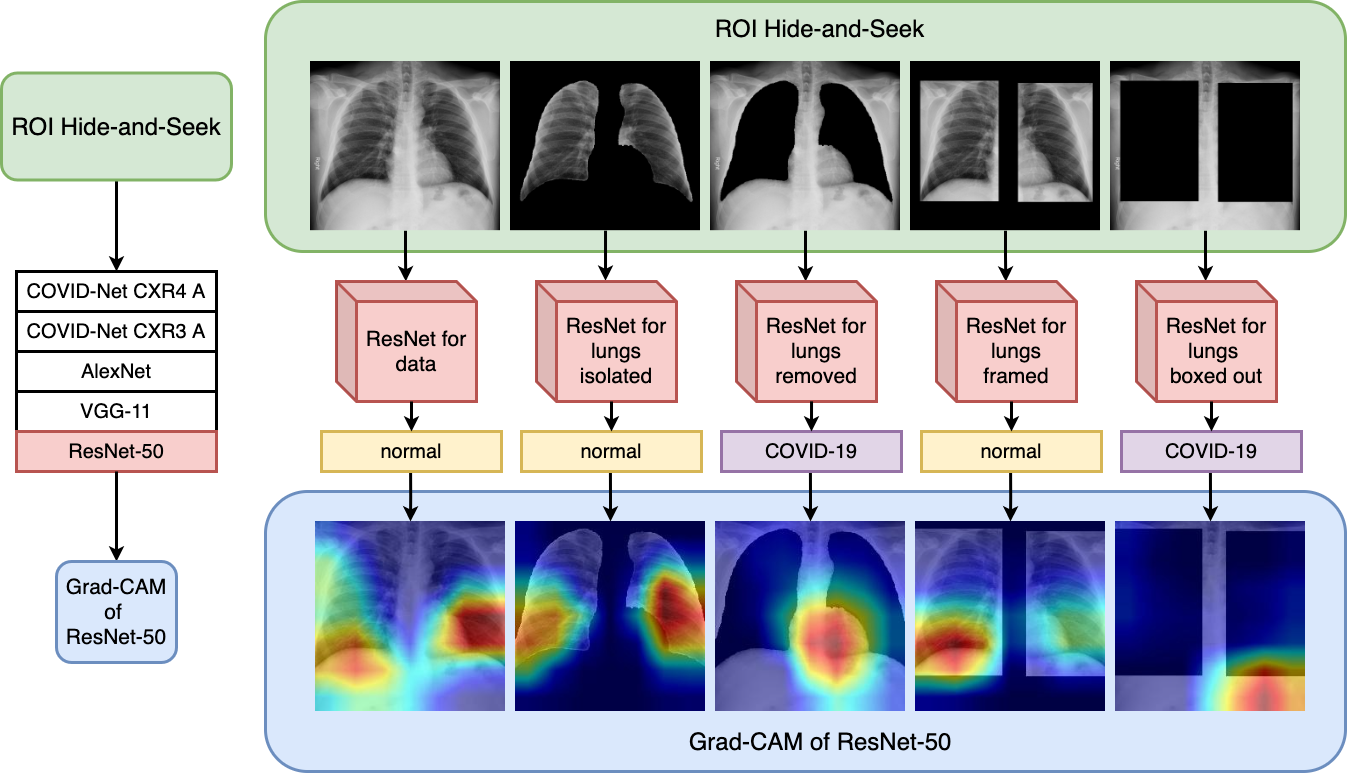 New protocol to inspect deep learning architectures shows the influence of heterogenous data sources of images on COVID-19 classification performance when using chest X-ray.
(More information)
New protocol to inspect deep learning architectures shows the influence of heterogenous data sources of images on COVID-19 classification performance when using chest X-ray.
(More information)
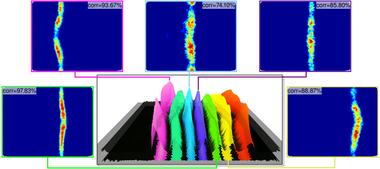
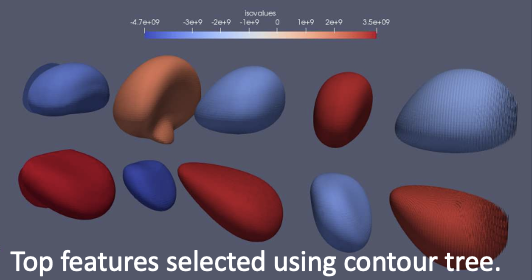 New topological analysis method stores images of individual features in a Cinema database to enable richer post hoc exploration of in situ simulation visualization results.
(More information)
New topological analysis method stores images of individual features in a Cinema database to enable richer post hoc exploration of in situ simulation visualization results.
(More information)
 Detailed performance analysis of a state-of-the-art, unsupervised learning graphical model optimization method reveals new performance insights and contrasts between OpenMP, threaded, and data-parallel primitives (DPP) programming models.
(More information)
Detailed performance analysis of a state-of-the-art, unsupervised learning graphical model optimization method reveals new performance insights and contrasts between OpenMP, threaded, and data-parallel primitives (DPP) programming models.
(More information)
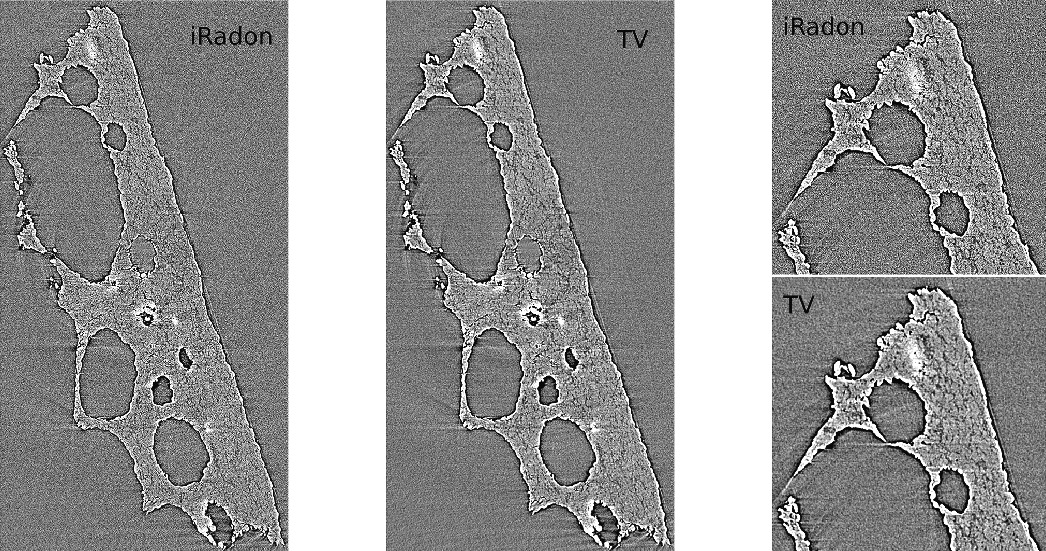 Development of new image reconstruction framework using sparse matrix-vector multiplication and exploiting multi-CPU/GPU over MPI that (1) outperforms state-of-the-art algorithm by a factor of 175x when reconstructing an experimental dataset and (2) leads to better quality reconstructions.
(More information)
Development of new image reconstruction framework using sparse matrix-vector multiplication and exploiting multi-CPU/GPU over MPI that (1) outperforms state-of-the-art algorithm by a factor of 175x when reconstructing an experimental dataset and (2) leads to better quality reconstructions.
(More information)
The NWB neurophysiolgy data ecosystem developed by Oliver Ruebel, Andrew Tritt, Kristofer Bouchard, and Ryan Ly in collaboration with the Allen Institute for Brain Science, Vidrio, and CatalystNeuro was selected as “One of the 100 Most Technologically Significant New Products of the Year in Software/Services.”
For more information see the following LBNL news article. For a full list of award winners see here. NWB is available online at nwb.org.
 A detailed study how different approximations of functions given as samples at discrete locations influences the result of topological analysis.
(More information)
A detailed study how different approximations of functions given as samples at discrete locations influences the result of topological analysis.
(More information)
 An order-of-magnitude performance increase on CPU and GPU platforms for a challenging graph optimization problem results from algorithmic reformulation using data-parallel primitives.
(More information)
An order-of-magnitude performance increase on CPU and GPU platforms for a challenging graph optimization problem results from algorithmic reformulation using data-parallel primitives.
(More information)
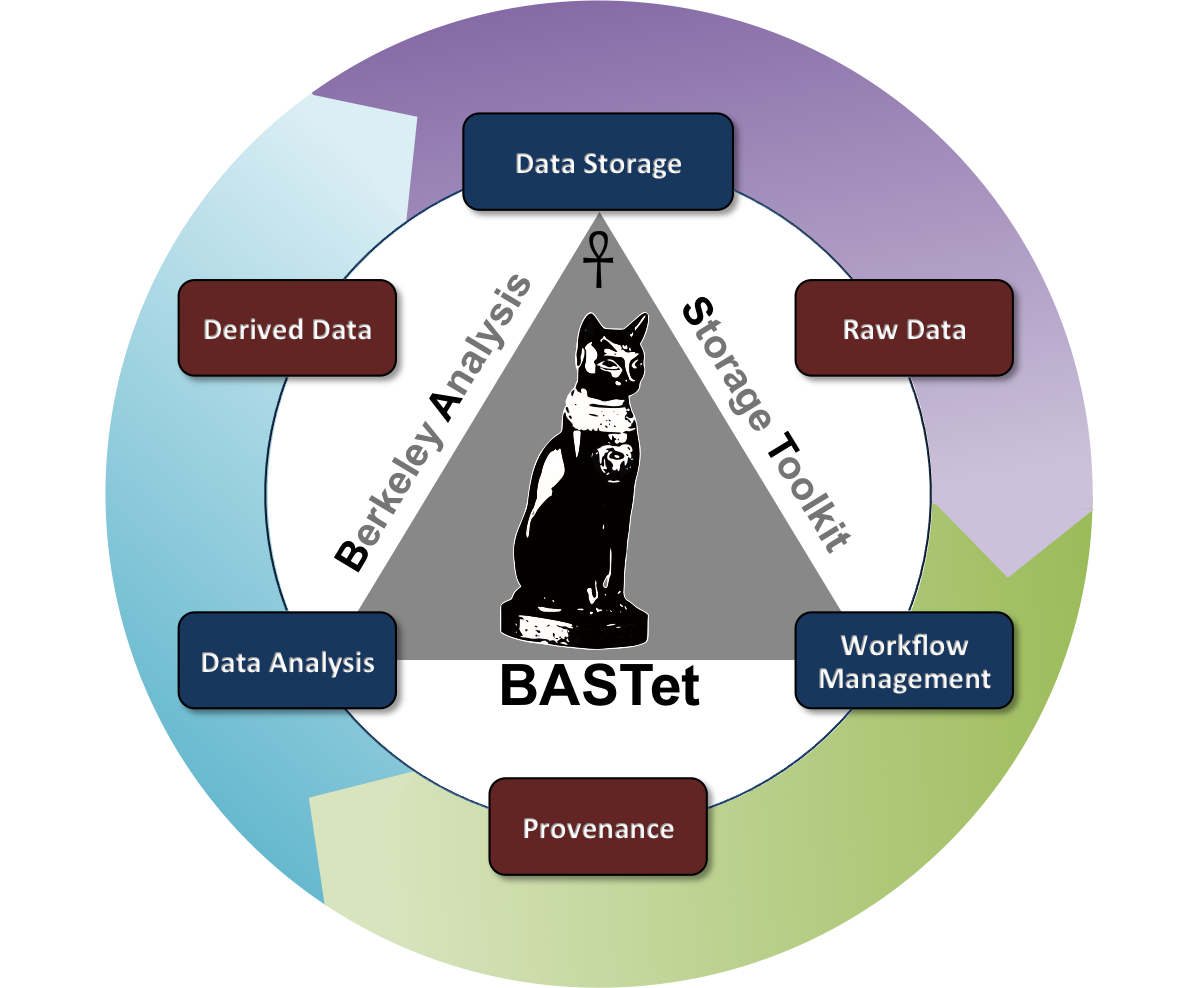
BASTet is a novel framework for shareable and reproducible data analysis that supports standardized data and analysis interfaces, integrated data storage, data provenance, workflow management, and a broad set of integrated tools. BASTet has been motivated by the critical need to enable MSI researchers to share, reuse, reproduce, validate, interpret, and apply common and new analysis methods.
For more information see the BASTet homepage as well as the IEEE TVCG article on BASTet. BASTet has been released to the public; Sources (GitHub) and the Online Documentation.
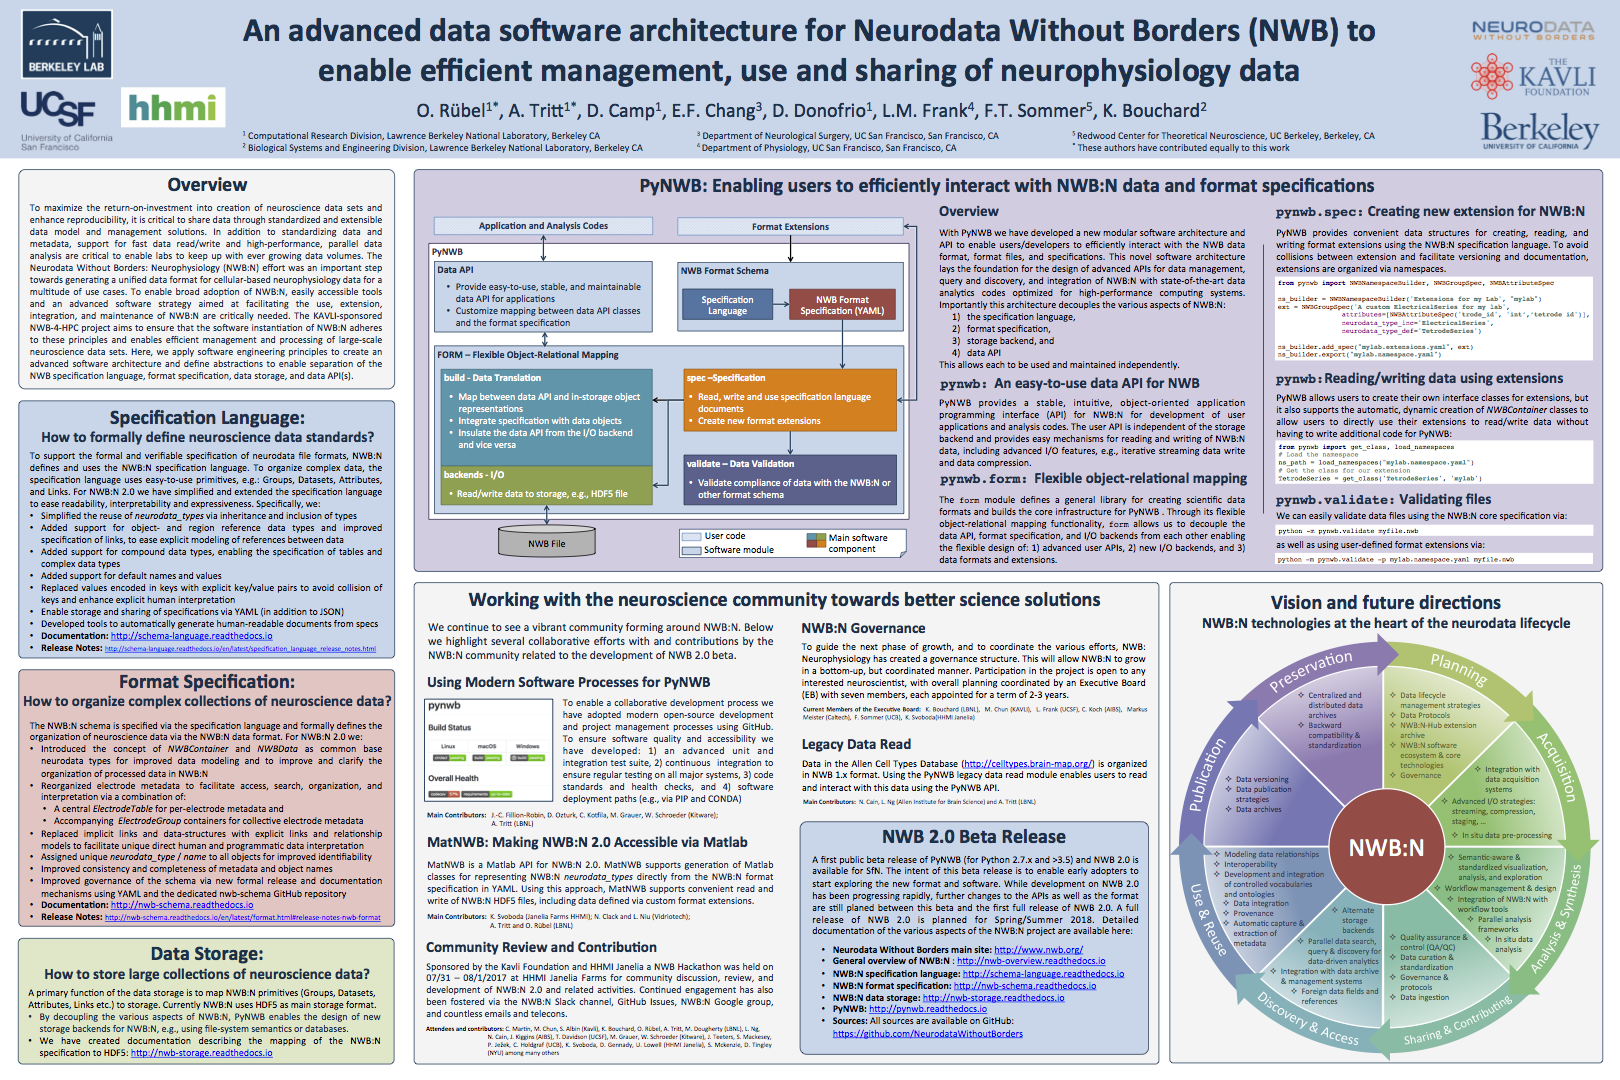
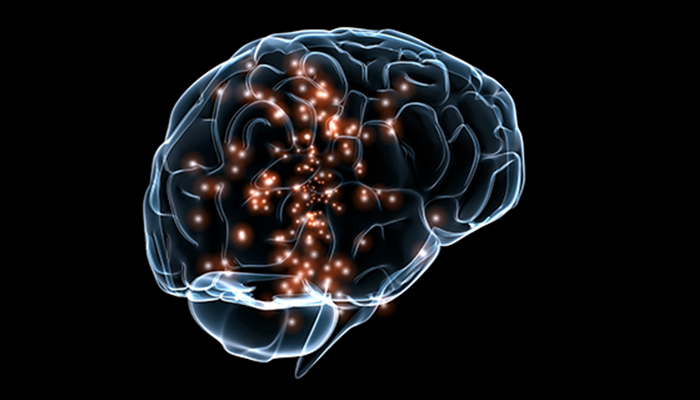
Neurodata Without Borders: Neurophysiology (NWB:N) is a project to develop a unified data format for cellular-based neurophysiology data. The NWB:N team consists of neuroscientists and software developers who recognize that adoption of a unified data format is an important step toward breaking down the barriers to data sharing in neuroscience. Neuroscientists can now explore a beta version of the new Neurodata Without Borders: Neurophysiology (NWB:N 2.0) software and format.
The 2.0 software version was developed by Lawrence Berkeley National Laboratory’s Oliver Ruebel and Andrew Tritt, in close collaboration with Kristofer Bouchard (Berkeley Lab), Loren Frank (UCSF), Eddie Chang (UCSF), and the broader Neurodata Without Borders (NWB) community. The beta update was released in November 2017 in conjunction with the 2017 Society for Neuroscience meeting in Washington D.C. last month.
For more information download the PDF of the poster by clicking on the image on the left and see the following LBNL news article. The NWB:N format schema and PyNWB Python API have been released to the public online on GitHub.
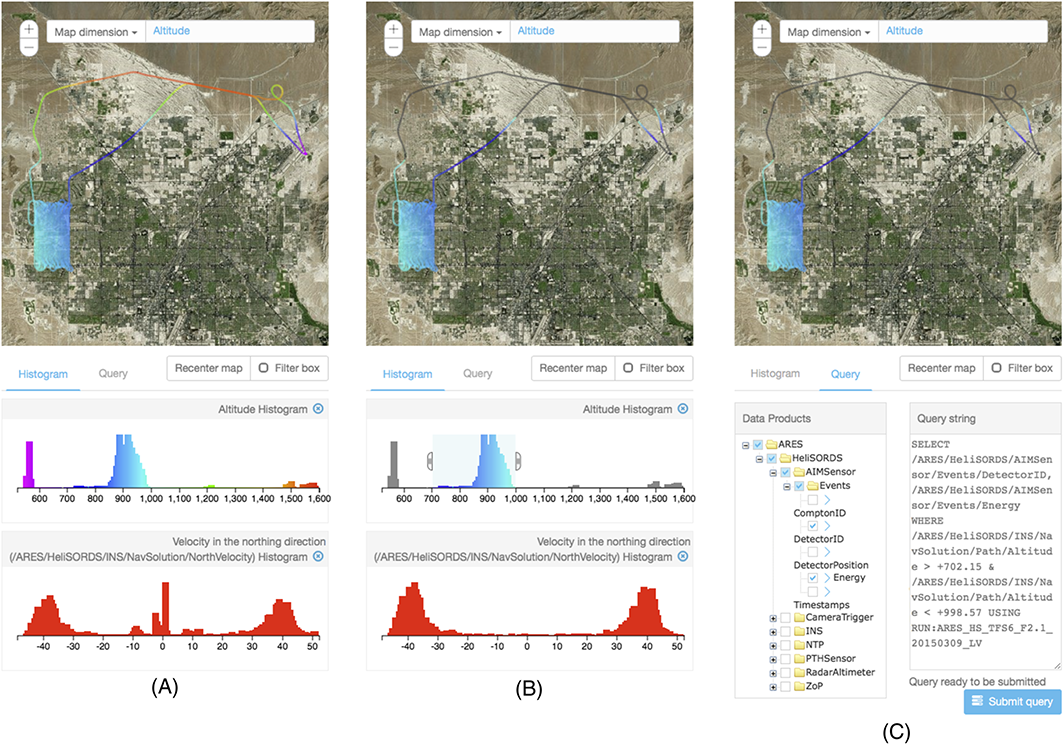 We developed a web-based system that integrates data management and visual analysis to facilitate access to large amounts of observational data, supporting algorithm development for finding radiological material.
(More information)
We developed a web-based system that integrates data management and visual analysis to facilitate access to large amounts of observational data, supporting algorithm development for finding radiological material.
(More information)
![]() New technique makes it easier to see how features in simulations are related and how they evolve.
(More information)
New technique makes it easier to see how features in simulations are related and how they evolve.
(More information)
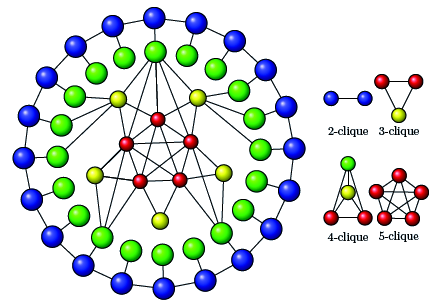 A 10-fold performance over a state-of-the-art approach results from a novel algorithmic design of maximal clique enumeration (MCE), a key graph analytics method. The novelty is the use of data-parallel primitives (DPP), a non-traditional programming model.
(More information)
A 10-fold performance over a state-of-the-art approach results from a novel algorithmic design of maximal clique enumeration (MCE), a key graph analytics method. The novelty is the use of data-parallel primitives (DPP), a non-traditional programming model.
(More information)
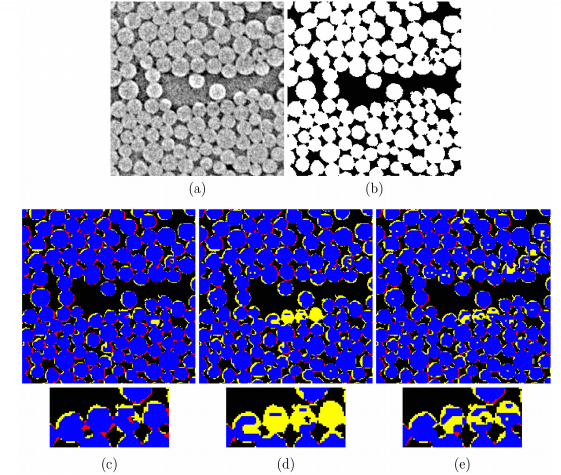 MSMcam framework analyzes data and generates easily interpretable segmentation results using appropriate set of evaluation metrics for each dataset.
(More information)
MSMcam framework analyzes data and generates easily interpretable segmentation results using appropriate set of evaluation metrics for each dataset.
(More information)
 Leveraging advances in mathematics and CS, a new method for graph partitioning scales image segmentation to run on large DOE HPC platforms, and with high accuracy.
(More information)
Leveraging advances in mathematics and CS, a new method for graph partitioning scales image segmentation to run on large DOE HPC platforms, and with high accuracy.
(More information)
Thanks to standardized image file formats—like JPEG, PNG or TIFF—people can easily share selfies and other pictures with anybody connected to a computer, mobile phone or the Internet, without having to download any special software to see the pictures. But in many science fields—like neuroscience—sharing data is not that simple because no standard data format exists. The BrainFormat library developed at LBNL specifies a general data format standardization framework based on the widely used HDF5 format and implements a novel file format for management and storage of neuroscience data, in particular Electrocorticography (ECoG) data.
For more information see the following LBNL news article as well as the Frontiers in Neuroinformatics article. The BrainFormat library has been released to the public and is available online at bitbucket.org.
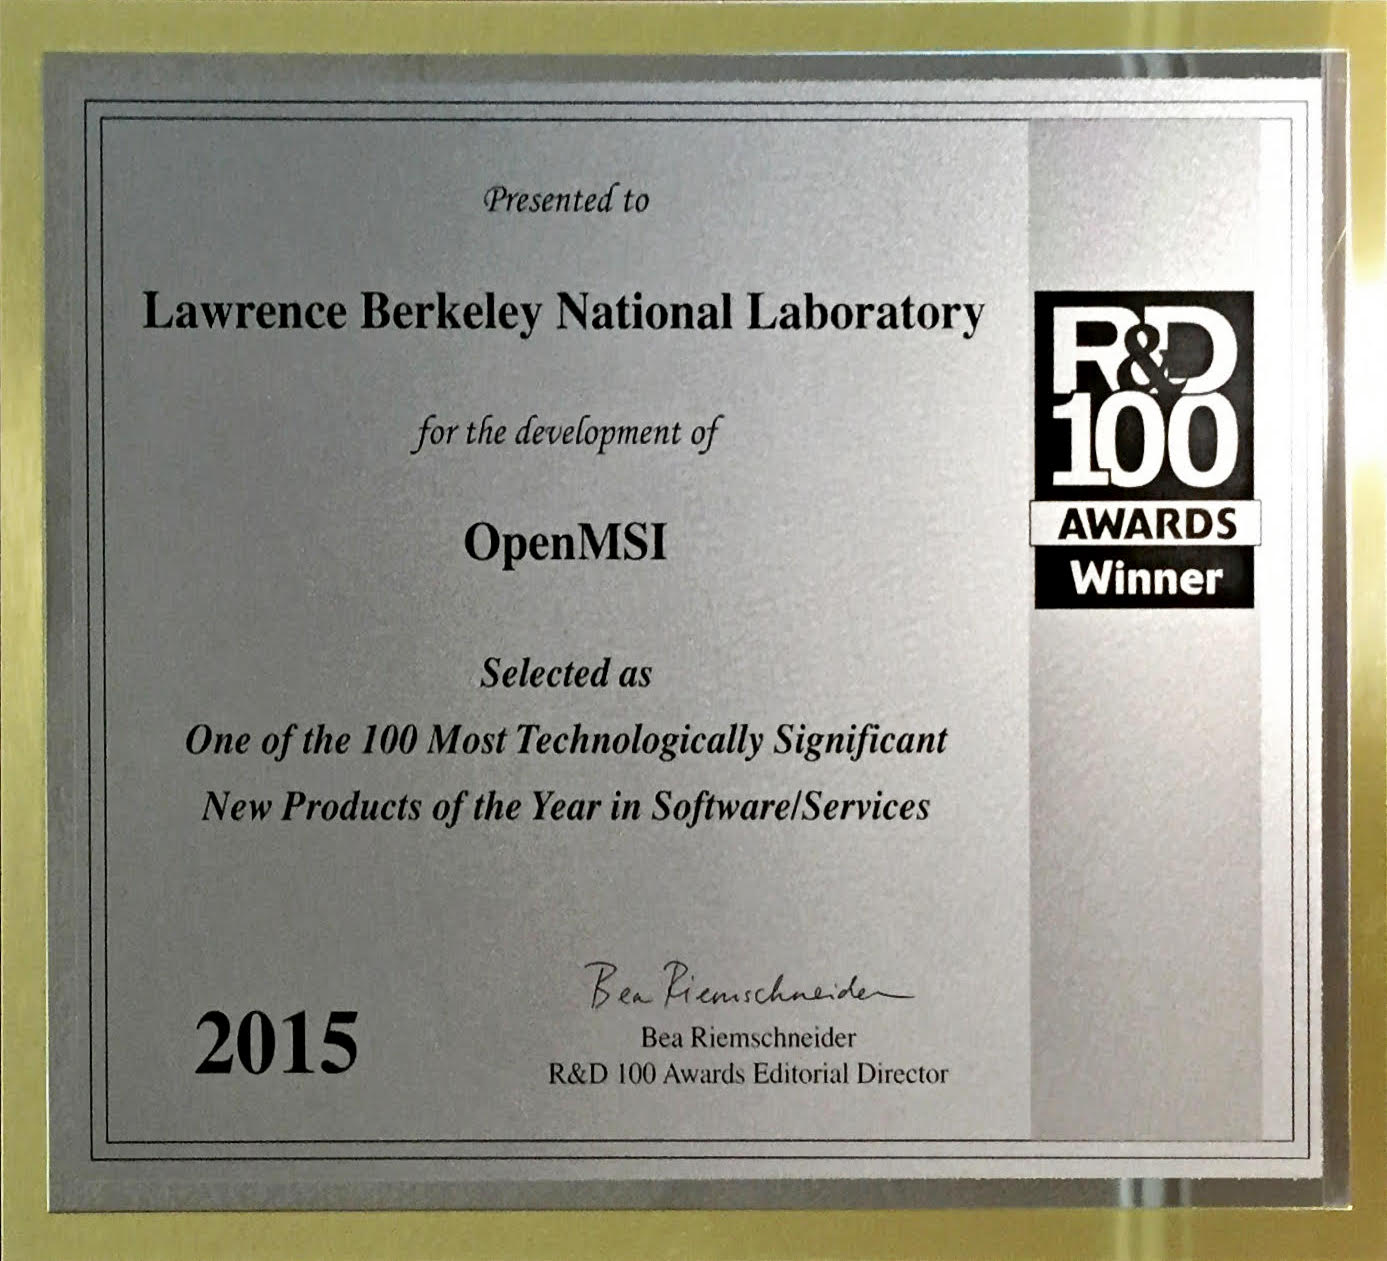
The OpenMSI software/service developed by Oliver Ruebel and Benjamin P. Bowen (LBNL) was selected as “One of the 100 Most Technologically Significant New Products of the Year in Software/Services.”
For more information see the following LBNL news article. For a full list of award winners see here. OpenMSI has been released to the public and is available online at openmsi.nersc.gov.
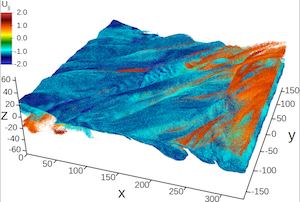
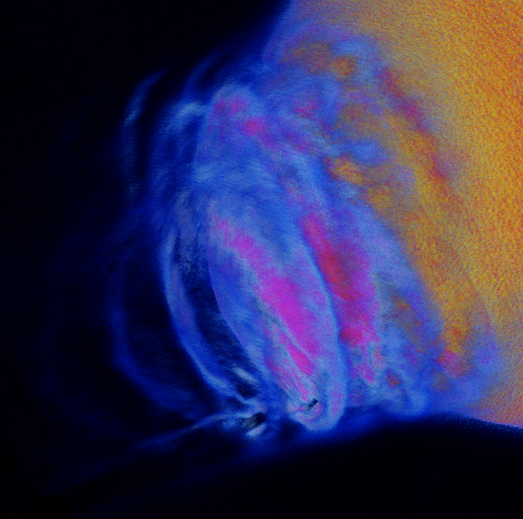 This research leverages petascale simulations of the Earth’s magnetosphere to study the physics and dynamics of space weather phenomenon. A radial interplanetary magnetic field(IMF) configuration was studied. Such configurations are common during high intensity solar storms when the solar wind becomes highly turbulent. The study is based upon one of the largest global simulations of the Earth’s magnetosphere ever made. The simulation ran on 150,000 cores for 368 hours, for a total of approximately 55.2 Million core hours. The fields and derived quantities are kept on a 1024x2048x1024 grid, and 1 Trillion Particles were simulated. The simulation produced more that 128 TB of analysis data. The NERSC DAS group applied parallel visualization and analysis techniques using ParaView, VTK, and POVRay. Including interactive and batch volume rendering on Edison using ParaView on 256 cores, and batch mode ray tracing using POV-Ray on 36,000 cores.
(More information)
This research leverages petascale simulations of the Earth’s magnetosphere to study the physics and dynamics of space weather phenomenon. A radial interplanetary magnetic field(IMF) configuration was studied. Such configurations are common during high intensity solar storms when the solar wind becomes highly turbulent. The study is based upon one of the largest global simulations of the Earth’s magnetosphere ever made. The simulation ran on 150,000 cores for 368 hours, for a total of approximately 55.2 Million core hours. The fields and derived quantities are kept on a 1024x2048x1024 grid, and 1 Trillion Particles were simulated. The simulation produced more that 128 TB of analysis data. The NERSC DAS group applied parallel visualization and analysis techniques using ParaView, VTK, and POVRay. Including interactive and batch volume rendering on Edison using ParaView on 256 cores, and batch mode ray tracing using POV-Ray on 36,000 cores.
(More information)
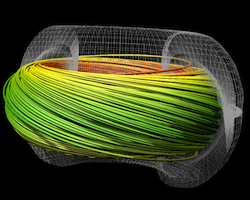
 Using NERSC’s Cray XC30 supercomputer “Edison”, University of Michigan researchers found that the semiconductor indium nitride (InN), which typically emits infrared light, will emit green light if reduced to 1 nanometer-wide wires. Moreover, just by varying their sizes, these nanostructures could be tailored to emit different colors of light, which could lead to more natural-looking white lighting while avoiding some of the efficiency loss today’s LEDs experience at high power. Visualization and analysis of the simulation data were done using custom tools based on VTK, ParaView, and finally rendering the result with POVRay. The visualizations appeared on the cover of ACS Nano Letter, on NERSC web site, and were made into a stereoscopic 3D presentation for SC14.
(More information)
Using NERSC’s Cray XC30 supercomputer “Edison”, University of Michigan researchers found that the semiconductor indium nitride (InN), which typically emits infrared light, will emit green light if reduced to 1 nanometer-wide wires. Moreover, just by varying their sizes, these nanostructures could be tailored to emit different colors of light, which could lead to more natural-looking white lighting while avoiding some of the efficiency loss today’s LEDs experience at high power. Visualization and analysis of the simulation data were done using custom tools based on VTK, ParaView, and finally rendering the result with POVRay. The visualizations appeared on the cover of ACS Nano Letter, on NERSC web site, and were made into a stereoscopic 3D presentation for SC14.
(More information)
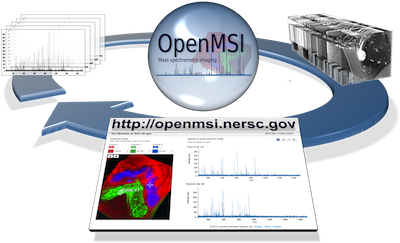
OpenMSI is a collaborative research effort with the goal to make the most high-performance, advanced data management, model building, analysis and visualization resources for mass spectrometry imaging accessible to scientists via the web. The development and application of cutting-edge analytical methods is a core driver for new scientific discoveries, medical diagnostics, and commercial-innovation. Mass spectrometry imaging (MSI) holds the promise for being a transformative technology for advanced studies of metabolic processes with broad applications in life sciences, bioenergy, and health. MSI enables fast assays of microbial metabolism essential in bioengineering problems common to the development of biofuels, drugs, and diagnostics for cancer and other diseases. While the data can be routinely collected, the broad application of MSI is currently limited by the lack of easily accessible analysis methods that can process data of the size, volume, diversity and complexity generated by MSI experiments. The OpenMSI project will overcome these challenges, allowing broad use of MSI to researchers by providing a web-based gateway for management and storage of MSI data, the visualization of the hyper-dimensional contents of the data, and the statistical analysis.
More information is available in the following LBNL and science.energy.gov news articles as well on the OpenMSI project website.
 Berkeley Lab researchers created a 3D movie where the viewer flies through the known universe.
(More information)
Berkeley Lab researchers created a 3D movie where the viewer flies through the known universe.
(More information)
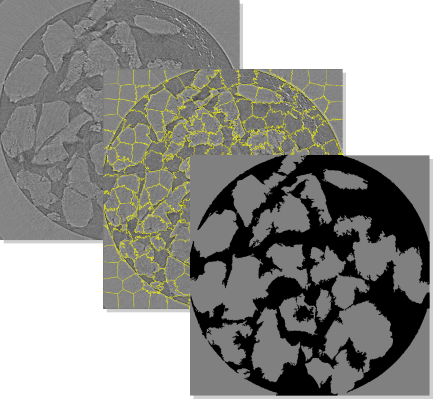
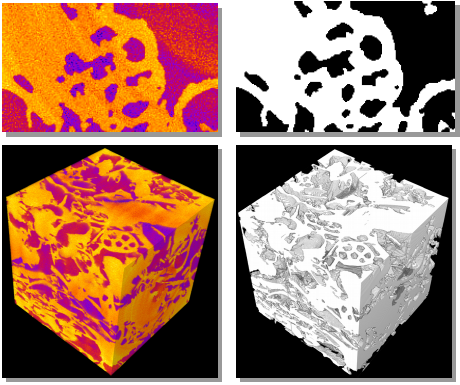
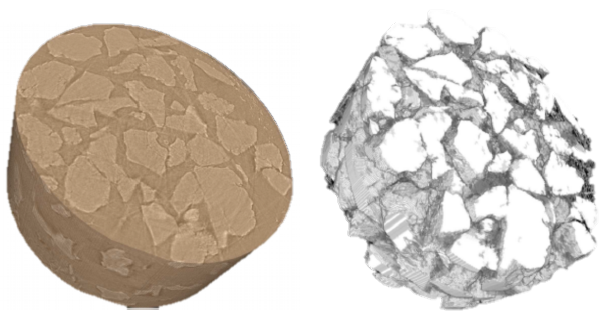
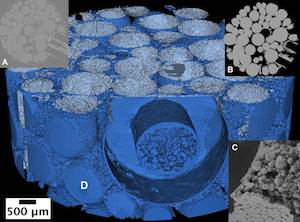 Working closely with earth sciences researchers, we have developed a collection of algorithms and software tools that helps scientists to conduct quantitative analysis of 3D imaging data in order to better understand how to store CO2 in geologic reservoirs.
(More information)
Working closely with earth sciences researchers, we have developed a collection of algorithms and software tools that helps scientists to conduct quantitative analysis of 3D imaging data in order to better understand how to store CO2 in geologic reservoirs.
(More information)
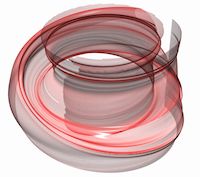 Stream surfaces, a useful flow visualization technique, are difficult to compute accurately and efficiently on large, parallel platforms. Our team has developed a new algorithm that addresses both of these challenges.
(More information)
Stream surfaces, a useful flow visualization technique, are difficult to compute accurately and efficiently on large, parallel platforms. Our team has developed a new algorithm that addresses both of these challenges.
(More information)
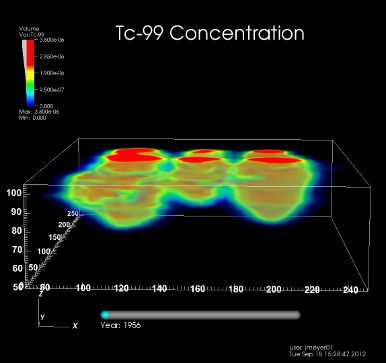
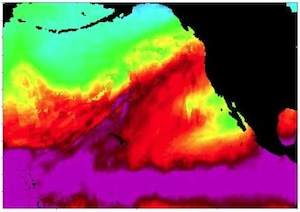
The U.S. Department of Energy’s (DOE) Office of Environmental Management (DOE/EM) supports an effort to understand and predict contaminant fate and transport in natural and engineered systems. Geologists, hydrologists, physicists and computer scientists are working together to create models of existing, contaminated sites, and to simulate their behavior. Simulation results are verified based on historical data and extrapolated into the future. Visualization is used for model setup verification, visual analysis of high-performance computing simulation results, and uncertainty quantification.
The image depicts simulated Technetium-99 contamination under six cribs at the Hanford site (volume rendering). [MPEG4 Movie clip (3.3MB)]
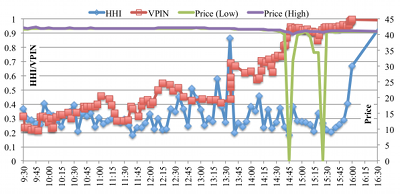 The SEC and CFTC recently proposed the development of a Consolidated Audit Trail System (CATS), a next-generation system for market monitoring. The goal of our work has been to evaluate how high-performance computing can support financial data analysis and, in particular, the development and implementation of early warning systems for detection and analysis of market anomalies.
(More information)
The SEC and CFTC recently proposed the development of a Consolidated Audit Trail System (CATS), a next-generation system for market monitoring. The goal of our work has been to evaluate how high-performance computing can support financial data analysis and, in particular, the development and implementation of early warning systems for detection and analysis of market anomalies.
(More information)
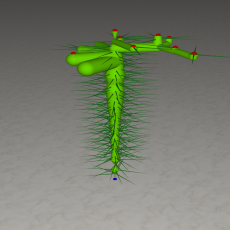
 Three-dimensional gene expression PointCloud data, generated by the Berkeley Drosophila Transcription Network Project (BDTNP), provides quantitative information about the spatial and temporal expression of genes in early Drosophila embryos at cellular resolution. The goal of this work has been to maximize the impact of BDTNP PointCloud data by integrating the visualization system PointCloudXplore with Matlab to: i) make PointCloud data easy to comprehend for developers, ii) to enable developers to deploy their analyses within the context of an advanced easy-to-use visualizations system, and iii) to make novel, advanced analyses capabilities easily accessible to biologist users.
(More information)
Three-dimensional gene expression PointCloud data, generated by the Berkeley Drosophila Transcription Network Project (BDTNP), provides quantitative information about the spatial and temporal expression of genes in early Drosophila embryos at cellular resolution. The goal of this work has been to maximize the impact of BDTNP PointCloud data by integrating the visualization system PointCloudXplore with Matlab to: i) make PointCloud data easy to comprehend for developers, ii) to enable developers to deploy their analyses within the context of an advanced easy-to-use visualizations system, and iii) to make novel, advanced analyses capabilities easily accessible to biologist users.
(More information)
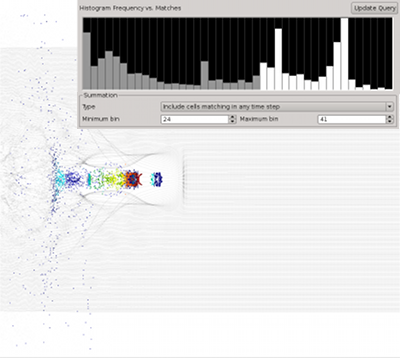 Query-driven analysis based on single timestep queries is a versatile tool for the identification and extraction of temporally persistent and instantaneous data features. Many questions of interest —such as, which particles become accelerated, which locations exhibit high velocities during an extended timeframe, which particles reach a local maximum energy, or which particles change their state— inherently depend on information from multiple timesteps and cannot directly answered based on single-timestep queries alone. The goal of this effort is to extend our query-driven analysis capabilities to enable scientists to formulate time-dependent queries that accumulate information from multiple timesteps, here called cumulative queries.
(More information)
Query-driven analysis based on single timestep queries is a versatile tool for the identification and extraction of temporally persistent and instantaneous data features. Many questions of interest —such as, which particles become accelerated, which locations exhibit high velocities during an extended timeframe, which particles reach a local maximum energy, or which particles change their state— inherently depend on information from multiple timesteps and cannot directly answered based on single-timestep queries alone. The goal of this effort is to extend our query-driven analysis capabilities to enable scientists to formulate time-dependent queries that accumulate information from multiple timesteps, here called cumulative queries.
(More information)
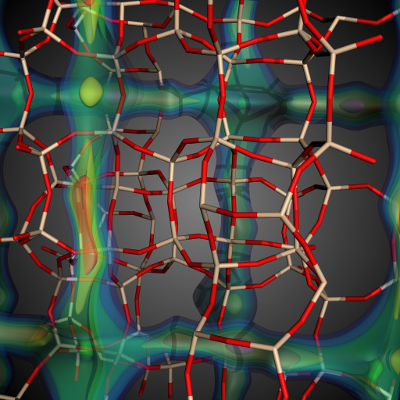 The goal of this work is to enable high-throughput screening of large material databases to characterize material properties and enable fast identification of candidate materials for application-specific problems such as carbon capture.
(More information)
The goal of this work is to enable high-throughput screening of large material databases to characterize material properties and enable fast identification of candidate materials for application-specific problems such as carbon capture.
(More information)
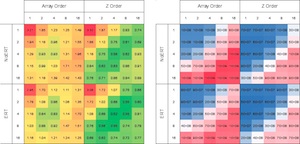 Studies show up to a 30x performance gain is possible on some codes and platforms depending upon settings for tunable algorithmic parameters, algorithmic optimizations, and use of device-specific features.
(More information)
Studies show up to a 30x performance gain is possible on some codes and platforms depending upon settings for tunable algorithmic parameters, algorithmic optimizations, and use of device-specific features.
(More information)
 First-ever trillion-particle runs of a plasma physics code, the computer science research needed to enable this feat, and the science discoveries that result.
(More information)
First-ever trillion-particle runs of a plasma physics code, the computer science research needed to enable this feat, and the science discoveries that result.
(More information)
 New algorithms and tools help climate scientists study extreme weather events like hurricanes using large, parallel computational platforms.
(More information)
New algorithms and tools help climate scientists study extreme weather events like hurricanes using large, parallel computational platforms.
(More information)
 Visualizing topological and quantitative information about isosurfaces. (More information)
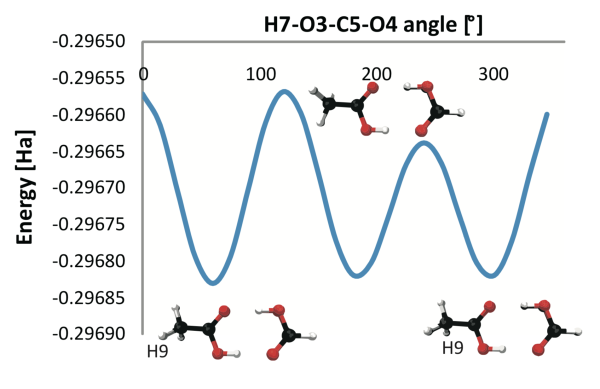
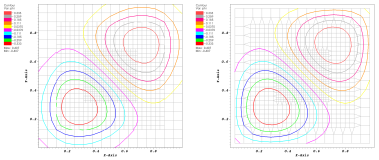
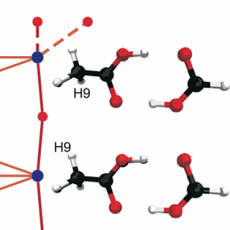 Using the Morse complex to understand energy functions in chemical systems. (More information)
 Efficient parallel extraction of crack-free isosurfaces from AMR data in a distributed memory setting.
(More information)
Efficient parallel extraction of crack-free isosurfaces from AMR data in a distributed memory setting.
(More information)
 Studies show the hybrid-parallel implementation of streamline integration, a key visualization algorithm, performs better and moves less data than a traditional MPI-only implementation.
(More information)
Studies show the hybrid-parallel implementation of streamline integration, a key visualization algorithm, performs better and moves less data than a traditional MPI-only implementation.
(More information)
 Visualization and analysis tools, techniques, and algorithms have undergone a rapid evolution in recent decades to accommodate explosive growth in data size and complexity and to exploit emerging multi- and many-core computational platforms. High Performance Visualization: Enabling Extreme-Scale Scientific Insight focuses on the subset of scientific visualization concerned with algorithm design, implementation, and optimization for use on today’s largest computational platforms.
(More information)
Visualization and analysis tools, techniques, and algorithms have undergone a rapid evolution in recent decades to accommodate explosive growth in data size and complexity and to exploit emerging multi- and many-core computational platforms. High Performance Visualization: Enabling Extreme-Scale Scientific Insight focuses on the subset of scientific visualization concerned with algorithm design, implementation, and optimization for use on today’s largest computational platforms.
(More information)