This is an archival copy of the Visualization Group's web page 1998 to 2017. For current information, please vist our group's new web page.
Linking PointCloudXplore and Matlab: Making Advanced Analysis Easily Accessible
Problem Statement and Goals
Three-dimensional gene expression PointCloud data, generated by the Berkeley Drosophila Transcription Network Project (BDTNP), provides quantitative information about the spatial and temporal expression of genes in early Drosophila embryos at cellular resolution. The BDTNP team visualizes and analyzes PointCloud data using the software application PointCloudXplore (PCX) [1], which we developed in close collaboration with the BDTNP team.The goal of this work has been to maximize the impact of BDTNP PointCloud data by i) making PointCloud data easy to comprehend for developers of analysis functions, ii) enabling developers to deploy their analyses within the context of an advanced easy-to-use visualizations system, and by iii) making novel, advanced analyses capabilities easily accessible to biologist users.
Implementation and Results
Our approach to addressing the aforementioned challenges is to link PCX and Matlab1 via a dedicated interface, thereby providing biologists seamless access to advanced data analysis functions and giving bioinformatics researchers the opportunity to integrate their analysis directly into the visualization application. Figure 1(a) provides an overview of PCX and its interface to Matlab. From a biologist’s perspective, the interface to Matlab hides the complexity of performing analyses implemented in Matlab. The interface allows analyses to be initiated directly from within PCX. No Matlab knowledge is necessary to use these functions. From a bioinformatics researcher’s perspective, the interface hides the internal PCX architecture and requires minimal effort to make a Matlab function accessible to PCX (see Figure 1(b)). The PCX-Matlab interface provides a means to initiate Matlab function calls from PCX’s graphical user interface (GUI), while automatically handling all necessary inter-system communication including: i) export of user-defined gene expressions, cell selections, cell locations, cell neighbors, and additional user-definable function parameters from PCX to Matlab and ii) import of derived gene expression channels and/or cell selections from Matlab to PCX. |
 |
| (a) Design of PointCloudXplore. | (b) Example PointCloudXplore Matlab script. |
| Figure 1: (a) Overview of PointCloudXplore and the interface to Matlab. (b) M-file (top left) and PCXM header file (bottom left) of an example function for computing the the cell-by-cell difference between two expression patterns. Color of text is used to illustrate which parts are mandatory (red), optional (blue), or provided in a template file (black). The example shown on the right illustrates the use of the function to compute the difference between late- and early-stage hunchback expression. | |
This work is presented in more detailed in a 2012 book chapter [2]. More details about PointCloudXplore can be found in the following journal and conference papers [3–7]
Impact
To fully exploit the collaborative research potential of teams of biologists, computational biologists, and computer scientists, it is essential to overcome true and perceived obstacles for collaboration. Biologists rarely do computation and computer scientists rarely do biology. To maximize the impact of novel, complex, high-dimensional data sets acquired via modern imaging or computational methods, such as the BDTNP 3D gene expression atlas data, the data needs to be accessible to biologists and comprehensible to developers of analysis and visualization software.In this work we have addressed these challenges by linking the visualization system PCX and Matlab via a dedicated interface, providing biologists seamless access to advanced data analysis functions and enabling bioinformatics researchers to integrate their analysis directly into the visualization. By being able to test new analysis functions during development, biologists are able to provide feedback early, facilitating communication between the developer and the user. By utilizing PCX and Matlab, a developer can develop new functions more efficiently without having to know anything about the PointCloud data format or the architecture of PCX.
In our computational modeling experiments of the expression pattern of eve, we observed that even when using a simple linear model, the modeling was able to predict a large range of regulators correctly for eve stripe 2 (Figure 2(b)), which shows that modeling can provide interesting insights into, or at least hints at, possible regulatory interactions. Missing inputs (regulators), noise, and limitations of the employed computational model, however, directly affect the quality of the predicted model and may also lead to false negatives (missing regulators) and false positives (misidentified regulators). Modeling results should, therefore, always be validated experimentally.
 |
 |
| (a) Design of the genetic network modeling experiment. | (b) Modeling results for stripe 2 of of the expression pattern of the gene eve. |
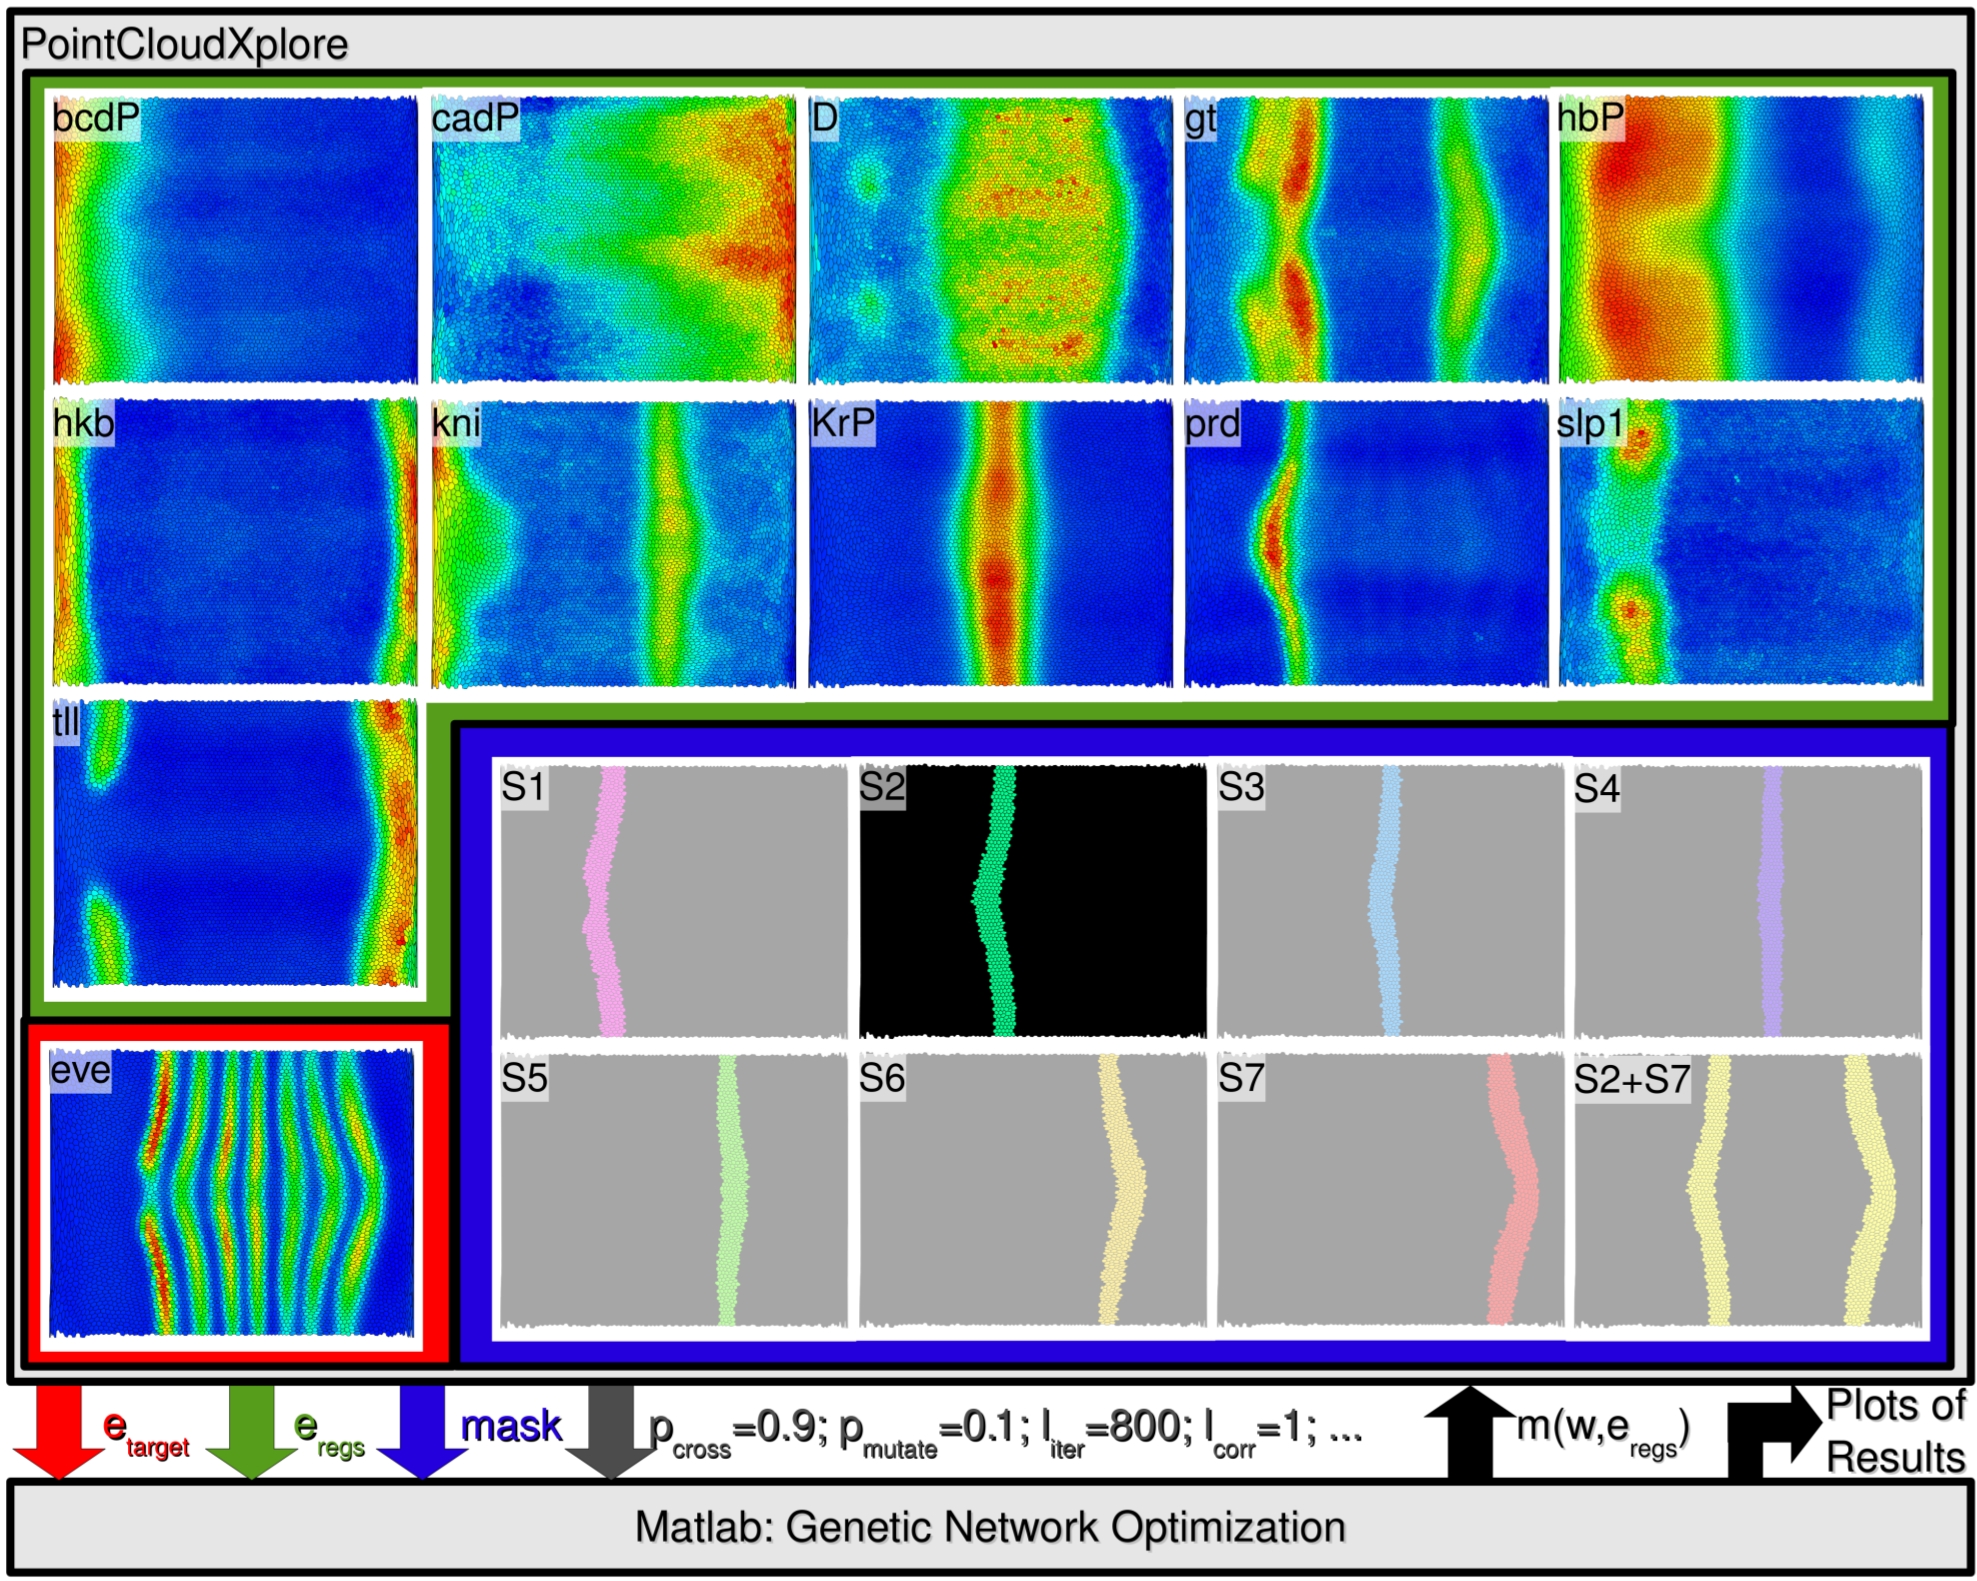
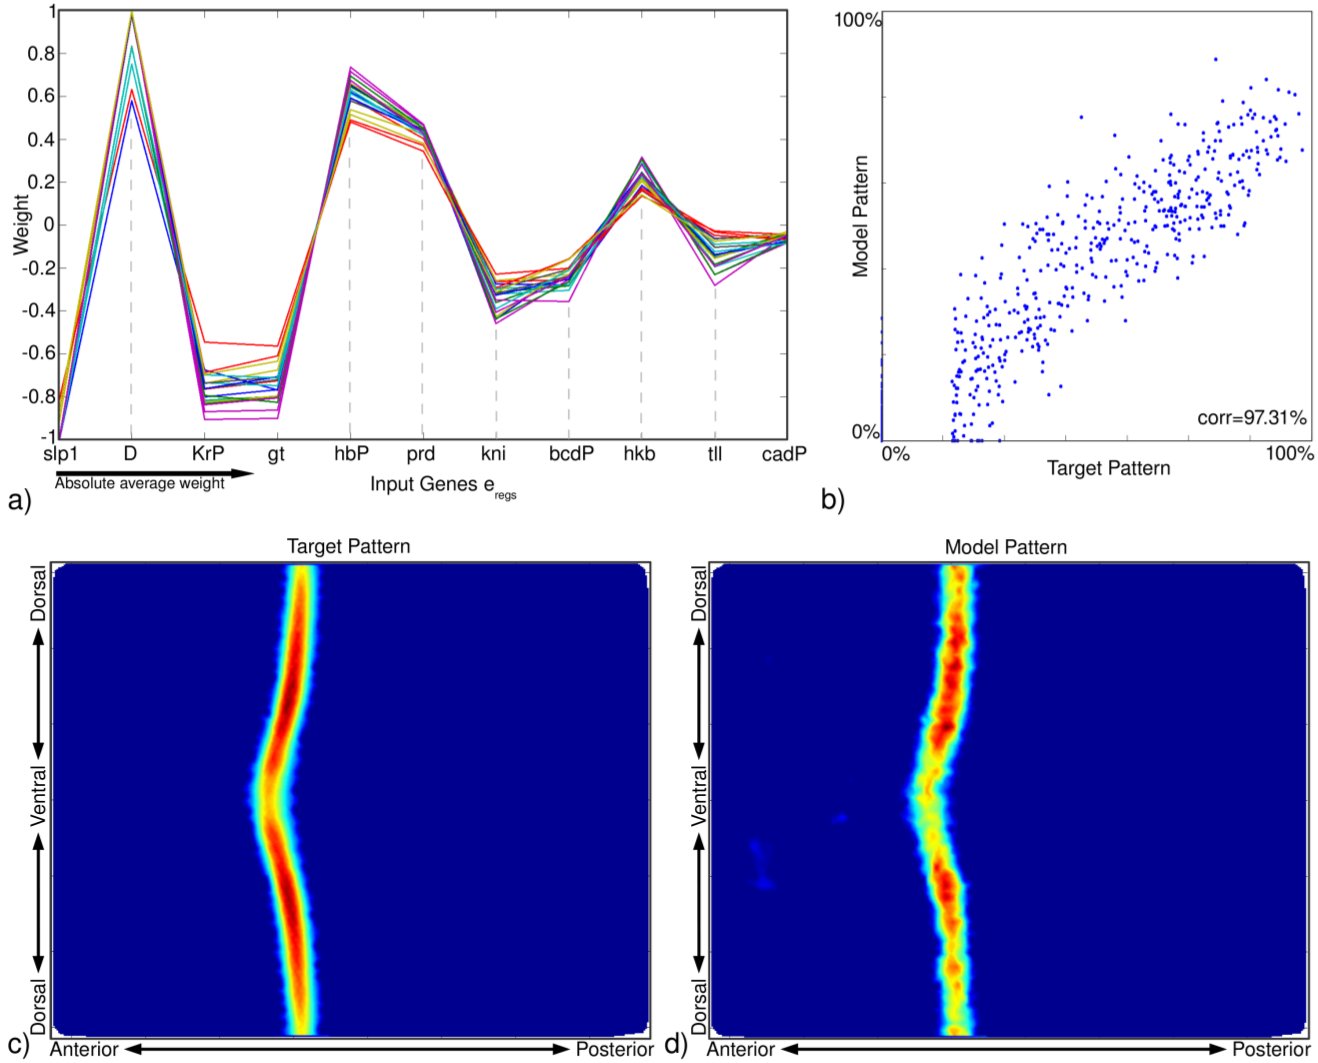
| Figure 2: (a) Overview of the design of a network modeling experiment using PCX and Matlab showing: (i) the set of input regulators eregs (green box), (ii) the target etarget (red box), (iii) an optional mask specifying the area of interest (blue box), and (iv) additional input parameters, such as the probability for crossings, pcross . (b) Overview of the modeling results for eve stripe 2 showing: a) curve plot showing the models from 20 repeats of the experiment. All models achieved a correlation of more than 97.x%, b) scatter plot of the target pattern and the best model pattern, and c,d) visualization of the target and model pattern with color indicating the relative expression (blue = low and red = high expression). We can see that the model fits the target well and even reproduces variations of the target stripe along the Dorsal/Ventral (D/V) axis. | |
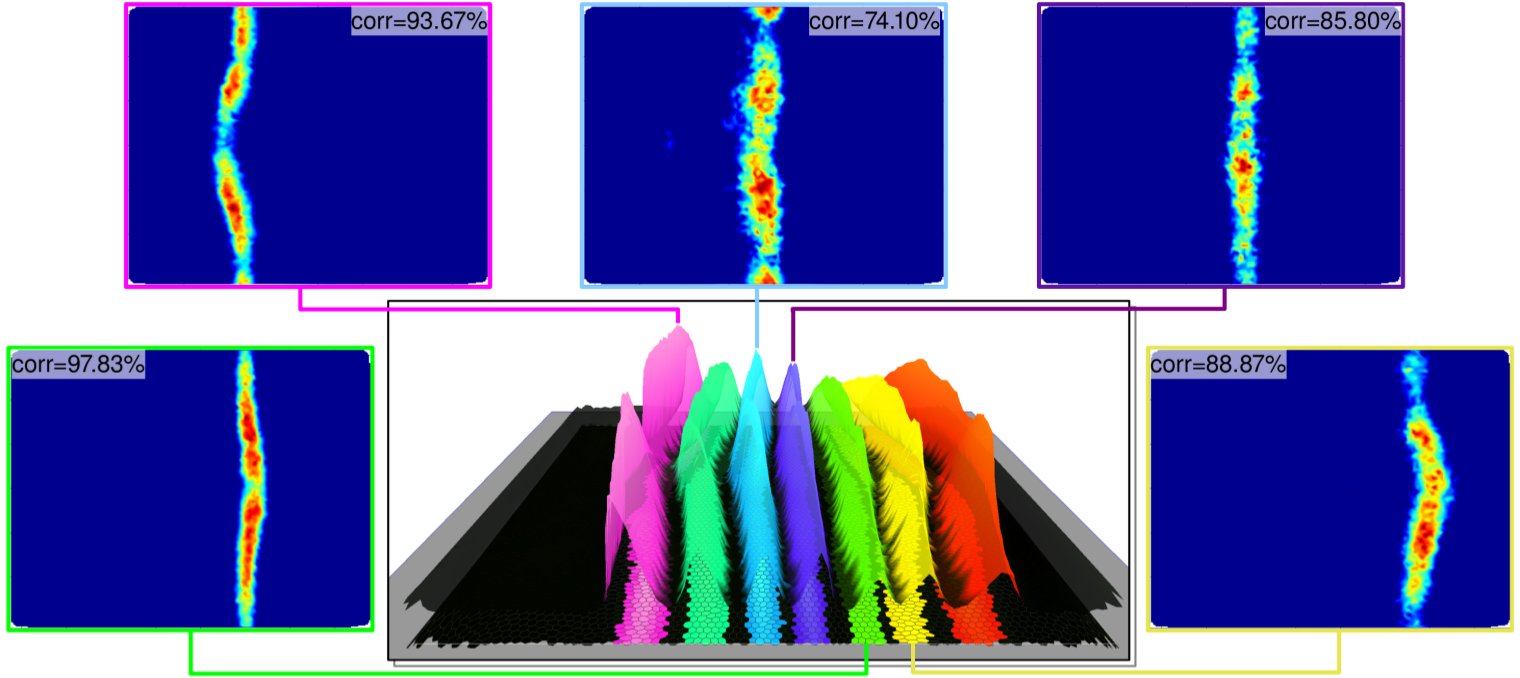 |
| Figure 3: Overview of the modeling results for eve stripes 1, 3, 4, 5, and 6. The correlation (corr) between the model and the corresponding target pattern are indicated at the top-left of each plot. |
References
[1] PointCloudXplore. http://bdtnp.lbl.gov/Fly-Net/bioimaging.jsp?w=pcx.[2] O. Rübel, S.V.E. Ker¨anen, M.D. Biggin, D.W. Knowles, G.H. Weber, H. Hagen, B. Hamann, and E.W. Bethel. Linking Advanced Visualization and MATLAB for the Analysis of 3D Gene Expression Data, pages 267–285. Mathematics and Visualization. Springer Verlag, Heidelberg, Germany, Jan 2012. LBNL-4891E, Presented by Oliver Ru¨bel at the 2nd International Workshop on Visualization in Medicine and Life Sciences 2009, Bremerhafen, Germany.
[3] O. Rübel, G. H. Weber, S .V .E. Keraenen, C. C. Fowlkes, C. L. Luengo Hendriks, L. Simirenko, N. Y. Shah, M. B. Eisen, M. D. Biggin, H. Hagen, J. D. Sudar, J. Malik, D.W. Knowles, and B. Hamann. Pointcloudxplore: Visual analysis of 3d gene expression data using physical views and parallel coordinates. In B. Sousa Santos, T. Ertl, and K.I. Joy, editors, Data Visualization 2006 (Proceedings of EuroVis 2006), pages 203–210, Aire-la-Ville, Switzerland, May 2006. Eurographics Association.
[4] Oliver Rübel, Gunther Weber, Soile V. E. Keraenen, Charless C. Fowlkes, Cris L. Luengo Hendriks, Lisa Simirenko, Nameeta Y. Shah, Michael B. Eisen, Mark D. Biggin, Hans Hagen, Damir Sudar, Jitendra Malik, David W. Knowles., and Bernd Hamann. PointCloudXplore: A Visualization Tool for 3D Gene Expression Data, volume S-4 of GI Lecture Notes in Informatics, pages 107–117. Gesellschaft fuer Informatik (GI), Bonn, Germany, June 2006. LBNL-62336.
[5] Oliver Rübel, Gunther H. Weber, Min-Yu Huang, E. Wes Bethel, Mark D. Biggin, Charless C.
Fowlkes, C. Luengo Hendriks, Soile. V. E. Keraenen, Michael B. Eisen, David W. Knowles, Jitendra Malik, Hans Hagen, and Bernd Hamann. Integrating data clustering and visualization for the analysis of 3d gene expression data. IEEE Transactions on Computational Biology and Bioinformatics, 7(1):64–79, March 2010. LBNL-382E.
[6] Oliver Rübel, Gunther H. Weber, Min-Yu Huang, E. Wes Bethel, Soile V. E. Keraenen, Charless C. Fowlkes, Cris L. Luengo Hendriks, Angela H. DePace, Lisa Simirenko, Michael B. Eisen, Mark D. Biggin, Hans Hagen, Jitendra Malik, David W. Knowles, and Bernd Hamann. PointCloudXplore 2: Visual Exploration of 3D Gene Expression. GI Lecture Notes in Informatics. Gesellschaft fuer Informatik (GI), 2008. LBNL-249E.
[7] Gunther H. Weber, Oliver Rübel, Min-Yu Huang, Anagla H. DePace, Charless C. Fowlkes, Soile V.E. Keraenen, Cristian L. Luengo Hendriks, Hans Hagen, David W. Knowles, Jitendra Malik, Mark D. Biggin, and Bernd Hamann. Visual exploration of three-dimensional gene expression using physical views and linked abstract views. IEEE Transactions on Computational Biology and Bioinformatics, 6(2):296–309, April-June 2009. doi:10.1109/TCBB.2007.70249. LBNL-63776.
Contact
Oliver Rübel1 MATLAB is a registered trademark of The MathWork Inc., 3 Apple Hill Drive Natick, MA 01760-2098, USA. Online at: http://www.mathworks.com/ .