This is an archival copy of the Visualization Group's web page 1998 to 2017. For current information, please vist our group's new web page.
High-performance Computing for Computational Finance
Problem Statement and Goals
After the dramatic Flash Crash of May 6, 2010, it took more than four months for the Securities and Exchange Commission (SEC) and Commodity Futures Trading Commission (CFTC) to issue a full report on the event. Such a long duration of time was required because the government currently relies on a m´elange of legacy systems, requiring access to a large number of data sources and processing of data in diverse data formats The SEC and CFTC clearly realized the limitations, and have proposed the development of a Consolidated Audit Trail System (CATS), a next-generation system for market monitoring.The goal of our work has been to evaluate how high-performance computing can support financial data analysis and, in particular, the development and implementation of early warning systems for detection and analysis of market anomalies. The development and evaluation of reliable indicators for market anomalies requires thorough analysis of the effectiveness of such indicators on large amounts of historic data. We, therefore, need to be able to store and process large amounts of financial data and efficiently compute market indicators. Evaluation and analysis of market anomalies and warning events generated by market indicators, then relies on the ability to quickly extract and analyze portions of data during which abnormal market behavior is indicated.
Implementation and Results
Data Format
Enabling efficient analysis of large amounts of data fundamentally
relies on effective data organization and storage to optimize I/O
performance and allow algorithms to quickly locate data records
of interest. Financial data is commonly stored in simple ASCII and
binary formats, like trades and quotes data (TAQ), or proprietary
binary data formats. Simple ASCII and binary formats are easily
accessible but are inefficient with respect to storage requirements:
they do not support efficient search operations, they are often not
portable (binary data only), and they are inefficient for parallel I/O.
Proprietary data formats often suffer from similar problems: they are
often opaque to the user, and they require the use of commercial,
black-box libraries for file access. Over the course of the last
decades, the HPC community has developed advanced, open scientific data
formats that address many of the data challenges the financial
community is facing. In this work we adopt HDF5---a state-of-the-art,
open, scientific data format---for storing financial data (see [1],
Figure 2) because it has been proven effective for I/O, storage, and
subselection of large amounts of data.Market Indicators
We next investigate the use of HPC resources to compute market indicators on large amounts of historic data in order to enable thorough evaluation of the effectiveness and reliability of market indicators . We here use the Volume Synchronized Probability of Informed Trading (VPIN) and a version of volume Herfindahl-Hirschman Index (HHI) as example market indicators. We treat the computation of VPIN and HHI on each stock or fund as a separate computational task. These tasks do not require any coordination among them which allows us to achieve good speedup. However, a key limitation to achieving perfect speedup is that the number of transactions, trades, and quotes varies greatly between stock symbols (and, hence, computational tasks), resulting in load imbalance. Therefore, a dynamic task scheduling method is needed to balance the amount of work assigned to each process.This work has also provided us with evidence that HHI and VPIN can produce strong signals before market disruptions, such as the Flash Crash of 2010. In Figure 1, we observe a sharp rise for both HHI and VPIN at 13:35. This was about 70 minutes before the Flash Crash, slightly before the time frame examined in detail in the official report on the Flash Crash by the SEC/CFTC. This trend suggests that both VPIN and HHI might have detected early indications of market anomalies missed by the investigators, illustrating the potential of VPIN and HHI as early warning signals. The particularly sharp rise in VPIN and HHI for ACN is directly linked to an unusually large trade at 13:36:07. The volume of this single trade was 470,300 shares, which was almost 10\% of the average daily volume for ACN. The impact of such a large trade on VPIN and HHI needs to be further examined.
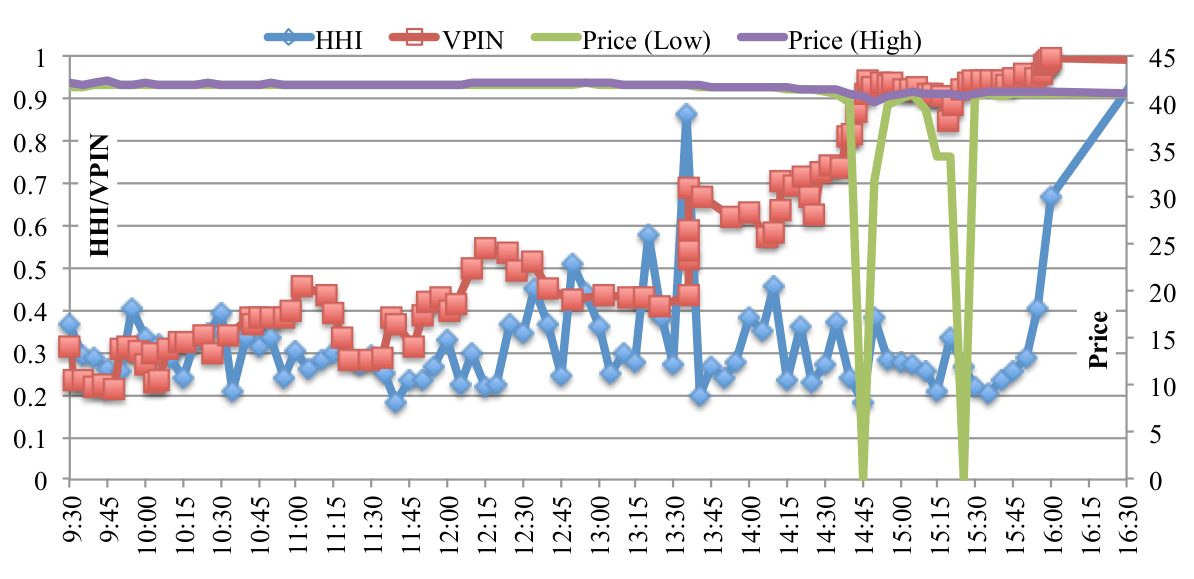 |
| Figure 1: Market indicator HHI (blue) and VPIN (red) values for ACN on May 6, 2010. The minimum (green) and maximum (lilac) prices shown are computed in each 5-minute bin. We observe a sharp rise for both HHI and VPIN at 13:35---more than one hour before the Flash Crash---, illustrating the potential of VPIN and HHI as early warning signals. |
Query-driven Analysis, Exploration and Validation
Typical scientific analysis applications require a single (or a few) queries to be evaluated on extremely large data. In contrast, the screening of financial data requires the evaluation of a large number of independent data queries (one query per combination of date and market). Similarly, validation of market indicators fundamentally relies on the ability to quickly locate and extract data associated with large numbers of indicated warning periods---e.g, for HHI we find 298,956 potential warnings for S\&P 500 stocks during April 2010.To allow analysts to quickly define large sets of queries, we extend the FastQuery query language using symbolic queries. A symbolic query is a compact
representation of a large number of queries using reserved keywords (here DATE and SYMBOL) to represent data categories. The user can then select, from simple lists, the specific dates and symbols for which a symbolic query should be executed. The symbolic query is then expanded into #dates * #symbols queries on behalf of the user. In the case of market indicators, large sets of warning events are created automatically by the screening process. Warnings have an associated date, symbol, and time period and are automatically translated to corresponding queries to extract the data associated with warning events. Figure 2 illustrates the scalability for parallel evaluation of large numbers of market warnings and the acceleration of market queries using bitmapindexing based on FastQuery and FastBit. Using this approach reduced the time required to evaluate 8000 warning queries to just 4.59 seconds, which constitutes a speedup of 303 compared to the 1391.76 seconds required for evaluating the same set of queries in serial without bitmap indexing. We use standard spreadsheet and statistics plots to allow the analyst to quickly browse and select warnings of interest and to validate queries and market-indicator
warnings (see Figure 3).
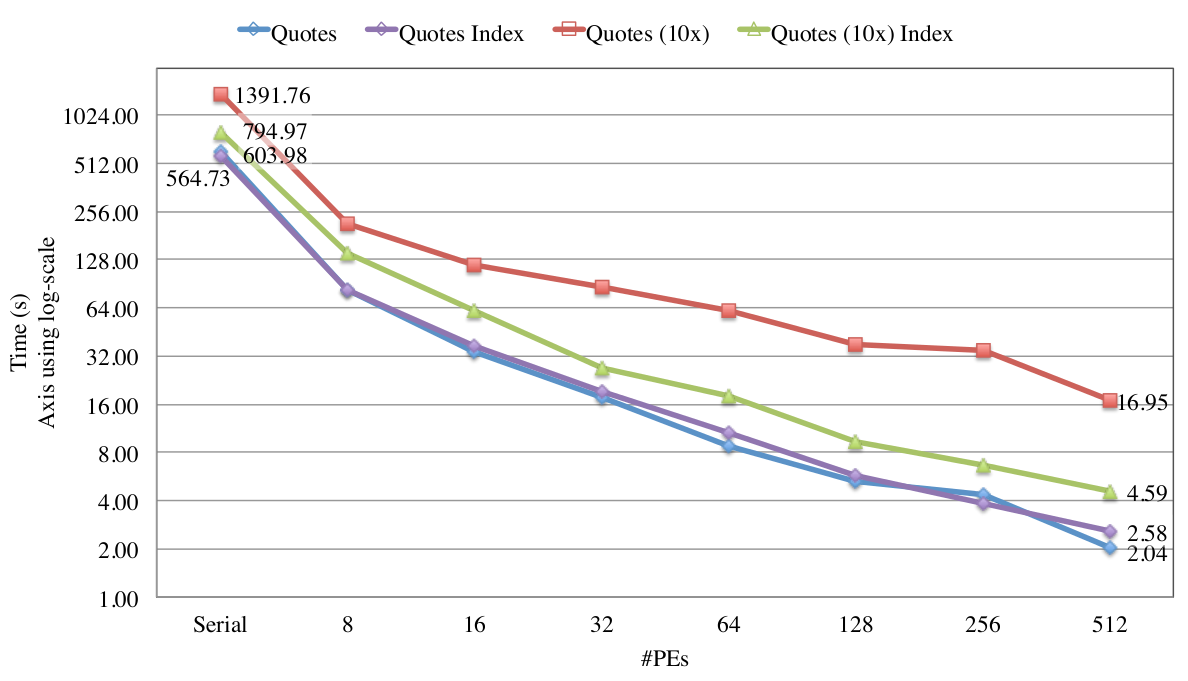 |
| Figure
2: Time (seconds) needed to evaluate 8000 queries using different
numbers of processors on S&P 500 quotes data for April 2010 using:
i) a sequential scan of the raw data (lilac) and ii) using parallel
bitmap indexing using FastQuery (blue). To evaluate the expected
performance on larger amounts of financial data, we show the results
for the same dataset with 10X replication (green) and with indexing
(red). Note the log-scale on the vertical time axis. Even on the very
large 744.7GB HDF5 dataset, we are able to evaluate all 8000 queries in
less than 5 seconds, illustrating how the use of parallel computing and
bitmap indexing enables us to evaluate the effectiveness of market indicators on large amounts of historic data. |
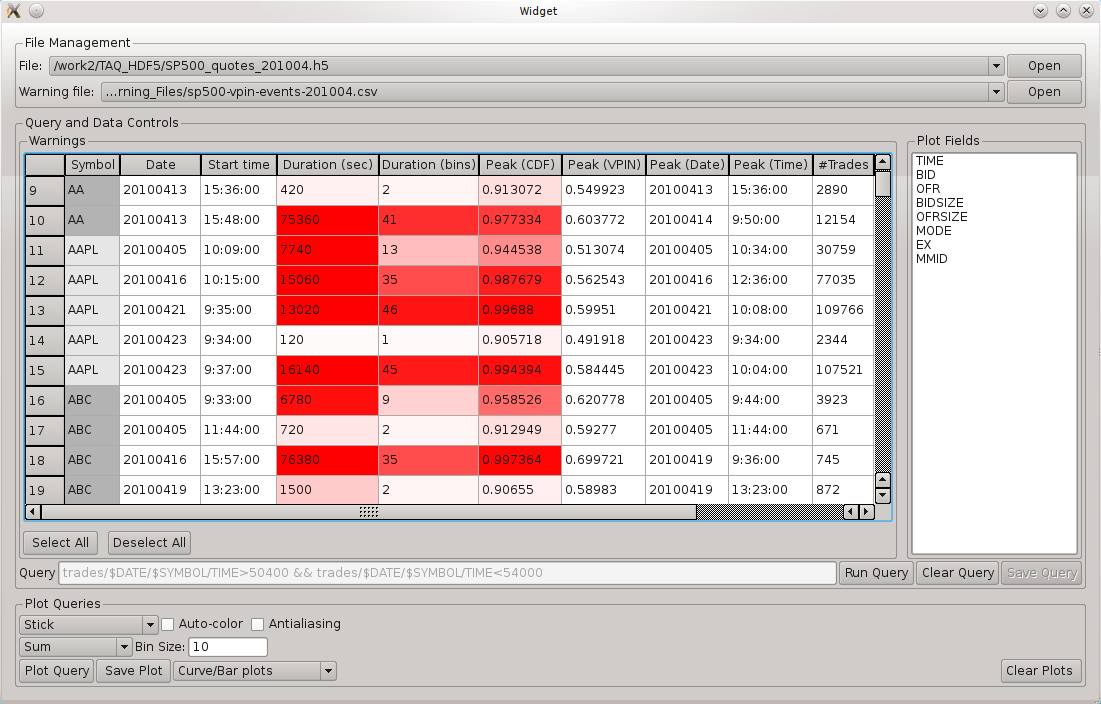 |
| Figure 3: Graphical user interface for evaluating market indicator-based warnings. |
This work is discussed in more detail in a 2012 Journal of Trading article by Bethel, Leinweber, Rübel, and Wu [2] and a previous SC11 workshop paper [1].
Impact
Our work suggests that supercomputing tools and methods could be valuable to market regulators in achieving the goal of market safety, stability, and security. Current post Flash Crash regulatory approaches are based on ``circuit breakers,`` which suspend trading when a price or volatility triggers set them off. Circuit breakers are very ``blunt instruments`` that do not allow the market to self-correct and stabilize, and they can easily make a bad situation worse. Some believe a more graduated approach, similar to the ``yellow light`` approach in motorsports to slow down traffic, might be a better way to achieve the same goal. Our tests showed that VPIN, HHI, and similar indicators could provide early warning signals for a more gradual ``slow down, rather than stop`` replacement for on/off circuit breakers. Our high-frequency trading (HFT) and academic collaborators strongly agree with this opinion as well.This work explores a number of pressing issues in implementing such an ``early warning`` system, such as the need for sufficient computing power to generate the warning signals and the need for reliable and effective data. We demonstrate that techniques from data-intensive sciences can address these issues. Furthermore, we believe that the same approach, likely with additional computation, are applicable in the area of financial market cyber-security, which is widely acknowledged as important, but also largely ignored in the regulatory debate.
References
[1] E. Wes Bethel, David Leinweber, Oliver Rübel, Kesheng Wu (authors in alphabetical order), Federal Market Information Technology in the Post Flash Crash Era: Roles of Supercomputing, Workshop on High Performance Computational Finance at SuperComputing 2011 (SC11), LBNL-5263E, (PDF), (BibTeX). Extended version available at SSRN id1939522 or here.[2] E. Wes Bethel, David Leinweber, Oliver Rübel, Kesheng Wu (authors in alphabetical order), Federal Market Information Technology in the Post Flash Crash Era: Roles of Supercomputing, The Journal of Trading, Spring 2012, Vol. 7, No. 2, pp. 9-24, DOI: 10.3905/jot.2012.7.2.009 (this article is an extended version of 2011.2) (BibTeX) (article at JOT)
Press Coverage
- Herbert Lash, "Post 'flash crash' monitoring emerges at Berkeley," Reuters.com.
- Jason Zweig, Could Computers Protect the Market From Computers?, Wall Street Journal.com )