This is an archival copy of the Visualization Group's web page 1998 to 2017. For current information, please vist our group's new web page.
High Performance Visualization—Performance Optimization
Problem Statement and Goals
As computer architectures evolve towards the exascale—through a combination of increased core count per chip, and deeper and more complex memory hierarchies—it is increasingly difficult to achieve optimal algorithmic performance due to increasing architectural complexity. There are many open research questions as we move towards the exascale, including understanding the relationship between tunable algorithmic parameters and algorithmic optimizations, and their performance impact on evolving computational architectures.
Many algorithms, in particular parallel algorithms, have numerous tunable parameters. One such parameter of particular interest here is the degree of concurrency, or number of processing threads, per multi- or many-core processor. Another parameter of interest is the blocking factor, or the amount of work assigned to each processing thread. In both cases, there is a trade-off between load balance, effective use of the memory hierarchy, runtime, etc. One objective of our work is to find the "sweet spot" in performance—to characterize and better understand how and why different parameter settings lead to variations in performance. Additionally, we aim to better understand the interplay between algorithmic optimizations, tunable algorithmic parameter settings, and the resulting performance on modern computational platforms.
Implementation and Results
Our approach is to leverage auto-tuning work that has been applied by the computational science research community to numerical solver kernels. In our research, we vary tunable algorithmic settings, along with known algorithmic optimizations and two different memory layouts, and measure performance in terms of absolute runtime, along with L2 memory cache misses.
Our work focuses on the study of two different core algorithms. The first is raycasting volume rendering, a staple visualization algorithm, which has unstructured memory access patterns. The other is a 3D bilateral filter, which uses a structured memory access pattern in the form of a convolution kernel.
The volume rendering study examines the interplay between work block size, in the form of the size and shape of image tile associated with each processing thread, and the resulting performance. We apply auto-tuning principles to examine performance under varying work block sizes to find those configurations that perform the best. We also include two different algorthmic optimizations—early ray termination and Z-order memory layout—and study the interplay between work block size and the algorithmic optimizations.
Our results, which will appear in Bethel and Howison 2012 [2,3], indicate there is a wide variation in performance on all platforms, with differences up to as much as 254% for the tunable parameters we test on multi-core CPUs and 265% on many-core GPUs, and the optimal configurations vary across platforms, often in a non-obvious way.
|
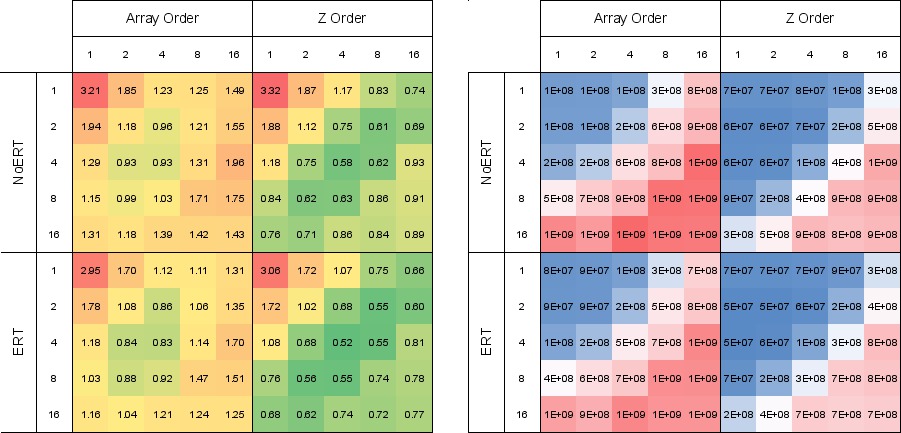
| Figure 1: Runtime (a) and L2 cache misses (b) averaged over 10 views for different thread block sizes on the NVIDIA/Fermi with varying memory layout and early ray termination (ERT). Grey boxes indicate thread blocks with too few threads to fill a warp of execution. The unexpected result here is that better runtime performance does not necessarily correspond to better memory utilization on this particular platform. This result would likely have not been possible to discover using a predictive performance model, and reinforces the argument that finding optimal performance on increasingly complex architectures often times requires a search of tunable algorithm parameter space and algorithmic optimizations. |
For example, our results, shown in Figure 1, indicate the optimal configurations on the GPU occur at a crossover point between those that maintain good cache utilization and those that saturate computational throughput. This result is likely to be extremely difficult to predict with an empirical performance model for this particular algorithm because it has an unstructured memory access pattern that varies locally for individual rays and globally for the selected viewpoint.
For the 3D bilateral filter, we observe that there is a 7.5x performance variation depending on work block size; a 2x performance variation depending upon the inner loop in each processing thread iterates over width, height, or depth; and a 2x performance gain when storing precomputed filter weights in local, high-speed, on-chip cache memory when compared to using global memory as a cache.
This work is presented in more detail in a 2012 technical report [1] and book chapter [3].
Impact
Our research shows that high performance visualization algorithms, and related data-intensive cousins, stand to reap huge performance gains through careful tuning that has worked well in the computational science community. For example, the set of experiment runs in our work in hybrid-parallel volume rendering work consumed on the order of 5M CPU hours. Had we not first conducted the performance optimization and auto-tuning work described in this study, the estimated runtime of the untuned code would have been on the order of 15M CPU hours.
Some of the study's results are unexpected, namely those for the GPU: absolute runtime and memory utilization performance are a function of both blocking factor and device-specific behavior (thread divergence) that is unique to this type of processor and architecture. These benefits will likely become more pronounced in the future as the number of cores per chip and the cost of moving data through the memory hierarchy both increase. Our results raise several new interesting research questions for follow-on work, including use of some form of auto-tuning as part of routine initialization to enable platform-specific optimizations on the part of data-intensive applications.
References
[1] E. Wes Bethel. Exploration of Optimization Options for Increasing Performance of a GPU Implementation of a Three-Dimensional Bilateral Filter. Technical Report LBNL-5406E, Lawrence Berkeley National Laboratory, Berkeley, CA, USA, 94720, 2012.[2] E. Wes Bethel and Mark Howison. Multi-core and Many-core Shared-memory Parallel Raycasting Volume Rendering Optimization and Tuning. International Journal of High Performance Computing Applications, (In press), 2012. LBNL-5362E.
[3] E. Wes Bethel and Mark Howison. Performance Optimization and Auto-Tuning. In E. Wes Bethel, Hank Childs, and Charles Hansen, editors, High Performance Visualization, pages 307–329. CRC Press/Taylor & Francis Group, Boca Raton, FL, USA, 2012.