This is an archival copy of the Visualization Group's web page 1998 to 2017. For current information, please vist our group's new web page.
Parallel I/O, Analysis and Visualization of a Trillion Particle Simulation
Problem Statement and Goals
Petascale plasma physics simulations have recently entered the regime of simulating trillions of particles. These unprecedented simulations generate massive amounts of data, posing significant challenges in storage, analysis, and visualization. In this work, we considered VPIC, a state-of-the-art plasma physics particle simulation code that ran on 120,000 hopper cores and produced approximately 30TB of data for a single timestep. In order to support scientific analysis in this new regime of petascale plasma physics simulations, we tackle the following computer science research problems:
- What is a scalable I/O strategy for storing massive particle data output?
- What is a scalable strategy for conducting analysis on these datasets?
- What is the visualization strategy for examining these datasets?
We are also interested in addressing the following scientific research questions:
- Analysis of highly energetic particles:
- Are the highly energetic particles preferentially accelerated along the magnetic field?
- What is the spatial distribution of highly energetic particles?
- What are the properties of particles near the reconnection hot-spot (the so-called X-line)?
- What is the degree of agyrotropy in the spatial vicinity of the X-line?
Implementation and Results
Some highlights from our work are as follows:
|
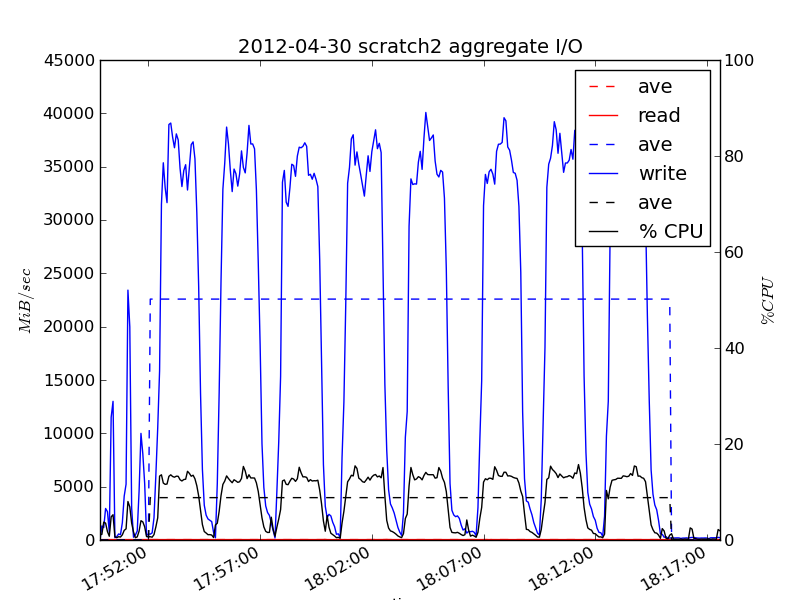
| Figure 1. The 120K core VPIC run showed comparable performance except for a couple of slow servers. The slower servers lead to a small amount of I/O continuing after the bulk had completed, and leads to the slightly wider gaps between individual variable dumps. |
- We demonstrate the application of H5Part, a particle data extension of parallel HDF5, for enabling high performance parallel I/O in writing the one trillion electrons. Figure 1 shows an average write performance of 27GB/s on hopper (out of a 35GB/s theoretical max). We are able to obtain peak I/O rates for a significant amount of time.
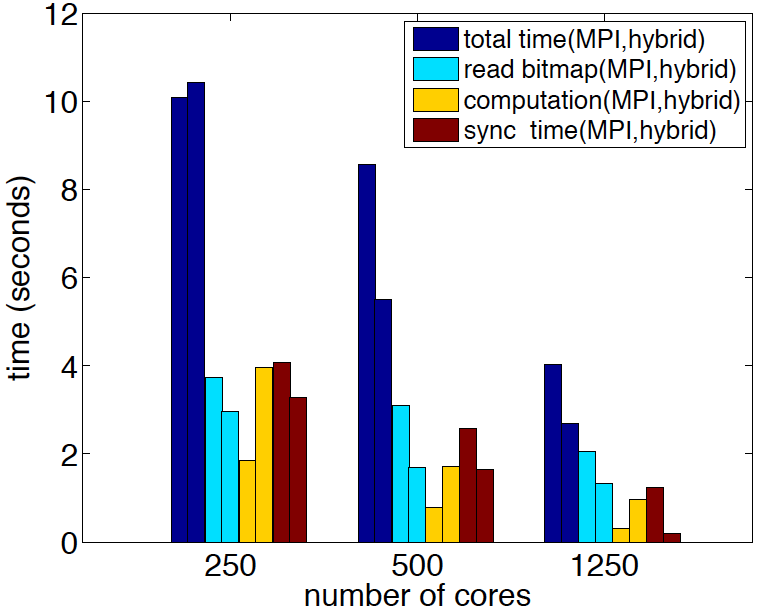
- We collaborated with researchers in the LBL SDM group to apply a hybrid parallel version of FastQuery using both MPI and pthreads to enable scalable indexing and querying for the trillion particle dataset. Figure 2 shows that the implementation took 10 seconds to index the data. We were able to query the data for energetic particles in 3 seconds.
- We use query-based visualization to quickly identify and render particles of interest. We apply all of these capabilities to target open scientific analysis problems, which were simply impossible to address before due to challenges posed by the large volume of data.
|
| Figure 2. Time for querying 1 trillion particles with different number of cores. |
Analysis of highly energetic particles
We applied the analysis and visualization tools developed in this project towards addressing a number of open scientific problems.

|
| Figure 3. Visualization of the 1 trillion electron dataset at timestep 1905 showing all particles with Energy > 1.3 (gray). In addition, all particles with Energy > 1.5 are shown in color, with color indicating Energy. The queries result in 164,856,597 particles with Energy > 1.3 and 423,998 particles with Energy > 1.5. The particles appear to be accelerated preferentially along the direction of the mean magnetic field (oriented at 45° in the x-y plane), corresponding to formation of four jets. The distribution of energetic particles is asymmetric, with the most energetic particles acquiring negative Uy. |
|
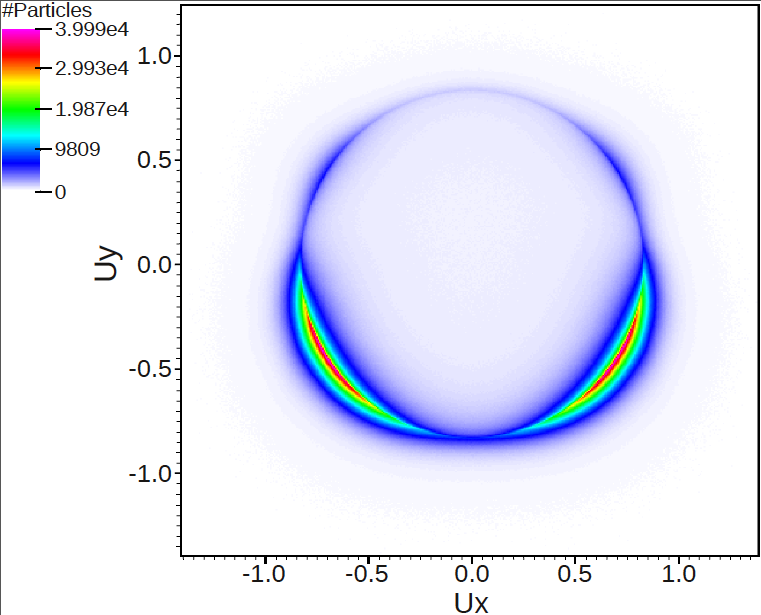
| Figure 4. Visualization of the 1 trillion electron dataset at timestep 1905 showing the density of all particles with Energy > 1.3 (see also Figure 3). |
|
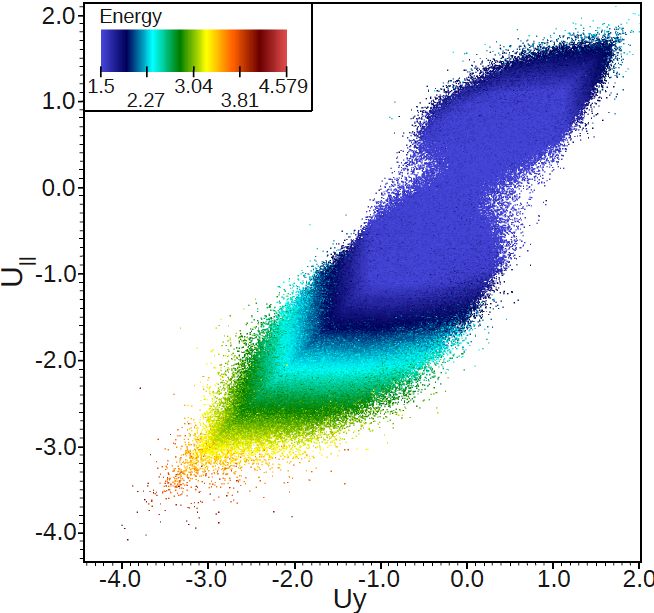
| Figure 5. Scatter plot showing all particles with Energy > 1.5 (see also Figure 6) in Uy and U|| space colored by Energy. We observe a strong positive correlation between Uy and U||. The particles of highest Energy appear in regions of high negative U|| (and Uy) values, indicating that the high energy particles are aligned (i.e., move parallel) to the magnetic field. |
|
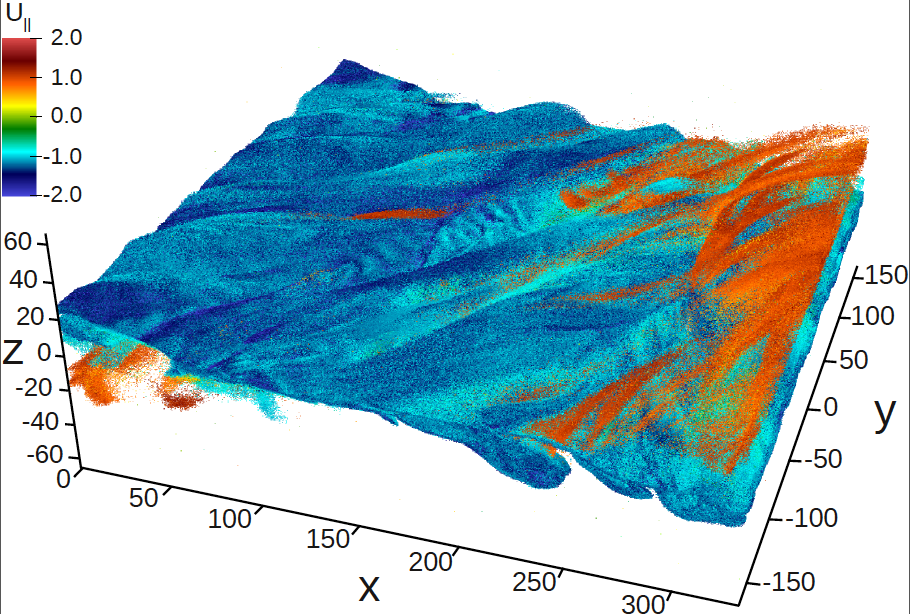
| Figure 6. Plot showing all particles with Energy > 1.5. The query selects 57,740,614 out of the 114,875,956,837 particles, i.e., approximatel 0.05% of all particles. Color indicates U||. We observe different particle structures with strong positive (red) and negative (blue) U|| values. |

|
| Figure 7. Isosurface plot of the positron particle density np with color indicating the magnitude of the total current density |J|. Note the logarithmic color scale. The blue box (indicated by the arrow) is located in the X-line region of the simulation and illustrates the query (157.654 < x < 1652.441) && (-165 < y < -160.025) && (-2.5607 < z < 2.5607), which we use in Figure 8 to study agyrotropy. |

|
| Figure 8. Particle scatter plot (black) of Uperpendicular,1 vs. Uperpendicular,2 of all energetic particles (with Energy > 1.3) contained in the box in the x-line region indicated in Figure 7. Additional isocontours indicate the associated particle density (blue=low density and red=high density). The complete query used to extract the particles is defined as: (Energy>1.3) && (157.654 < x < 162.441) && (-165 < y < -160.025) && (-2.5607 < z < 2.5607). The query results in a total of 22,812 particles. The elliptical shape of the particle distribution is indicative of agyrotropy in the X-line region. |
Are the highly energetic particles preferentially accelerated along with the magnetic field?
Figures 3 and 4 show the phase space of particles with energies > 1.3 from the 1 trillion particle dataset. Even though the dataset corresponds to an early time in the simulation, these two figures clearly show that magnetic reconnection has already started. Phase space formation of reconnection generated energetic jets at 45° in the x-y plane, corresponding to the direction of the average magnetic field, is apparent, especially in the 2D density plot in the Ux-Uy plane (Fig. 4). These figures also show evidence of preferential acceleration of the plasma in the direction parallel to the average magnetic field as evidenced by the highly distorted distribution function in the x-y plane in Figure 3.. Another important finding evident from the phase space figures is that energetic particles carry significant current. These two findings, enabled for the first time through the new analysis capabilities discussed here, are quite encouraging and are leading us to formulate new questions regarding the particle behavior in 3D reconnection.
What is the spatial distribution of highly energetic particles?
As is illustrated by Figure 6, energetic particles are predominantly located within the current sheet, suggesting they carry significant current. These results also suggest that the flux ropes can confine energetic particles (as illustrated by the red regions in Fig. 6).
What are the properties of particles near the reconnection hot-spot?
Figure 8 shows the particle distribution F(Uperpendiculr,1,Uperpendicular,2) in the vicinity of an X-line. The particles are selected in a small box, as indicated in Figure 7. The distribution clearly shows the agyrotropy of the distribution, i.e., the lack of cylindrical symmetry about the local magnetic field.
Impact
The query-based visualization techniques presented in this work have enabled us to explore and gain insights from massive particle datasets for the first time. We have verified localization behavior of energetic particles, gained insights into relationship between the structure of magnetic field and energetic particles, and discovered agyrotropic distribution of particles near the reconnection hot-spot in 3D. Several of these phenomena have been conjectured about in the past, but it is only by the development and application of these new analysis capabilities that we can unlock the scientific discoveries and insights present in these unprecedented simulations.
References
[1] Surendra Byna, Jerry Chou, Oliver ubel, Prabhat, Homa Karimabadi, William S. Daughton, Vadim Roytershteyn, E. Wes Bethel, Mark Howison, Ke-Jou Hsu, Kuan-Wu Lin, Arie Shoshani, Andrew Uselton, and Kesheng Wu. Parallel I/O, Analysis, and Visualization of a Trillion Particle Simulation. In SuperComputing 2012 (SC12), Salt Lake City, Utah, USA, November 2012. LBNL-5832E.
Additional information:
Contact
Prabhat, Suren Byna, Oliver Rubel.