This is an archival copy of the Visualization Group's web page 1998 to 2017. For current information, please vist our group's new web page.
Current Projects
| SENSEI: Extreme-scale in situ methods and infrastructure | A fact of life on current and future HPC platforms is the increasingly arduous task of writing out data to persistent storage, thus impeding or prevening scientific discovery as data goes unanalyzed. In situ methods work around this problem by performing analysis, visualization, and related processing while the data is still resident in memory. The SENSEI project focuses on a set of challenges relating to effectively using in situ methods and infrastructure at scale. For more information, please visit the SENSEI website. |
| XDATA: Data fusion across domains |
Data fusion, analysis and reduction can bring an exascale data regime to a manageable task. With support from ASCR (e.g. DOE Early Career), UC Berkeley BIDS, and Science without Frontiers, the XDATA team is focusing on scaling Analytics for image-centric experimental data. Investigation areas include: (1) emerging algorithms for dealing with complex and large datasets; (2) pattern recognition and machine learning applied to scientific data; (3) how to efficiently explore advances in evolving computer architectures. We expect that some of our algorithms and software tools will enable the broader science community to benefit from our projects, and ideas. XDATA website |
| ExaHDF5: Advancing HPC I/O to Enable Scientific Discovery | Modern computational science faces a number of challenges on the path to exascale. Simulation codes are producing massive amounts of data that need to be stored, visualized, and analyzed on increasingly complex hardware in order to gain scientific insights. Our proposed work consists of three thrust areas that address these contemporary challenges. First, we will provide high performance I/O middleware that makes effective use of computational platforms, researching a number of optimization strategies and deploying them through the HDF5 software. Second, we will improve the productivity of application developers by hiding the complexity of parallel I/O via new auto-tuning and transparent data re-organization techniques, and by extending our existing work in easy-to-use, high-level APIs that expose scientific data models. Third, we will facilitate scientific analysis for users by extending query-based techniques, developing novel in situ analysis capabilities, and making sure that visualization tools use best practices when reading HDF5 data. Our research is driven by close collaborations with a broad range of DOE science codes; we will ensure that new capabilities are responsive to scientists’ emerging needs and are deployed in production HPC environments. Our approach includes a clear path for release and maintenance of software, enabling the broader science community to benefit from our project. ExaHDF5 website. |
| Topology-based Visualization and Analysis of Multi-dimensional Data and Time-varying Data at the Extreme Scale |
Computing at the extreme scale makes it possible to simulate physical phenomena
of unprecedented complexity, comprising a growing number of dependent model
variables and spanning time periods of increasing length. Without aggressive
improvements in data analysis technology, we will not be able to analyze
effectively future simulation results and derive new insights from those
simulations. In this project, we will develop topology-based data methods for
analysis of extreme scale data. In particular, we will (i) adapt current
topology-based methods to massively parallel architecture, (ii) use
topology-based methods for |
| High Performance Visualization: Query-Driven Visualization | One of our research thrusts in high performance visualization is known as "query-driven visualization." In this approach, visualization and analysis processing is restricted to a set of data deemed to be "interesting." This approach is an alternative to other techniques that result in ever larger, scalable systems. |

Previous Projects
|
Accelerator SAP & H5Part Development |
The Accelerator SAP project aims to develop a simple HDF5 (Hierarchical Data Format) file schema as well as an API that simplifies reading and writing using the HDF5 library suitable to the Accelerator Modelling community. The motivation for this work is to produce a file format that is suitable for large-scale particle simulations. The requirements are the following: it must be machine independent, self-describing, easily extensible, language independent, efficient (serial and parallel) and produces files that are seamlessly shared by different programs. More information |
| ASCEM: Advanced Simulation Capability for Environmental Management | The LBNL Visualization Group leads the Visualization Task within the larger ASCEM project. In brief, ASCEM is all about developing the technology needed to leverage high powered computational systems to study and solve challenging environmental management problems (more information). Our role is to provide the technology to enable visual data analysis and exploration of a diverse set of simulation and observed data: we provide the means to see and understand complex scientific phenomena in the form of powerful and easy-to-use software. (Links coming soon.) |
| Scalable Statistics and Machine Learning for Data-Centric Science | Extracting insights from Big Data will be essential for scientific progress in the foreseeable future. A critical capability in facilitating Big Data Analysis is the development of scalable statistics and machine learning algorithms that can operate on real-world datasets produced by a diverse range of experimental and observational facilities. This project will develop and apply new statistics and machine learning algorithms: we are working on randomized and approximation algorithms for dimensionality reduction and clustering. We are developing stochastic optimization techniques for large-scale inference, and extend deep learning algorithms to work on scientific spatio-temporal datasets. Finally, we are developing scalable graph algorithms that work directly on the input dataset without resorting to expensive computation of all-pairs similarities. We will apply these methods to a diverse range of analysis problems in cosmology, climate, bio-imaging, genomics, particle physics and other domain sciences. We will implement these algorithms in scalable codes that are capable of processing TB-sized datasets on petascale platforms. Our interdisciplinary team consists of experts in statistics, machine learning, graph analytics high-performance computing, data management and domain sciences. Links coming soon. |
| SciDAC Visualization and Analytics Center for Enabling Technology
(VACET)
|
This project focuses on leveraging scientic visualization and analytics software technology as an enabling technology for increasing scientific productivity and insight. Advances in computational technology have resulted in an "information big bang," which in turn has created a significant data understanding challenge. This challenge is widely acknowledged as one of the primary bottlenecks in contemporary science. The vision for our Center is to respond directly to that challenge by adapting, extending, creating when necessary and deploying visualization and data understanding technologies for our science stakeholders. Using an organizational model as a Visualization and Analytics Center for Enabling Technologies (VACET), we are well positioned to be responsive to the needs of a diverse set of scientic stakeholders in a coordinated fashion using a range of visualization, mathematics, statistics, computer and computational science and data management technologies. VACET website: www.vacet.org. |
| Visual Data Analysis of Ultra-large Climate Data | Our team, consisting of climate, computational, and computer scientists, aims to develop, deploy, and apply parallel-capable visual data exploration and analysis software infrastructure to meet specific needs central to the DOE-BER climate science mission. Our approach focuses on using a set of science drivers, which reflect challenges in understanding regional-scale climate-change phenomena, as the basis for a coordinated eort that includes visualization of ultra-large data, statistical analysis, and feature detection/tracking techniques. Our aim is to deliver new capabilities needed by the climate science community to tackle problems of the scale required by Intergovernmental Panel on Climate Change (IPCC) Assessment Report 5 (AR5) objectives. We're focusing our efforts on the comprehensive collection of near-term simulations that ORNL, one of the partners on this project, will conduct using the DOE-NSF Community Climate System Model (CCSM) in support of DOE's contributions to AR5. We'll deliver our software to the climate community via CDAT, a well-established software framework for climate data access and analysis. This approach ensures that the proposed technology advances meet specific DOE mission-critical climate science needs, and that the resulting technology will reach a large audience in the climate science community via deployment in a well-established and widely used software framework. (Links coming soon.) |
| SciDAC-e: Visualization and Analysis for Nanoscale Control of Geologic CO2 | The objective of the Energy Frontier Research Center (EFRC) for Nanoscale Control of Geologic CO2 is to develop an understanding of the processes related to the geologic sequestration of CO2. For this purpose, the EFRC collects experimental 2D and 3D imaging data in order to investigate the fluid-fluid and fluid-rock interactions. Understanding these are key to being able to develop numerical models that describe flow and transport of CO2-rich fluids in geologic reservoirs. To improve the EFRC's data understanding capabilities, we: (1) are developing image processing capabilities to automate measurements (e.g., contact angles, location of the fluid-fluid interface, rates of dissolution/precipitation) in both experimental and simulated data; (2) evaluating and improving material surface reconstruction algorithms with the goal of deriving quantitative measurements from simulations that can be compared to experimental data; (3) using topological analysis to define and track features over time as well as detect larger-scale features in the simulation that can be compared to simulations at coarser scale. Our work will give EFRC researchers and their collaborators the necessary tools to visualize and analyze their data effectively and improve their understanding of processes governing carbon sequestration. (Links coming soon.) |
| SciDAC-e: Accelerating Discovery of New Materials for Energy-related Gas Separations through PDE-based Mathematical and Geomtrical Algorithms and Advanced Visualization Tools | We are employing and extending the expertise of the SciDAC Visualization and Analytics Center for Enabling Technology (VACET) to develop new algorithms and software tools that will enhance and support comp[utational research conducted within the Energy Frontier Research Center for Gas Separations Relevant to Clean Energy Technologies. The core parts of our work are: (1) to capitalize on recent breakthrough prototype algorithms for screening chemical systems to greatly reduce the landscape of potential candidate materials. These algorithms, developed within LBNL, automatically detect and characterize void space in porous materials, and, in particular, detect inaccessible volumes, calculate accessible/inaccessible volumes, surface areas, and pore sizes. By moving these algorithms to high performance computing platforms, we allow EFRC researchers to tackle and analyze highly complex material structures and properties. (2) to incorporate VisIt into the EFRC researchers' workflow, to develop a data model strategy for handling large datasets, to develop modules ti import their data into VisIt, and gerate custom capabilities within Visit for science-specific needs. These new capabilities will enable EFRC researchers to gain valuable insights into porous materials and their applicability to gas separation. (Links coming soon.) |
| Deep Sky Map | In response to the needs of several astrophysics projects hosted at NERSC, P. Nugent has begun to create an all-sky digital image based upon the point-and-stare observations taken via the Palomar-QUEST Consortium and the SN Factory + Near Earth Asteroid Team. The data spans 7 years and almost 20,000 square degrees, with typically 10-100 pointing on a particular part of the sky. The entire dataset is 60 TB and will create both a temporal and static catalog of astrophysical objects. When completed, the Deep Sky Map will serve as a reference dataset for use by the astrophysical research community. This work was conducted as part of the NERSC Analytics team effort to support a large body of astrophysics researchers who have projects hosted at NERSC. More information. |
| svPerfGL Scientific Visualization OpenGL graphics benchmark |
svPerfGL is an OpenGL benchmark intended to measure "real world" performance of scientific visualization applications. These applications are characterized by relatively high payload (i.e., lots of triangles) with relatively few OpenGL state changes. This application takes as input disjoint triangle payload contained in files in netCDF format, renders the frames over a user-specified time duration, rotates the entire scene by one degree per frame, then computes and reports a "triangles per second" performance metric upon exit. More information. |
| MBender | MBender, or "media-bender", is a research project that focuses on leveraging standard and novel media delivery mechanisms to support interactive, 3D scientific visualization in a remote and distributed context. We leverage QuickTime VR Object movies as a delivery vehicle to support remote, interactive, 3D visualization, and are exploring ways to add multiresolution capability to overcome the fixed-resolution limits of QuickTime VR. More information. |
| Adaptive Mesh Refinement (AMR) Visualization | AMR data consists of block-structured, hierarchical meshes. AMR is used prolifically by the Applied Numerical Algorithms Group and Center for Computational Science and Engineering at LBNL. AMR is useful for locally increasing resolution in a simulation without incurring the cost of having such increased resolution propogate throughout the entire computational domain. It presents special challenges for scientific visualization due to its multiresolution nature. Our research projects focus on effective ways to perform visualization of AMR data. More information. |
| SpectraVis | The current approach for comparing supernovae spectra and light curves is to create an x/y plot that superimposes the two curves, and a "chi by eye" technique is applied to determine whether or not two such datasets are similar. As the number of spectra increase from both observations and simulations, this imprecise approach will not be tractable in the future. A potential solution could be feature detection and classification via machine learning and clustering algorithms applied to the spectral datasets. The end goal is feature detection and similarity detection across supernova spectra. The optimal presentation of these clusters is still an open problem. Another research topic is spectra parameter fitting. About 50 parameters, including minimum and maximum velocity of ionic species, strength or number of ions, and ion temperature, can be said to characterize a supernova spectrum. Software exists which can repeatedly fit experimental data to a model defined by these 50 parameters, and produce the best fit model for each spectrum. More information. |
| Sunfall | The Visualization Group participated in the development of Sunfall, a collaborative visual analytics system for the Nearby Supernova Factory (http://snfactory.lbl.gov), an international astrophysics experiment and the largest data volume supernova search currently in operation. Sunfall utilizes novel interactive visualization and analysis techniques to facilitate deeper scientific insight into complex, noisy, high-dimensional, high-volume, time-critical data. The system combines novel image processing algorithms, statistical analysis, and machine learning with highly interactive visual interfaces to enable collaborative, user-driven scientific exploration of supernova image and spectral data. Sunfall is currently in operation at the Nearby Supernova Factory; it is the first visual analytics system in production use at a major astrophysics project. More information. |
| Fast Contour Descriptors for Supernovae | Visualization Group member Cecilia Aragon collaborated on the development of a fast contour descriptor algorithm which was applied to a high-volume supernova detection system for the Nearby Supernova Factory. The shape-detection algorithm reduced the number of false positives generated by the supernova search pipeline by 41% while producing no measurable impact on running time. Because the number of Fourier terms to be calculated is fixed and small, the algorithm runs in linear time, rather than the O(n log n) time of an FFT. More information. |
| Machine Learning for Supernova Detection | Visualization Group members Raquel Romano and Cecilia Aragon used supervised learning techniques (Support Vector Machines (SVMs), boosted decision trees, random forests) to automatically classify all incoming supernova images for the Nearby Supernova Factory on a nightly basis and rank-order them by the classifier decision value, allowing astrophysicists to quickly examine the 20 or so most promising candidates arriving each morning. More information. |
| ProteinShop | Funded by Laboratory Directed Research and Development funding, Silvia Crivelli has undertaken an ambitious project to accelerate the challenging problem of predicting and optimizing the shape of protein molecules, also known as "protein folding." Her work has resulted in an interactive 3D visualization application that has increased the size and complexity of protein molecules that can be processed, as shown by the results of her team's performance in the bi-annual CASP competition. More information. |
| DiVA | The Distributed Visualization Architecture (DiVA) aims to identify and implement a component-based framework for scientific visualization and data analysis. The overall objective of this effort is to promote interoperability within the software tools created by the visualization data analysis research communities, with particular emphasis upon software that runs in remote and distributed, as well as parallel environmnents. More information. |
| Dex | The Dex project, which is part of the DiVA research effort, aims to combine scientific data management and visualization technology with the objective of improving visual data analysis performance on large and complex scientific datasets. The basic idea is that rather than perform analysis on "the entire dataset" - which is impractical or impossible with large datasets - only a user-specified subset is selected for analysis. The selection criteria consists of a set of boolean queries. More information. |
|
|
(1998-2003) Visapult is a pipelined-parallel volume rendering application capable of rendering extremely large volume data on a wide range of common platforms. If you have time to burn and are interested in the historical origins of Visapult, you can read an extensive set of web pages that document early development efforts when Visapult was just undergoing early design and implementation as the Next Generation Internet's reference application. Download Visapult source tarball. |
| Multiple Gene Sequence Alignment Visualization | More information. |
| Combustion Visualization (AMR) LDRD | The goal of this project is to evaulate and demonstrate some techniques for visualization specifically for combustion data with embedded boundary conditions. More information. Additional work was performed on this project "on the sly" during FY2000. |
| The Virtual Protractor | The Virtual Protractor, Summer-Fall 1999 A virtual protractor is used to measure angles between objects perceived in stereo image pairs using virtual reality technology. Each image is generated from a scanning electron microscope, and stereo pairs are obtained by either manipulating the specimen or the electron beam. Images from slightly different viewpoints are combined using stereoscopic rendering to create the illusion of a 3D scene. Virtual reality user interface technology is used to manipulate a virtual measuring device with the goal of accurately measuring spatial characteristics of 3D objects perceived while viewing the stereo image pairs. This approach relies on the human observers' ability to successfully fuse stereo geometry and image-based data. A paper was presented at IEEE Vis99 that describes our work. Download semViewer source tarball. |
| DataBlaster Toolkit | DataBlaster Toolkit , 1998. The intent of this toolset is to provide the means to easily move data from simulations to visualization tools. Unlike some other code instrumentation tools (such as CUMULVS), there are absolutely no dependancies or restrictions with respect to MP computing environments. The underlying presumption in this toolkit is that the overall goal is to send data, which can be up to a five-dimensional array of double precision floating point values, from a computational source to a consumer. The underlying data must be reducable to a contiguous chunk of memory. This tool makes use of the "eXternal Data Representation" (XDR) libraries for transmission and translation from one architecture to another. Therefore, you can send compute data on an 8-byte-word big-endian machine and consume the data on a 4-byte-word little endian workstation. XDR takes care of all the architecture representation issues (thus, XDR must be present on both client and server machines). |
| Parametric Visualization and Computation of Large Geochemical Datasets | (1998) This project seeks to make advances in geochemical modeling tools by using computational facilities at Berkeley Lab; seeks to make advances in techniques for visualization of large datasets such as those produced by geochemical simulation models on Berkeley Lab/NERSC equipment; and seeks to make advances in techniques for visualization of divergent data from different sources, some of which is computed and some of which is observed. More information. |
| Advanced Computational Technology Initiative (ACTI) | The Advanced Computational Technology Initiative (1995-1997). A collaboration with the oil industry produced new commercially available products using visualization tools developed by the Visualization Group at Berkeley Lab. |
| AVS5 VRModules | How can one bring Virtual Reality to the desktop? Our VRModules Library is a collection of AVS Modules that implement VR. This link describes the contents of the VRModules library. (Circa 1996). More information. |
| UTCHEM - Coupling VR, Visualization and Simulations |
UTCHEM Project
A prototype interface - our foray into the world of VR and
scientific computing. Fall, 1993. 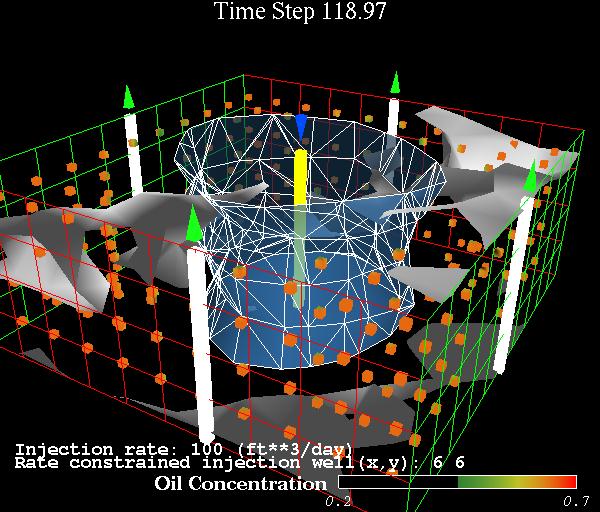
|