This is an archival copy of the Visualization Group's web page 1998 to 2017. For current information, please vist our group's new web page.
Variable Interactions in Query-Driven Visualization
Summary
One fundamental element of scientific inquiry is the discovery of relationships. Building upon our prior work in the field of Query-Driven Visualization, where visual data analysis processing is focused on subsets of large data deemed to be "scientifically interesting," this new work focuses on a novel knowledge discovery capability suitable for use with petascale class datasets. It enables visual presentation of the presence or absence of relationships (correlations) between variables in data subsets produced by Query-Driven methodologies. This technique is particularly useful for gaining knowledge from datasets currently emerging from SciDAC and INCITE projects. It is sufficiently generally to be applicable to any time of complex, time-varying, multivariate data from structured, unstructured or adaptive grids.
|
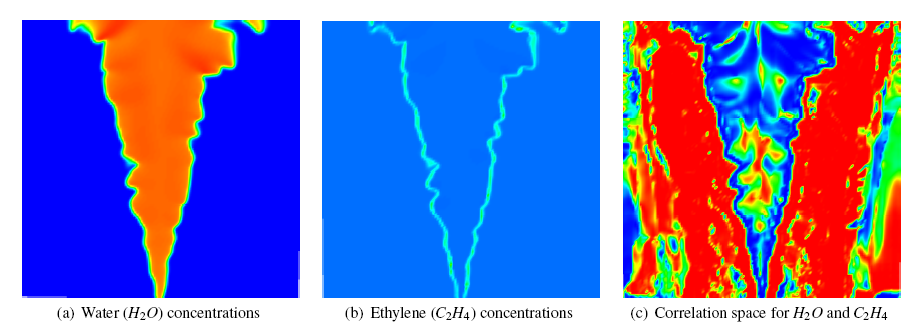
| Figure 1. Water (H2O) and ethylene (C2H4) concentrations from the methane combustion dataset are shown in (a) and (b), respectively. The derived correlation field for these two compounds is shown in (c). The switch from strong positive correlation to strong negative correlation in the reaction region corresponds to the area in which C2H4 is both produced and consumed, and H2O is produced, in the process of combustion. The strong correlation (both positive and negative) in the center of the flame, as well as the atmospheric region, demonstrates the correlation field's ability to show fine-scale interactions. |
Approach
Obstacles hindering scientific knowledge discovery from large and complex data may be broadly categorized into two separate but overlapping groups. The first category, concerned mainly with issues of throughput, includes the challenges inherent to efficiently managing and visualizing large-scale datasets. The second category includes the difficulties associated with attaining insight from datasets of high-complexity.
Query-driven visualization (QDV) is well suited for performing analysis and visualization on datasets that are both large and highly complex. Tools like FastBit leverage highly efficient (in terms of speed and compression) data management techniques to rapidly identify and visualize "regions of interest" within a dataset. Specified as Boolean range queries, these regions of interest tend to be significantly smaller subsets of the original dataset; thus, these regions require less time and effort to analyze, visualize, and interpret.
Well-characterized range queries are capable of identifying spatial regions where many domain-specific events occur: combustion flame fronts, vortices, chemical reaction fronts, etc. Beyond indicating these regions, however, queries reveal little about variable interactions or complex trends that lie in the domain of these characterizations. In such regions of interest, it is the behavioral trends between variables, or groups of variables, that are more important in providing insight than the traits or locations of individual variables alone. The challenge is to extend the strengths of QDV with methods that identify behavioral trends and provide insight into regions of interest through coherent and meaningful visualizations.
The novel contributions of this work are techniques that extend the capabilities of QDV by providing the basis for determining: how sets of variables in complex datasets interact throughout regions of interest, and the role other variables play in influencing these interactions.
We utilize the cumulative distribution functions (CDFs) of all variables in a query to reveal initial information about statistical regions of interest within the query's solution space. The CDF for each variable is computed by integrating over the query's solution space, then accumulating the variable's values as a histogram. Statistically, the solution set of a query is represented as an aggregate of histograms, one histogram for each variable expressed in the query.
|
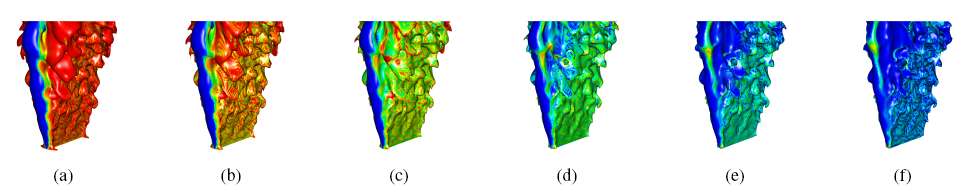
| Figure 2. These images depict increase ((a) through (f)) isosurface values of temperature (isotherms) colored by values of the correlation field derived from water and ethylene. As temperature values increase, the predominant correlation between water and ethylene along the isotherms shifts away from strongly positive (red in (a)) to strongly negative (blue in (f)). This shift suggests that temperature is itself negatively correlated with the water-ethylene correlation. (Sample methane flame simulation data courtesy J. Bell and M. Day, Center for Computational Sciencs and Engineering, LBNL) |
We extend this analysis further by incorporating correlation fields, which provide insight into localized correlation between any two variables. By mapping a correlation field onto a third variable's isosurfaces (specifically, the statistically important isovalues suggested by the variable's CDF), statistically important interactions between any three variables in a dataset are readily visualized, allowing for trends between variables in a user's query to be identified.
In this method, CDFs and correlation fields are constrained to the query's solution space. By working exclusively in the query's solution space, this method takes full advantage of the performance benefits inherent to QDV strategies. Specifically, computational efforts are only focused on regions that have been rapidly identified (via a query engine) as "interesting" by the user's query. This method's integrated analysis extends current query solutions by revealing statistical trends of interactivity (i.e., dependency and independence) between any triad of variables in the solution space of the query.
Publications and Further Reading
- L. Gosink, J. Anderson, E. W. Bethel, K. Joy. "Variable Interactions in Query-Driven Visualization." IEEE Transactions on Visualization and Computer Graphics 13(6), Proceedings of IEEE Visualization 2007, pp1400-1407, November/December 2007. LBNL-63254. (PDF)
- Web page at the Institute of Data Analysis and Visualization at UC Davis.