This is an archival copy of the Visualization Group's web page 1998 to 2017. For current information, please vist our group's new web page.
Visualization Group Gallery
Collaborations with AstrophysicsCollaborations with Physics
Collaborations with Earth Sciences
Collaborations with Life Sciences
Collaborations with Material Sciences
Astrophysics
|
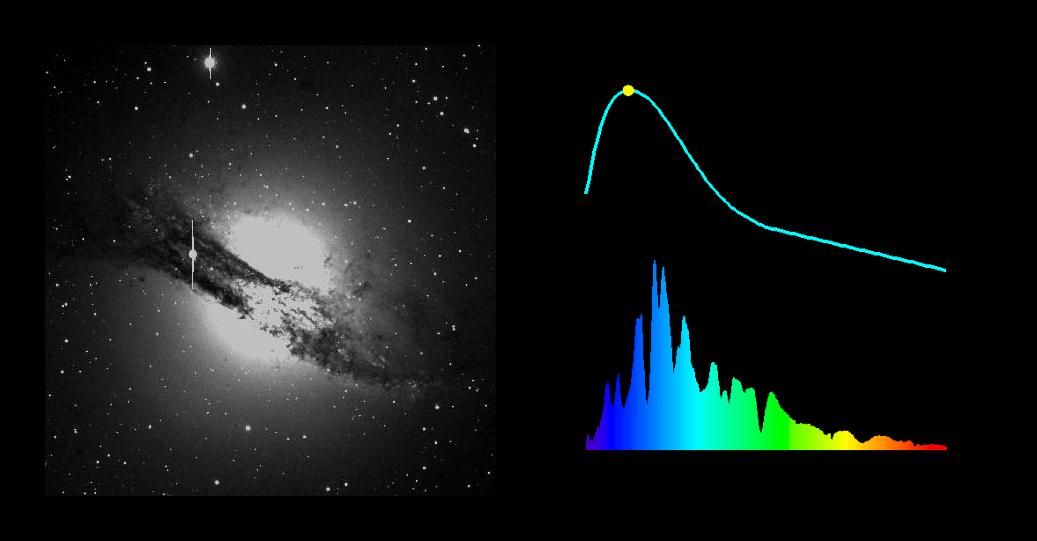
| This image, and the movie below, was created by Nancy Johnston, LBNL Visualization Group Leader (1990-2001) for Saul Perlmutter of the LBNL Physics Division. The left image shows a prototypical Type Ia supernova. The image on the right shows the spectra emitted by the SN on the bottom half, while the top half shows the the temporal location during the lifetime of the SN. The SN emits more light, and at a different spectral balance, earlier in its lifetime. |
Collaborations with Physics
Plasma Research at MIT
 |
 |
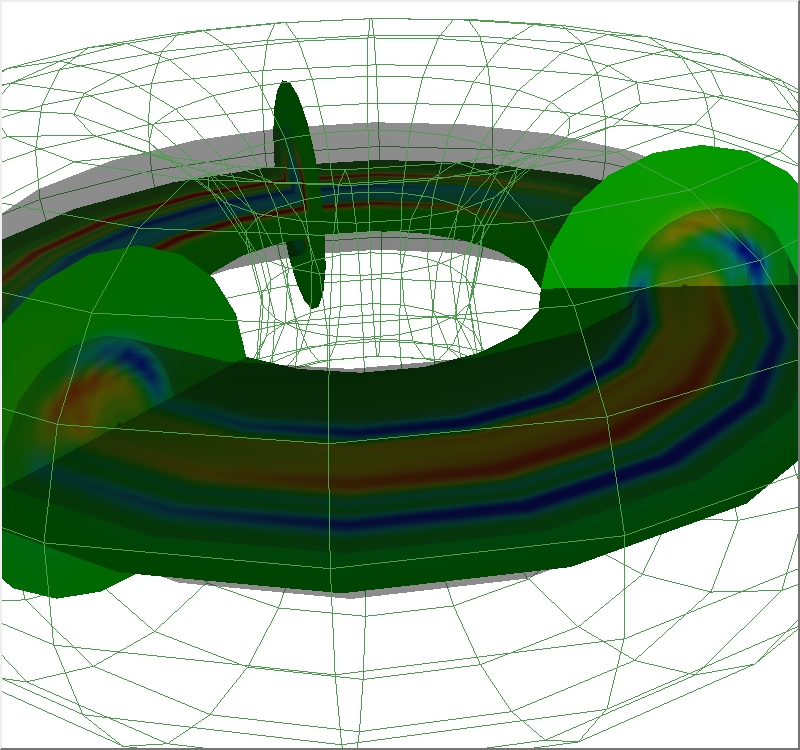
It is estimated that plasmas make up 99% of all matter in our universe. They can be found everywhere from the Sun and other stars to the neon sign at your local bar. One of the most important goals of plasma research is to create a thermonuclear fusion reactor that will produce electricity and serve as a source of plentiful energy. One device used to contain plasmas while they are heated to the extremely high temperatures needed for fusion to occur is called a Tokamak. Scientists are studying how instabilities develop in this toroidal magnetic bottle (pictured above) that limit how long the plasma can be contained.
The first image shows current density on the midplane of the tokamak and in three cross-sectional slices. The second image shows an isosurface of the same dataset. This visualization helped researchers demonstrate inaccuracies in standard computer models of tokamaks.
Acknowledgement
- Science: Linda Sugiyama, at the MIT Plasma Physics Group.
Lattice Gauge Theory
|
||
 |
|

|
One of these images appears on the cover of a NERSC periodical Buffer, Fall 1996.
Acknowledgement
- Science: Greg Kilcup, The Ohio State University
Nuclear Science at LBNL
 |
 |
The STAR project involves building a large particle detector which will aid in the search for the quark-gluon plasma. The detector records the locations of ionization events (blue or red squares in the images) as the particles given off by the collision pass through the gas filling the chamber. The events are then reconstructed into tracks (red lines) by pattern recognition software.
Software was written by the STAR group to visualize the tracks and detector. The visualization group rewrote the code to use OpenGL instead of GL (to increase portability) and added support for 6 DOF input devices such as a "3D mouse".
Acknowledgement
- Science: Doug Olsen, Nuclear Science Division, LBNL.
Collaborations with Earth Sciences
Copper Mines
 |
 |
 |
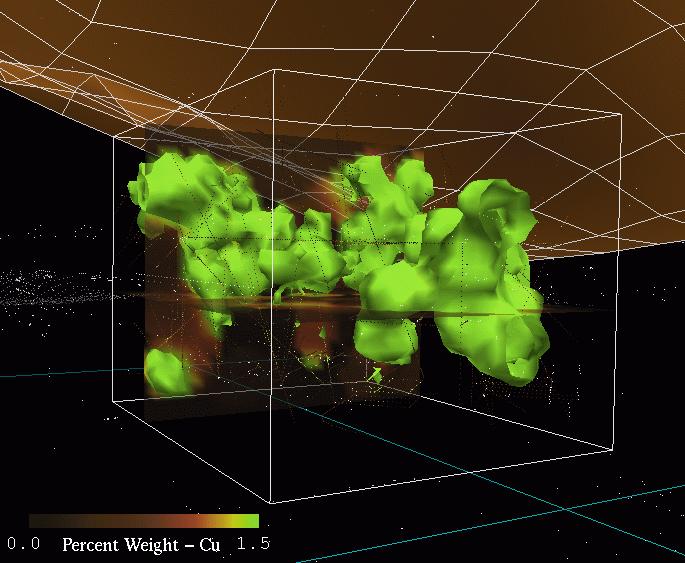
Virtual Reality technology is used to implement a user-interface which permits a scientist to visualize and manipulate a subset of a large, three-dimensional data set with complex spatial structure. As part of a 1997 LDRD, Researchers at LBNL and the University of California, Berkeley, are developing a code to model chemical and hydrological processes which will run on an MP machine at NERSC The half-million data points are assay measurements from 11,000 bores, and provided by a mining compnay in Chile.
Acknowledgement
- Science: Karsten Pruess and George Brimhall, LBNL.
Chemical Flooding
 |
 |
Acknowledgement
- Science: Janet Jacobsen, Earth Sciences Division, LBNL.
BP Exploration and Western Atlas Software
 |
A collaborative effort involving LBNL, Western Atlas Software, and BP Exploration focuses on developing new techniques for visualizing oil flux. One method of "direct" visualization of underground oil transport uses icons, such as cones, at grid points. An indirect method derives information about the oil flow, and is represented with streamlines. These techniques and numerous others were rapily prototyped at the Berkeley Lab Visualization Laboratory under the ACTI Iniative. Visit our ACTI home page.
Resevoir Characterization
 |
Collaborations with Life Sciences
Chemical Structure Determination

|
Acknowledgement
- Science: Ken Downing, Life Sciences Division, LBNL.
Radiation Biology and DNA Repair
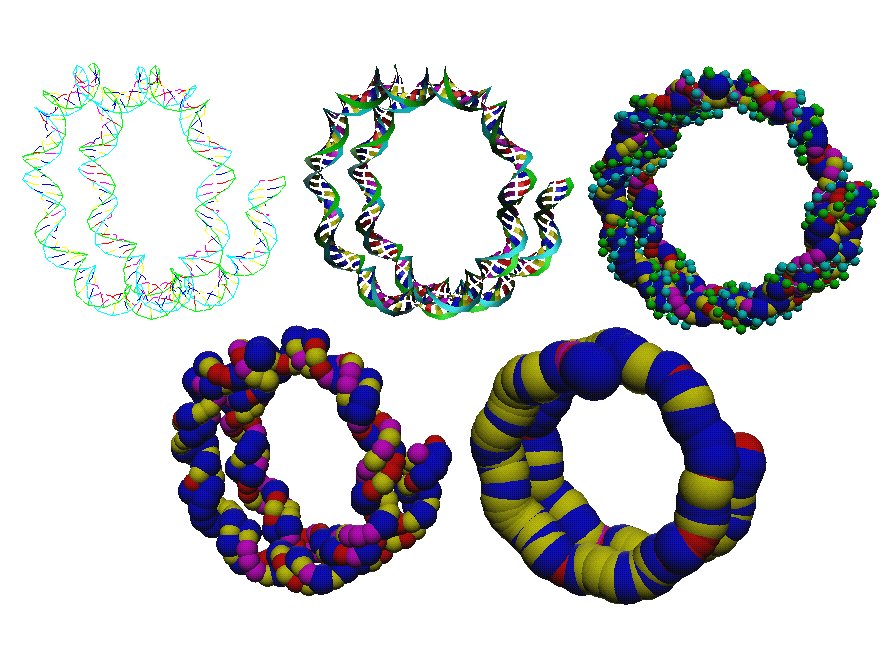 |
Acknowledgement
- Science:
- Saira Mian, Life Sciences Division, LBNL.
- Bill Holley, Life Sciences Division, LBNL.
Collaborations with Material Science
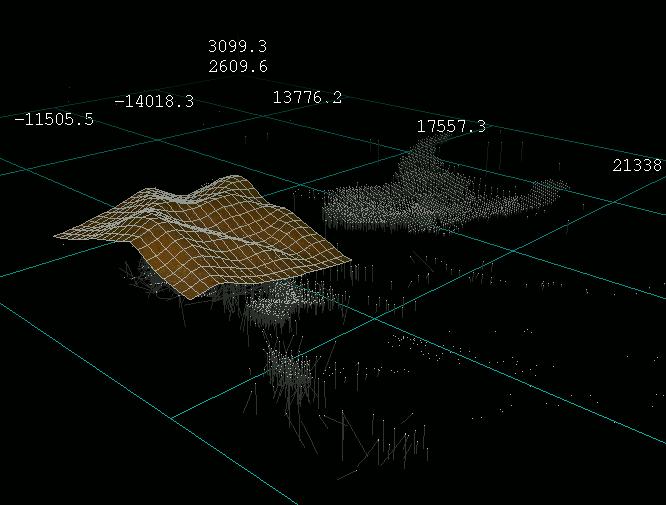
NMR Simulation
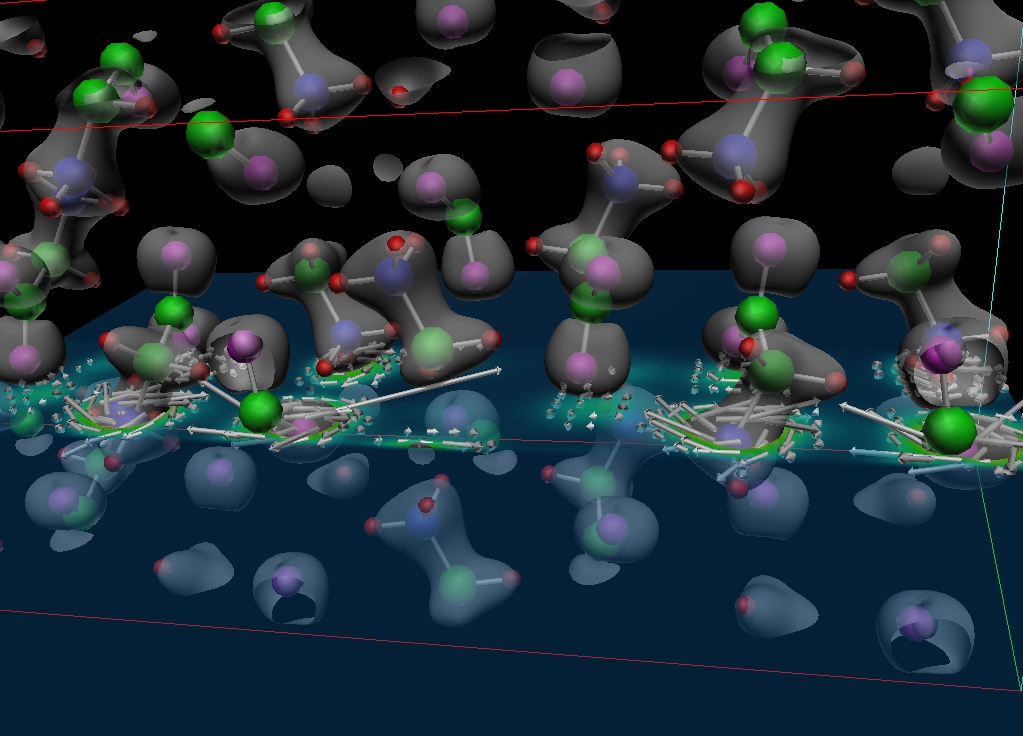
|
Material Scientists use Nuclear Magnetic Resonance (NMR) technology for many purposes, including chemical structure determination. To better understand the results of NMR experiments, UCB/LBNL researchers are using the Cray T3E supercomputer to simulate the response of crystalline structures to an applied magnetic field. This image shows the induced current (white arrows) and charge density (colored plane and grey surface) in crystalized glycine. For more information on this work, see the Project page.
Acknowledgement
- Science: Bernd Pfrommer, LBNL.
PHSCologram Images
|
|
 |
 |