This is an archival copy of the Visualization Group's web page 1998 to 2017. For current information, please vist our group's new web page.
Magazine and Journal Cover Art
| 2014 | 2012 | 2010
2009 | 2008 | 2007 | 2006 | 2005 | 2004 | 2003 1999 | 1998 | 1997 |
2014
| Visible-Wavelength Polarized Light Emission with Small-Diameter InN Nanowires | |
|---|---|

|
Using NERSC's Cray XC30 supercomputer "Edison", University of Michigan researchers found that the semiconductor indium nitride (InN), which typically emits infrared light, will emit green light if reduced to 1 nanometer-wide wires. Moreover, just by varying their sizes, these nanostructures could be tailored to emit different colors of light, which could lead to more natural-looking white lighting while avoiding some of the efficiency loss today's LEDs experience at high power. Visualization and analysis of the simulation data were done using custom tools based on VTK, ParaView, and finally rendering the result with POVRay. The visualizations appeared on the cover of ACS Nano Letter, on NERSC web site, and were made into a stereoscopic 3D presentation for SC14. (More information) |
2012
| Cold
Spring Harbor Protocols – Volume 2012 (2) |
|
|---|---|

|
Blastoderm expression patterns of gt, rho, fkh,
ftz, kr, and kni from the Berkeley Drosophila
Transcription Network Project's publicly available, digital
blastoderm atlas. Using the visualization tool PointCloudXplore, the
patterns can be visualized in 3D on a virtual embryo, which can be
rotated to any angle, or the embryo surface can be unrolled to reveal
the entire pattern in a 2D view as shown here. This view can also be
rotated and height maps of the relative expression for each gene added.
Visualization generated by David Knowles (LBNL) using PointCloudXplore. PointCloudXplore has been developed by O. Rübel and G. H. Weber (LBNL Vis Group/NERSC Analytics). More information. |
2010
| SciDAC Review – Special Issue 2010 | |
|---|---|

|
Simulations that ran on the Franklin Cray XT at NERSC captured the detailed structure of a lean hydrogen flame on a laboratory-scale low-swirl burner. Image courtesy of M. Day, LBNL. Visualization generated using VisIt by M. Day and A. Nonaka (LBNL CCSE) with help by G. H. Weber (LBNL Vis Group/NERSC Analytics). More information. |
2009
| SciDAC Review – Summer 2009 | |
|---|---|

|
Massively parallel VORPAL simulations of LOASIS (LBNL) experiments show the structure of a plasma density wave, or wake (blue), driven by an intense laser pulse traveling upward through the image. Simulation by C.G.R. Geddes (LBNL). VisIt visualization by G.H. Weber and C.G.R. Geddes (LBNL). More information. |
2008
| Journal of Physical Chemistry – March, 2008 | |
|---|---|
 |
Spin density of the spheroidene molecule obtained by the diffusion Monte Carlo method. Figure created by Cristina Siegerist, Alan Aspuru-Guzik, Romelia Salomon-Ferrer, Brian Austin, and W. A. Lester, Jr., for the Department of Energy's Innovative and Novel Computational Impact on Theory and Experiment (INCITE) program. (More information). |
2007
| SciDAC Review – Spring 2007 | |
|---|---|
 |
In collaboration with the SciDAC Visualization and Analytics Center for Enabling Technology, C. Siegerist of the LBNL Visualization Group and NERSC Analytics team generated this image. It shows one time step of the evolution of total advective radial flux of axial momentum. These simulation results – carried out under DOE's INCITE program at NERSC – are relevant to star and black hole formation. (More information) |
2006
| Cryo-EM: Journal Cover | |
|---|---|

|
This image created by Cristina Siegerist and Luis Comolli appeared as the cover of the Journal of Microscopy, July 2006 - Vol. 223 Issue 1, for the article "Characterization of intact subcellular bodies in whole bacteria by cryo-electron tomography and spectroscopic imaging, L. R. Comolli, M. Kundmann, K. H. Downing." |
| Physical Chemistry: Journal Cover | |
|---|---|
 |
This image created by Cristina Siegerist and Rohini Lochan appeared as the cover of Physical Chemistry Chemical Physics, 2006, vol 8, #12, 1357 - 1370 for the article "Computational studies of molecular hydrogen binding affinities: The role of dispersion forces, electrostatics, and orbital interactions" , Rohini C. Lochan and Martin Head-Gordon. Rohini Lochan, Martin Head-Gordon, UC Berkeley |
2005
| Structural Biology: Journal Cover | |
|---|---|
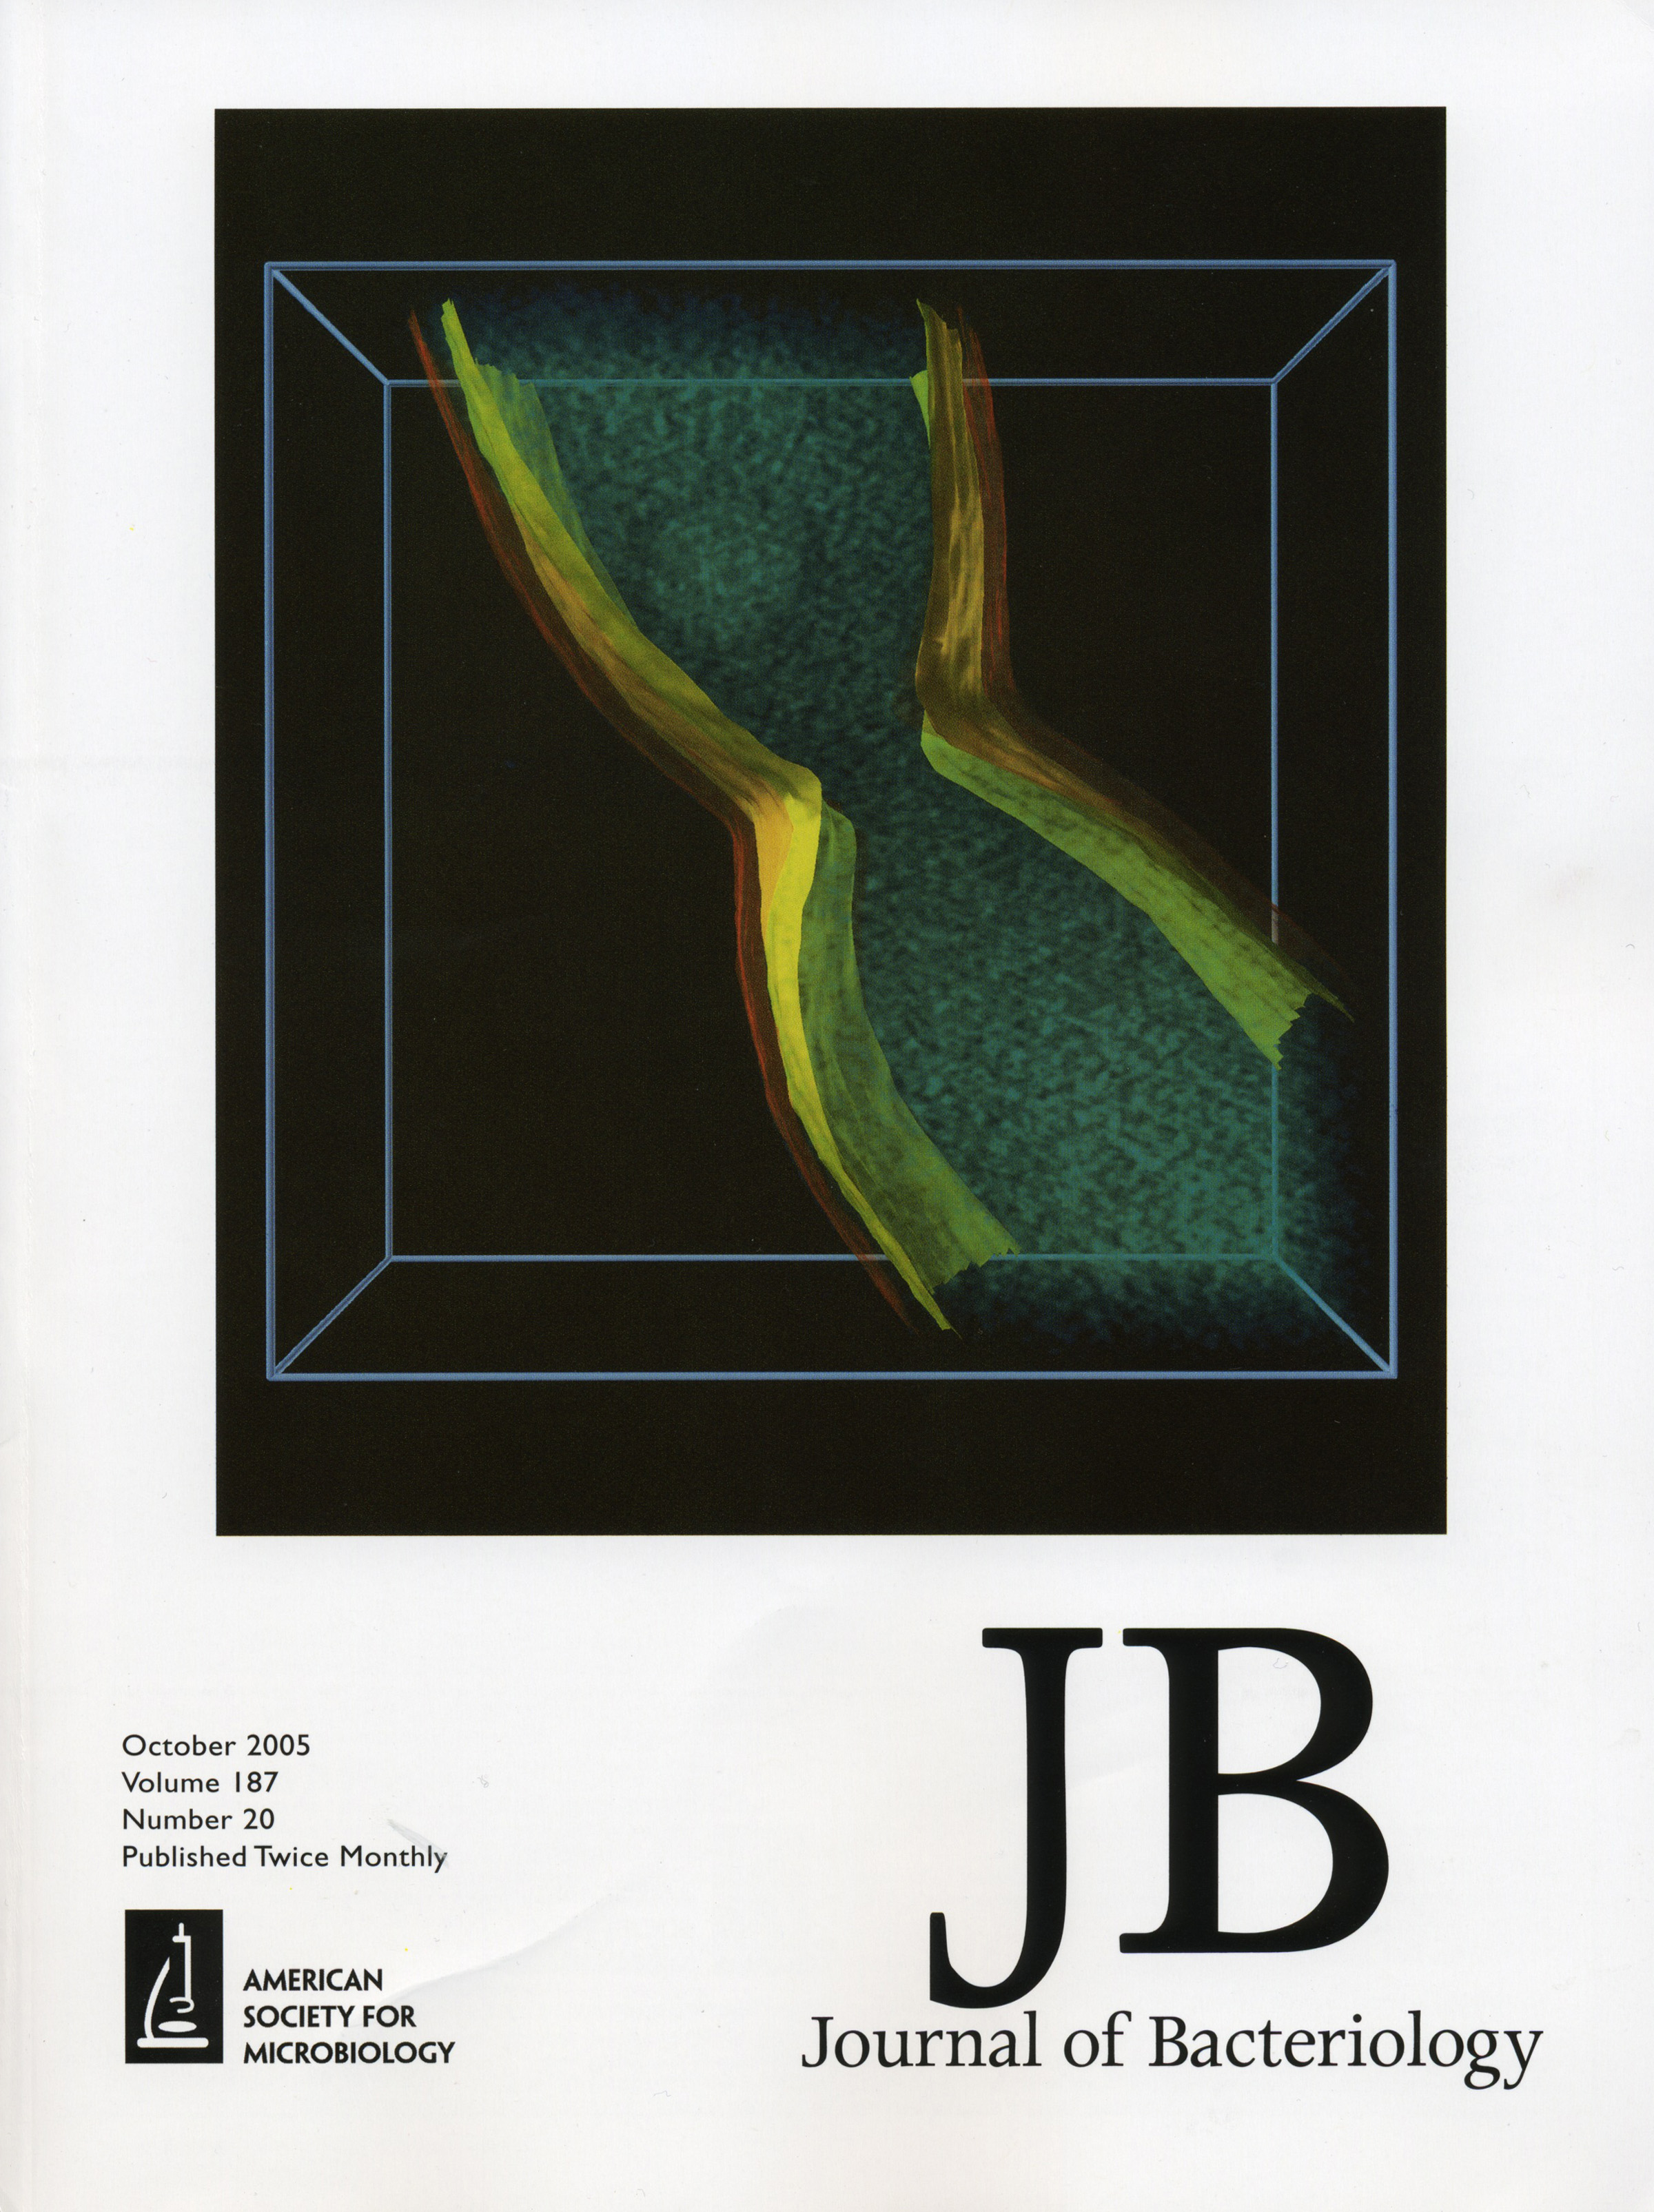 |
This image created by Cristina Siegerist appeared as the
cover of the Journal of Bacteriology, Vol. 187, Number 20, October
2005. More information
L. R. Comolli, K. Downing, LBNL |
| Combustion, Rod-stabilized V-flame: Journal Cover | |
|---|---|
 |
This image created by Cristina Siegerist and Wes Bethel
appeared as the cover of PNAS, July 19, 2005, 102(29). More information John Bell,M. S. Day, I. G. Shepherd, M. Johnson, R. K. Cheng, J. F. Grcar, V. E. Beckner, M. J. Lijewski |
2004
| National Energy Research Scientific Computing Center - 2004 Annual Report | |
|---|---|
 |
An image created by John Shalf adorns the cover of the 2004 NERSC Annual Report. (More information.) |
2003
| 2003 IEEE Symposium on Parallel and Large-Data Visualization and Graphics: Conference Proceedings Cover | |
|---|---|
 |
The upper right image was produced by Bethel's distributed memory parallel sort-first rendering application. |
1999
| Cover of Science 1999 | |
|---|---|
 |
This image, which appeared on the 24 Dec 1999 cover of
Science magazine, shows visualization of a simulation that computes a
solution to the ionization of a hydrogen atom by a collision with an
electron. The computation was performed at NERSC, and the visualization
performed by the LBNL/NERSC Visualization Group. More
information. |
1998
| Forbes ASAP: Magazine Cover | |
|---|---|
 |
This image, which appeared on the cover of Forbes ASAP
magazine in 1998, shows the "data fusion" resulting from visualization
of simulated and theoretical protein models. Using high performance
visualization tools and Virtual Reality interfaces, we explore model
rectification and comparison. More information. Ken Downing, UC Berkeley and LBNL. |
1997
| 1997 Berkeley Lab Research Review | |
|---|---|
 |
While this image didn't adorn the cover of the Fall
1997 edition of the Berkeley Lab Research Review,
it was the cover for a flyer published by the lab and handed out
at trade shows. This image adorns the pages of an
article about the Visualization Group's efforts
in advancing scientific data understanding by combining interactive
scientific visualization and Virtual Reality. |