This is an archival copy of the Visualization Group's web page 1998 to 2017. For current information, please vist our group's new web page.
Structural Biology: Building Models of Cells
Table of Contents
Introduction
|
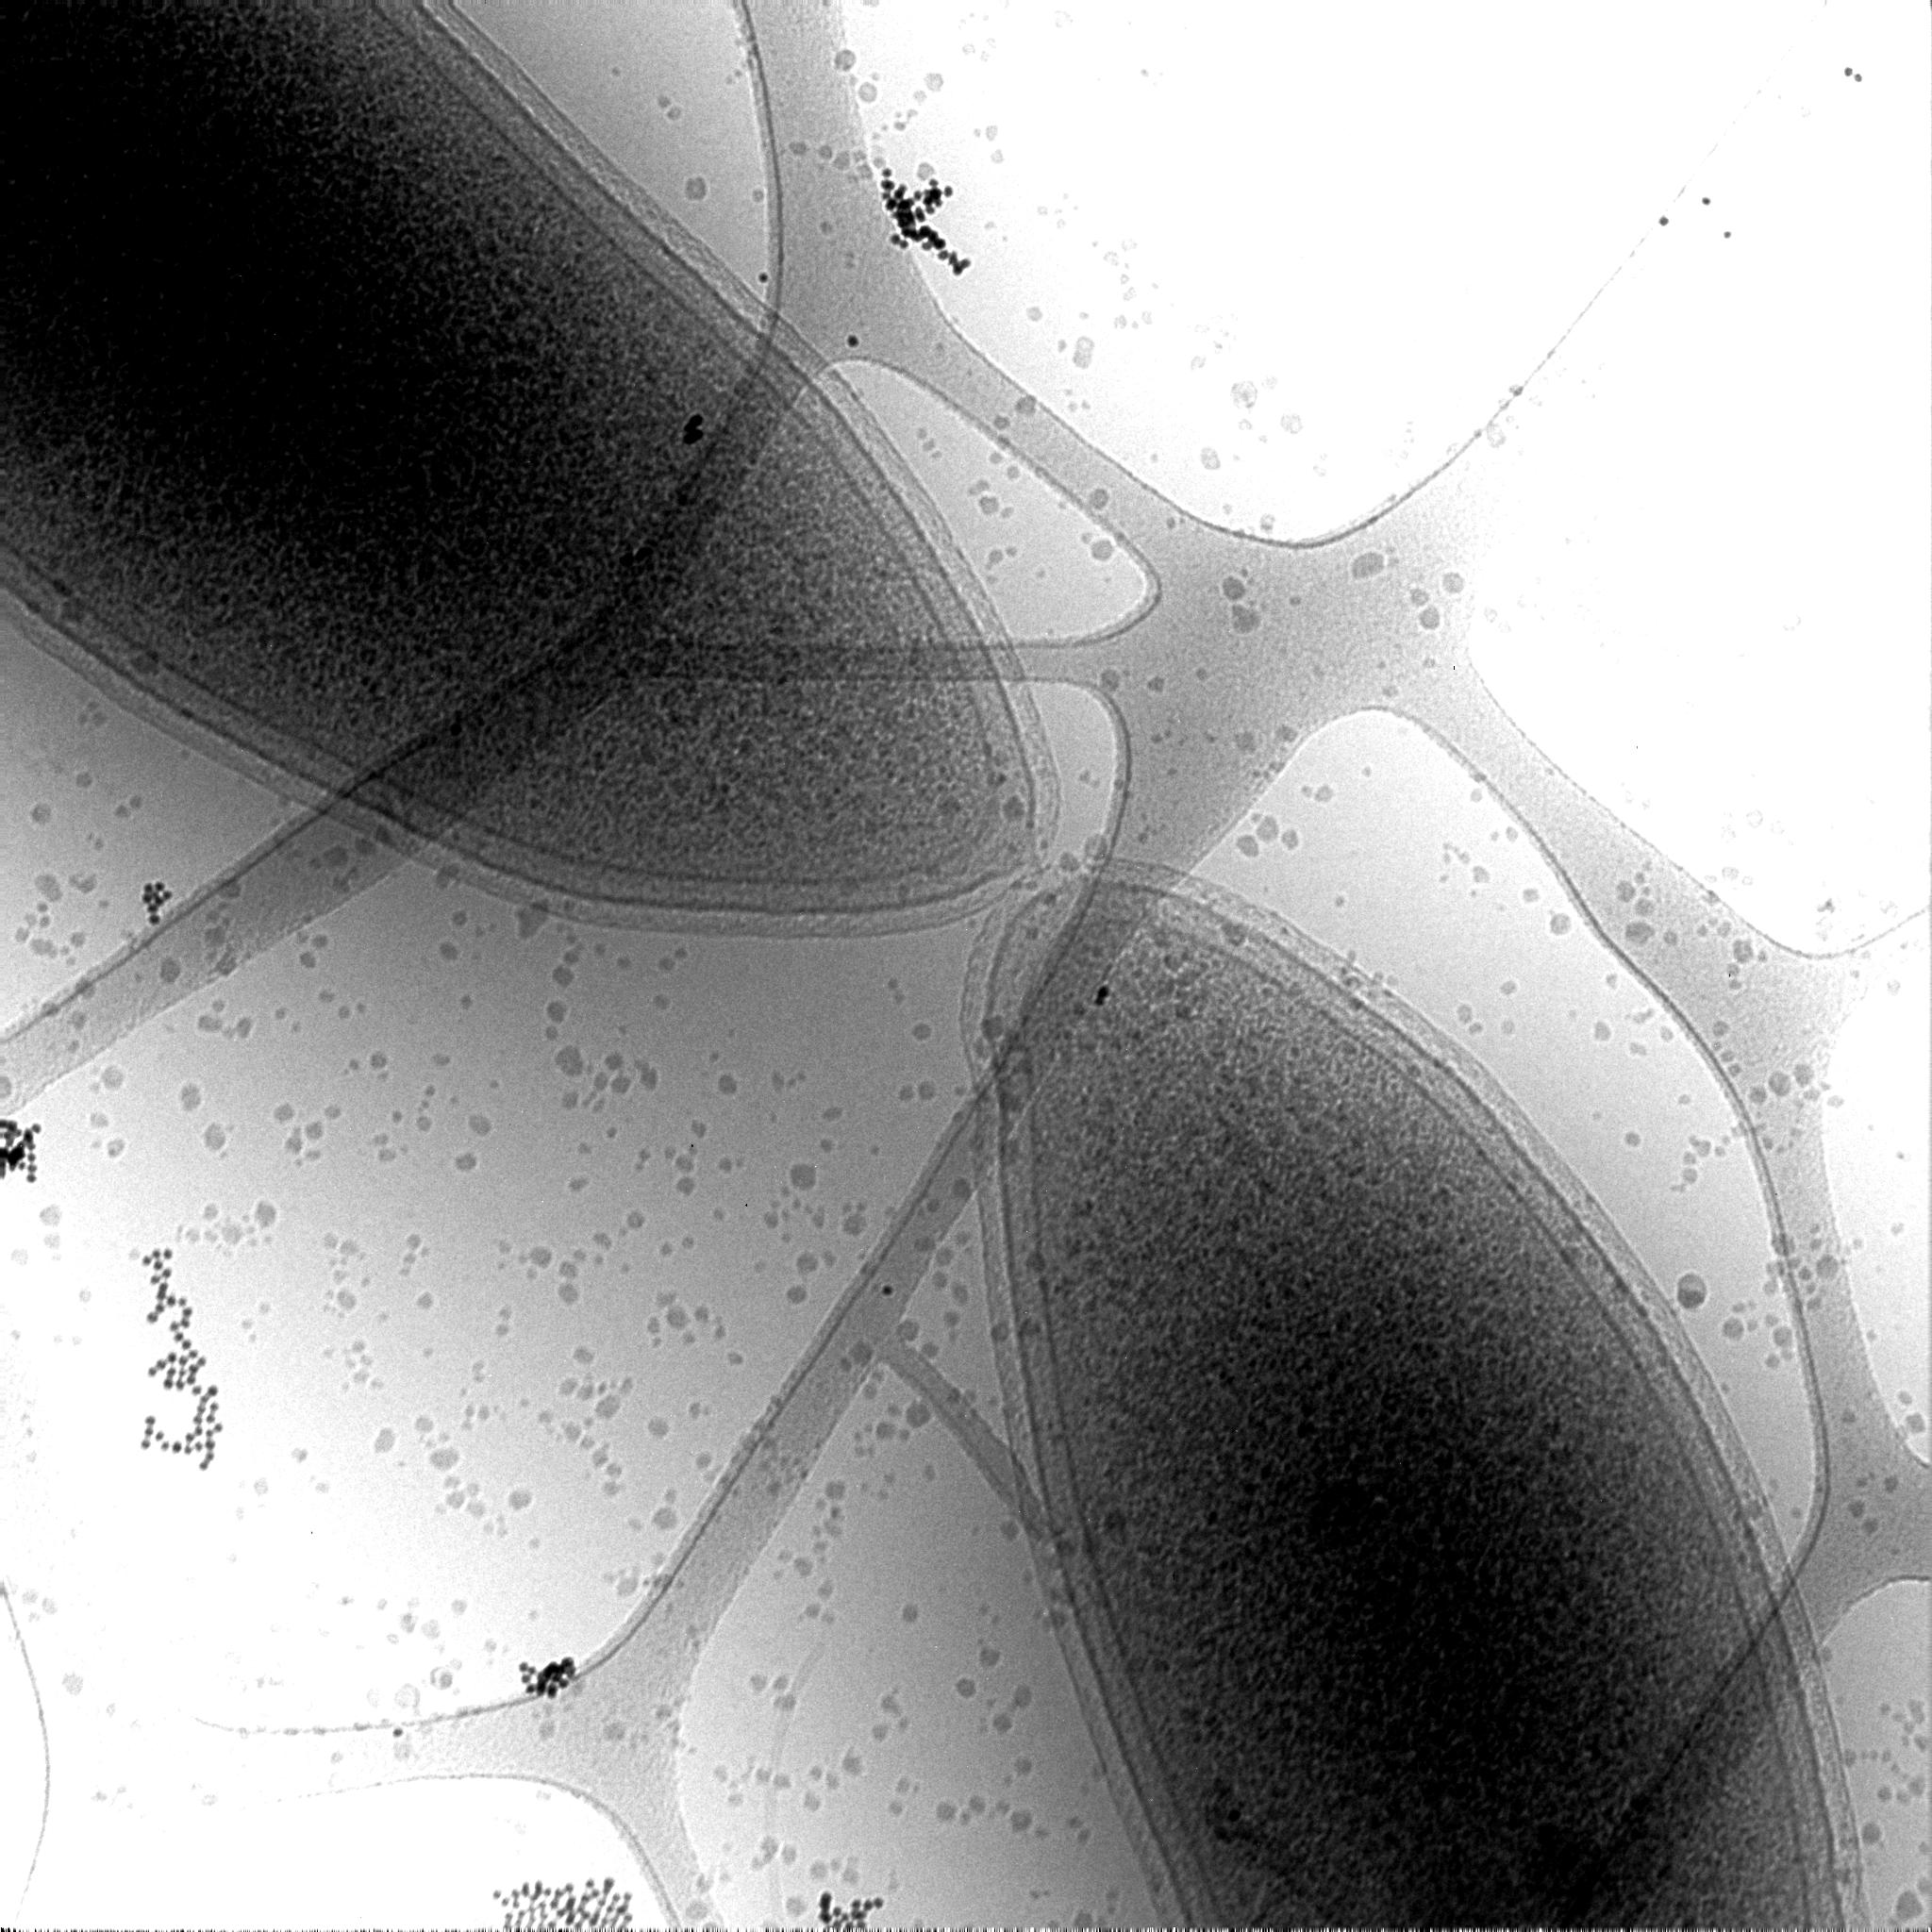
Figure 1. Electron microscope image of a dividing cell of Caulobacter. |
Bacteria contain a wealth of mechanisms that organize their internal and external structure. Electron Tomography offers the possibility to localize the cell components at a resolution that allows a better understanding of their structure and function. The 3D reconstruction of whole cells should lead to the ability to model spatial and temporal relationships among sub-cellular structures, organelles and macromolecular complexes.
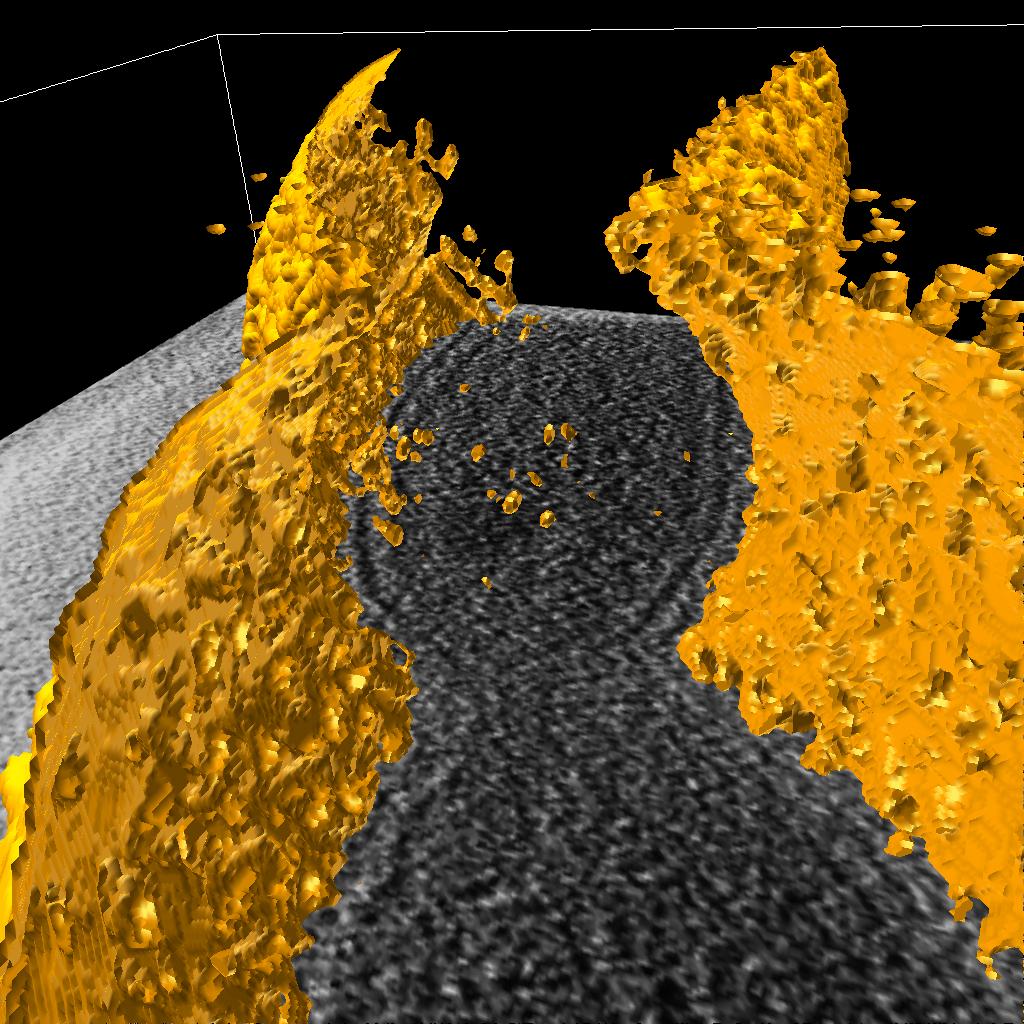
Some of the three-dimensional reconstructions have a low signal to noise ratio resulting in data that produces difficult-to-interpret visualization output. Volume data with 2D features that are not easy to distinguish make a perfect case for construction of a model of structural features. The model - discrete representation of structure partially visible in noisy data - is easier to visually interpret, making it easier for researchers to understand the shape and topology of such features. In contrast, attempting to extract surfaces using isocontouring applied to noisy data produces results that are exteremely difficult if not impossible to interpret. See Figures 1 and 2.
|
Figure 2. Isocontouring applied to a the original data smoothed with median 5x5 filter. |
3D Visualization of Caulobacter Crescentus
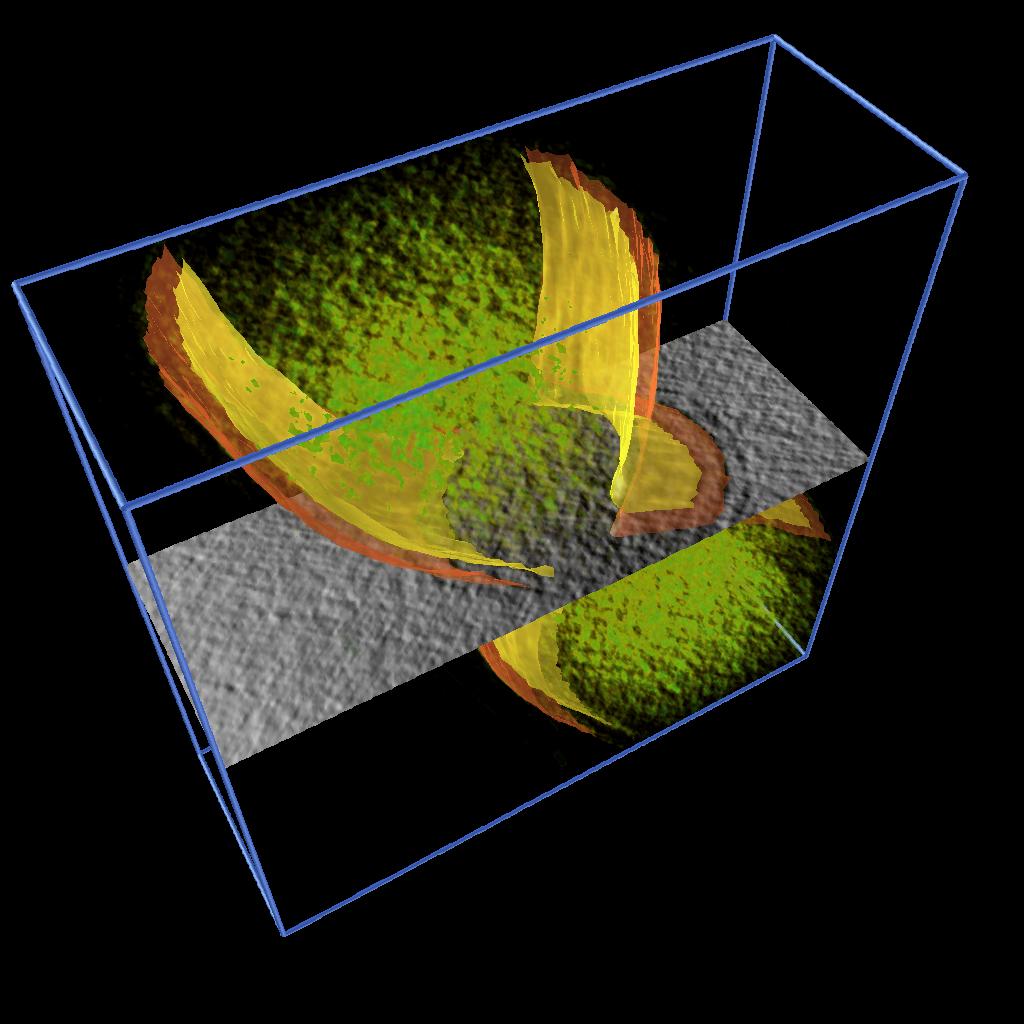
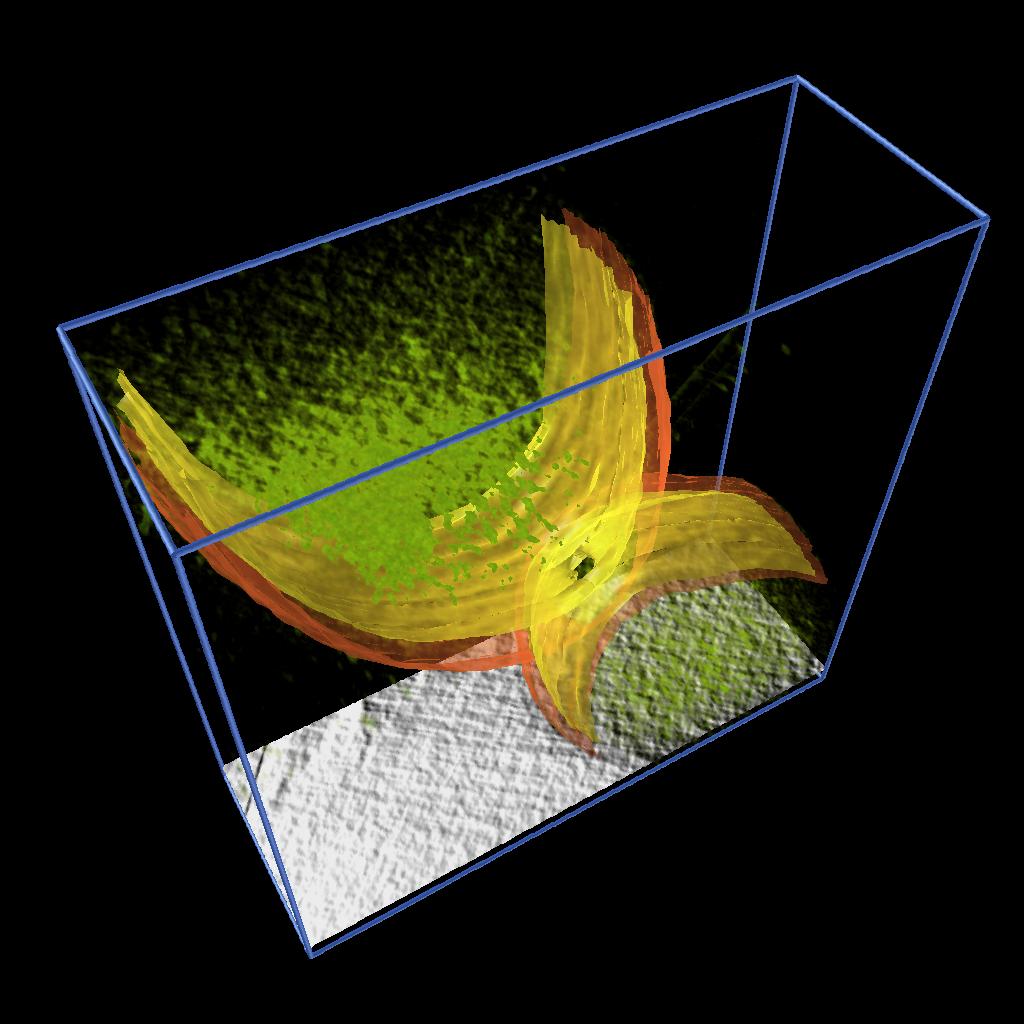
As described in one of our Vignettes, we developed an AVS/Express application to model 2D features by drawing splines and constructing surfaces by building a triangular mesh from the sets of points. We applied this application to model the inner and output membranes of Caulobacter cells. Figure 3 shows the inner and outer membrane of different stages of cell division together with rendering of the volume density and a moving slice along the original data.

|
|

|
|
These models allowed as to illustrate the process of cell division and were used in a publication and in the cover of a journal. See [1] and Figure 4.
|
Figure 4. Cover of the Journal of Bacteriology October 2005 issue. |
Point Clouds to Surfaces
These surfaces proved difficult to build when there were bifurcations and when stitching was needed. To try to make smoother surfaces we explored another approach used in surface reconstruction: build a polygonal mesh from the point cloud using Delaunay-based methods. We used a suite of applications developed by Dr. Tamal Dey et al. Click here for direct references to their work.
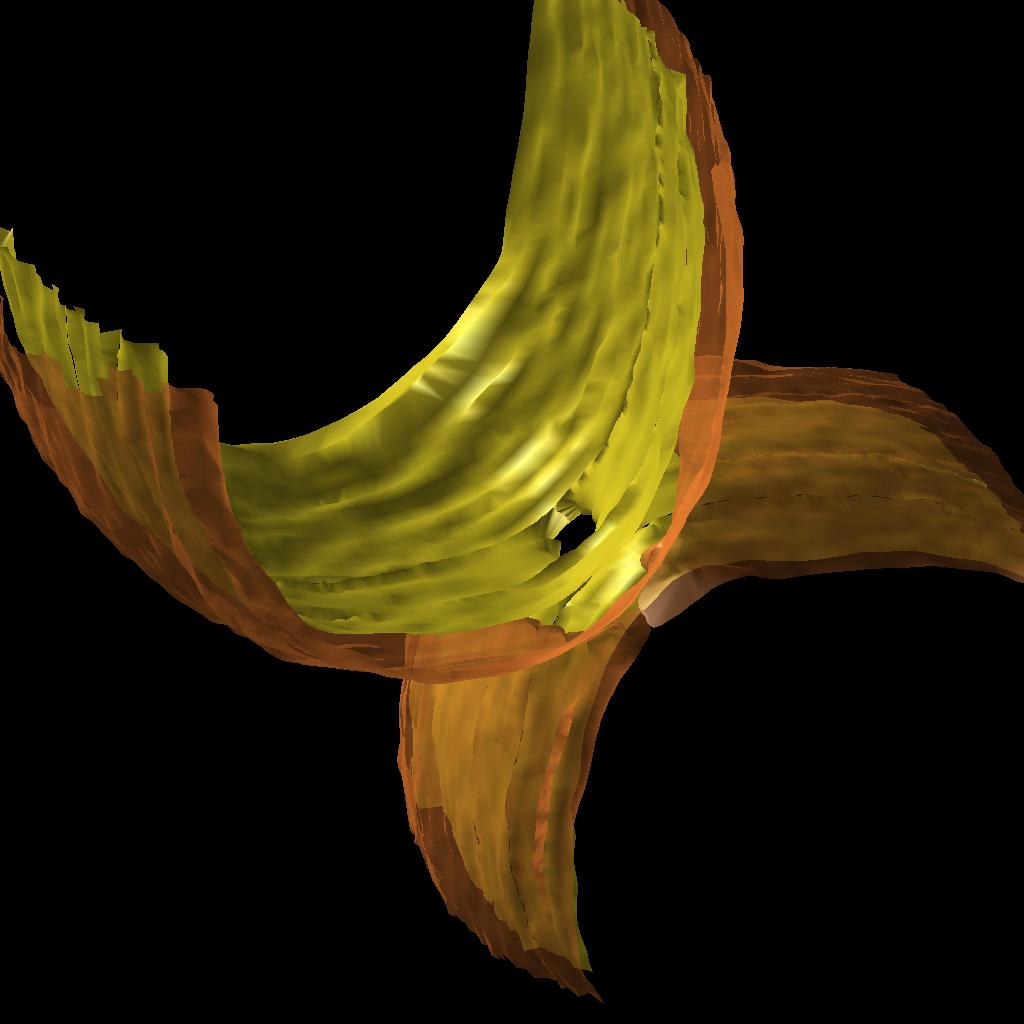
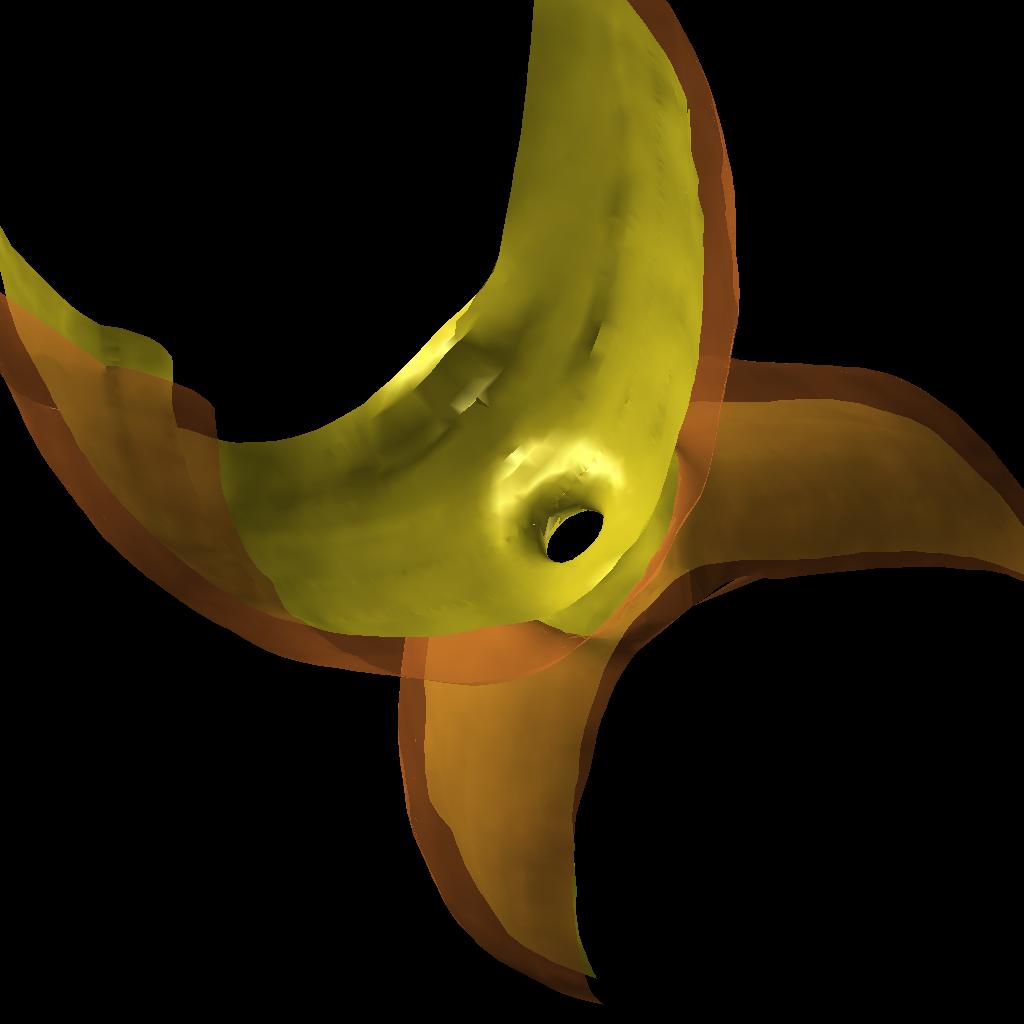
As a first step the normals to the point cloud were estimated using Normfet[2] and using this output the cloud was smoothed using AMLS[3]. The surface was then reconstructed using Cocone[4]. Most methods require dense sampling which is not our case, T.Dey and J. Giesen developed an algorithm that detects surface boundaries using a flatness condition. Figure 5 shows the improved surface.
|
|
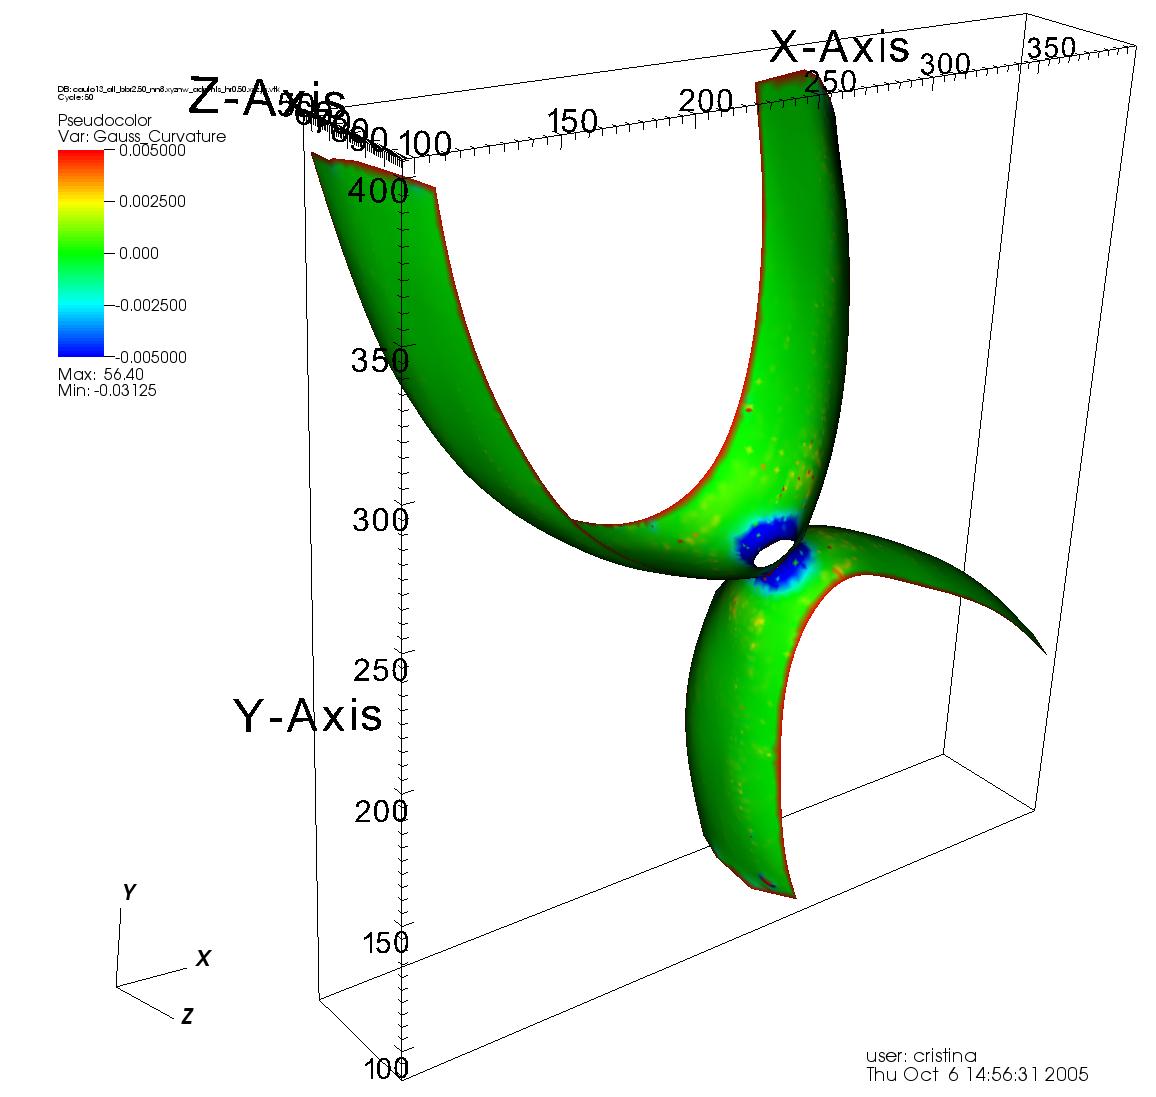
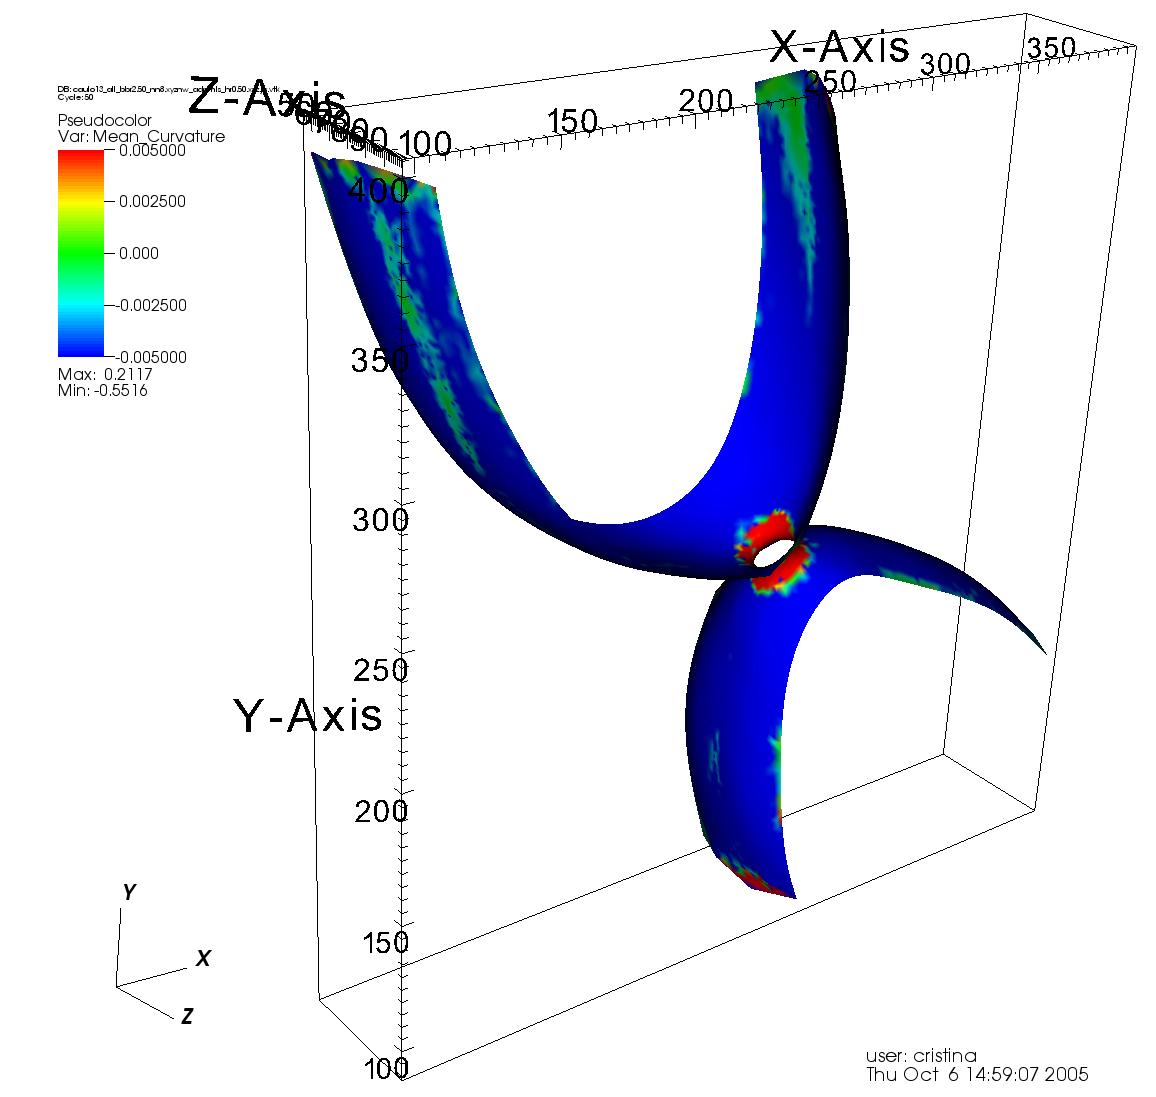
Once the surface was reconstructed we used VTK (cvs version) to smooth it and to calculate the curvatures. The vtk files can be visualized using VisIt [5] or Paraview[6]. Figure 6 shows the curvatures of a membrane visualized with VisIt.
|
|
References
-
[1] Ellen M. Judd, Luis R. Comolli, Joseph C. Chen, Kenneth H. Downing, W. E. Moerner, and Harley H. McAdams
, Distinct Constrictive Processes, Separated in Time and Space, Divide Caulobacter Inner and Outer Membranes
, J. Bacteriol. 2005 187: 6874-6882
[2] T. K. Dey and J. Sun. Normal and Feature Estimations from Noisy Point Clouds. Technical Report
[3] T. K. Dey and J. Sun. Adaptive MLS Surfaces for Reconstruction with Guarantees. Proc. Eurographics Symposium on Geometry Processing (2005), 43-52.
[4]T. K. Dey and J. Giesen. Detecting undersampling in surface reconstruction. Proc. 17th ACM Sympos. Comput. Geom. (2001), 257-263.
[5]VisIt, http://www.llnl.gov/visit
[6]Paraview, http://www.paraview.org
Acknowledgement
We would like to thank Dr. Tamal Dey for making his software available.