This is an archival copy of the Visualization Group's web page 1998 to 2017. For current information, please vist our group's new web page.
Production-quality Tools for Adaptive Mesh Refinement Visualization
Table of Contents
- Introduction
- AMR Support in VisIt
- VisIt Enhancements
- Further Reading and References
- Acknowledgements
Introduction
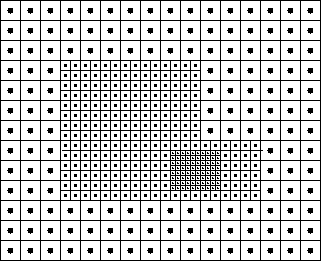
Adaptive Mesh Refinement (AMR) techniques combine the compact, implicitly specified structure of regular, rectilinear with the adaptivity to changes in scale of unstructured grids, see Figure 1. Handling AMR data for visualization is challenging, since coarser information in regions covered by finer patches is superseded and replaced with information from these finer patches. During visualization it becomes necessary to manage selection of which resolutions are being used. Furthermore, it is difficult to avoid discontinuities at level boundaries, which, if not properly handled, lead to visible artifacts in visualizations. Due to these difficulties, AMR support as first class data type in production visualization tools has been lacking despite the growing popularity of AMR simulations.
AMR Support in VisIt
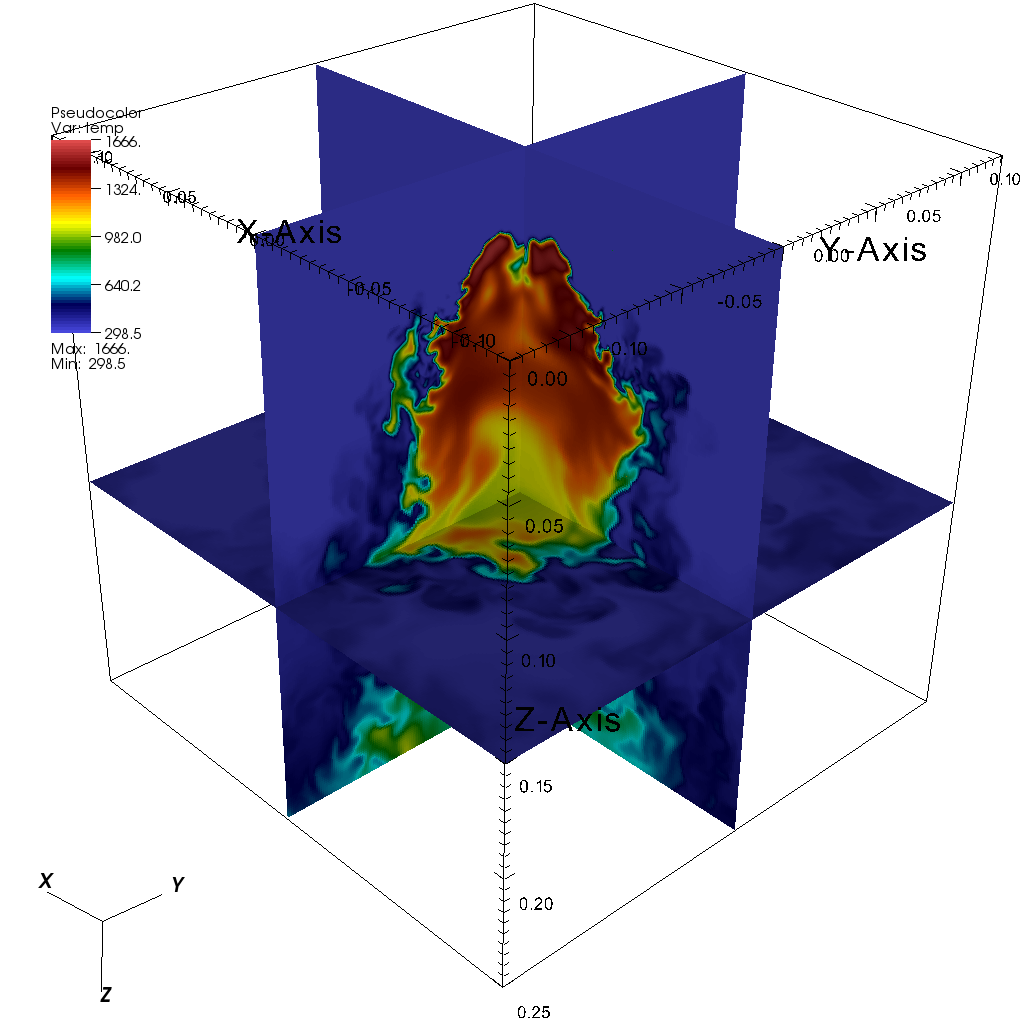
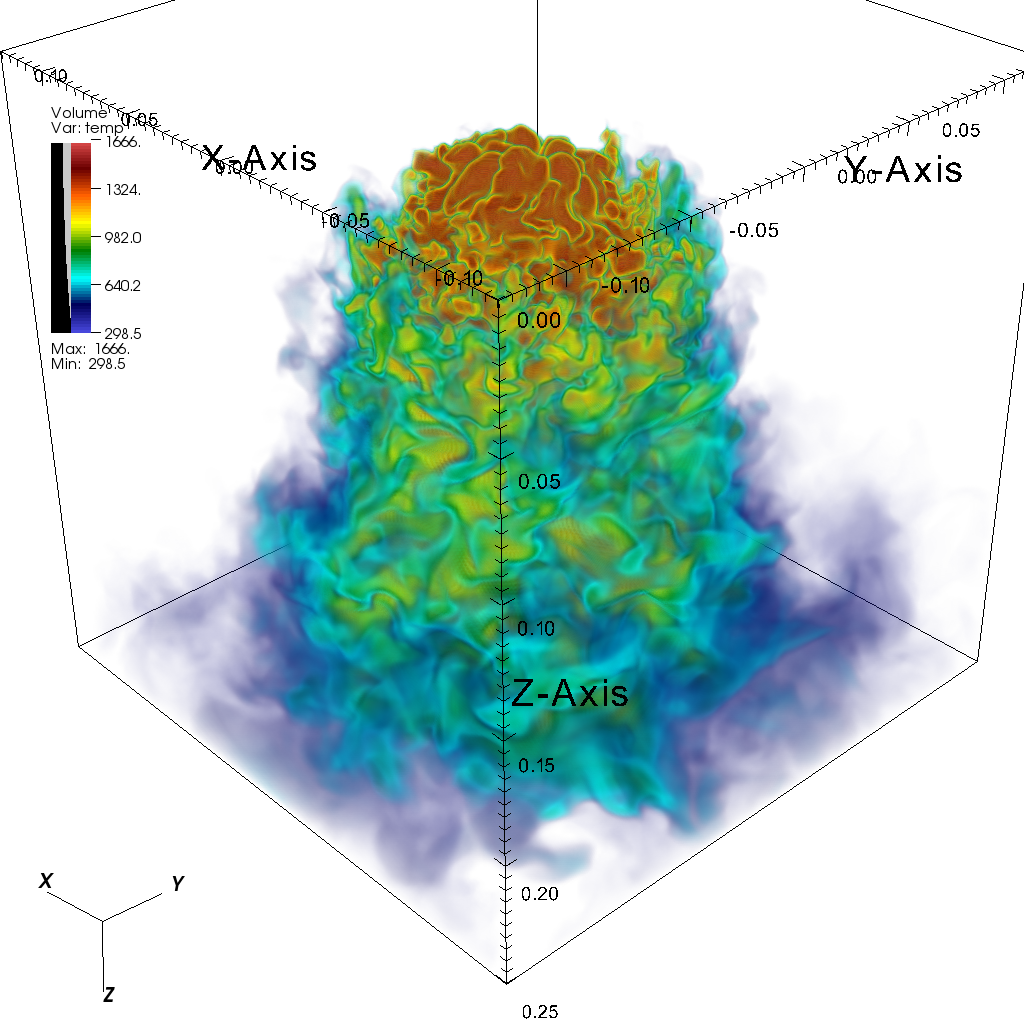
VisIt is an open source visualization tool that accommodates AMR as first class data type. VisIt handles AMR data as a special case of “ghost data,” i.e., data that is used to make computations more efficient, but which is not considered to be part of the simulation result. VisIt tags cells in coarse patches that are available at finer resolution as “ghost” cells, allowing AMR patches to retain their highly efficient native format as rectilinear grids. VisIt offers a rich set of production-quality functions, such as pseuodcolor and volume rendering plots (Figure 2), for visualization and analysis of massive scale data sets, making it an ideal candidate to replace specialized AMR visualization tools.
VisIt Enhancements
The majority of our work focused on implementing a set of essential debugging features offered by ChomboVis in VisIt. These efforts improve VisIt's handling of AMR data, both in terms of interface and performance, and will allow the Applied Partial Differential Equations Software Infrastructure Center (APDEC) to replace the ChomboVis tool with VisIt.
Interface Enhancements
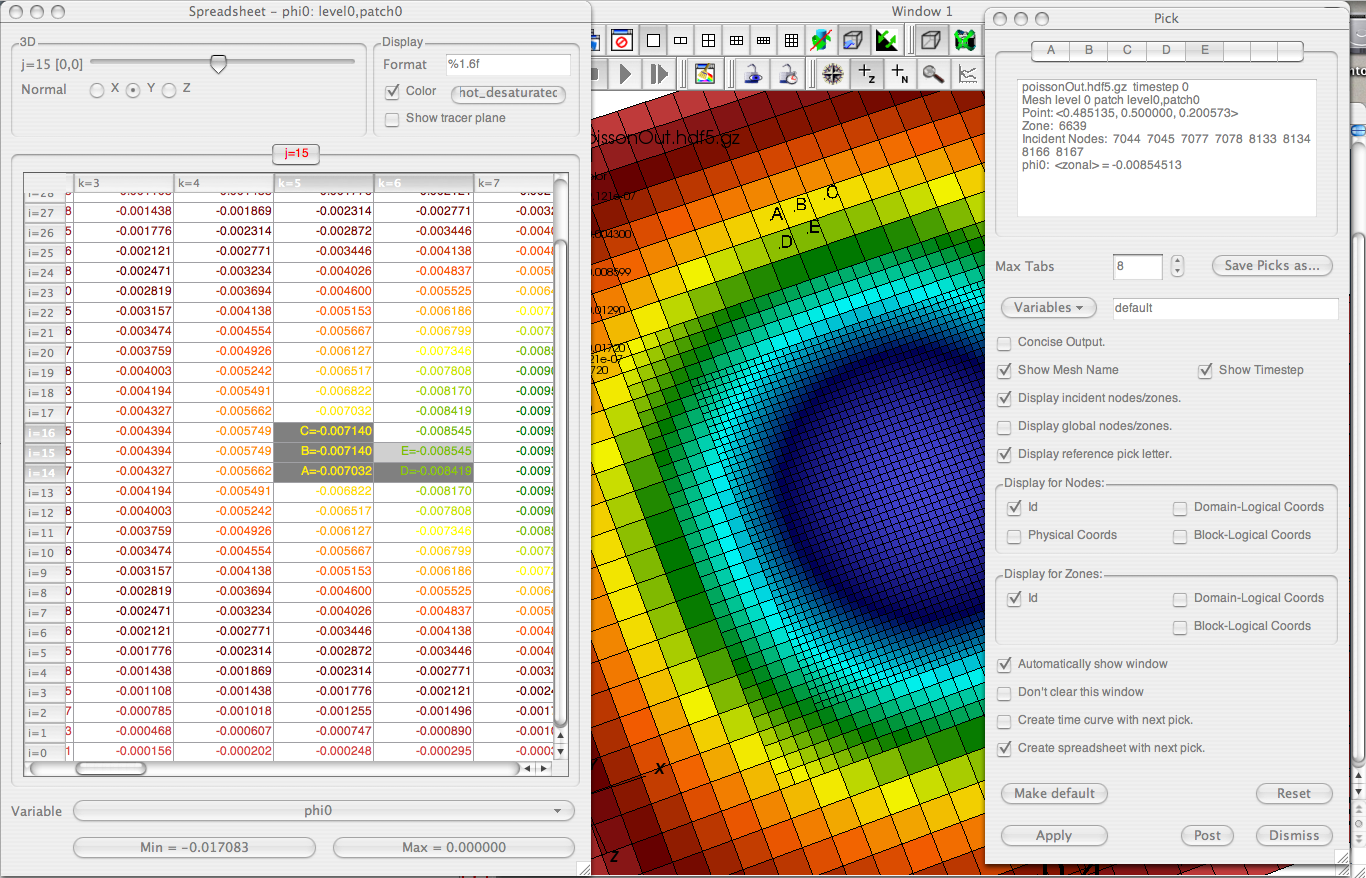
ChomboVis provides spreadsheet ”plots“ that support direct viewing of numerical values on a particular slice of a patch. This function is essential for debugging and used by AMR code development teams on a daily basis. We added these spreadsheets to VisIt, see Figure 3, and connected them to VisIt's ”pick cell“ feature, allowing users to ”link“ them to other plots. We further added a capability to create new buttons in the VisIt interface. This matches a capability that APDEC users valued in ChomboVis and allows new users to quickly navigate the tool. We also modified the VisIt selection routines to better support AMR data, allowing users to specify selections in terms of cell indices in a particular AMR level.
Performance Enhancements
We optimized handling of AMR grids in VisIt. These optimizations can save on memory by a factor of ten and also support more efficient rendering. Additional performance and memory optimizations improve efficiency for the important use case of rendering patch boundaries. VisIt previously used a very general algorithm that was unnecessarily slow. Our new, specialized algorithm is an order of magnitude faster and more memory efficient.Further Reading and References
- The fundamementals of block-structured h-adaptive AMR techniques that are used for the simulations we visualize are described by: Berger, M., Colella, P. (1989). Local adaptive mesh refinement for shock hydrodynamics. Journal of Computational Physics, 82, 64-84. Further information on current work on AMR simulation codes is available on the Berkeley Lab AMR page and the web page of the DOE APDEC SciDAC page.
- You can download a version of VisIt that includes the described enhancements, as well as documentation, at the VisIt web page.
- For an overview of visualization of AMR data see: G.H. Weber, V. Beckner, H. Childs, T. Ligocki, M. Miller, B. van Straalen, E.W. Bethel. "Visualization Tools for Adaptive Mesh Refinement Data." In: Proceedings of the 4th High End Visualization Workshop (Tyrol Austria, June 18-22, 2007), pp. 12-25, 2007 and the slides for the workshop presentation.
- Previous work of the Visualization Group on AMR data included using VisIt to visualize and analyze AMR data of turbulent reactive chemistry simulations and remote, distributed and high performance AMR visualization.
- VisIt's parallel volume rendering algorithm is desribed in detail by: H. Childs, M.A. Duchaineau, K.-L. Ma. "A Scalable, Hybrid Scheme for Volume Rendering Massive Data Sets." In: Eurographics Symposium on Parallel Graphics and Visualization, pp 153-162, 2006.