6 Assembling a Data Visualization Application 2
In this chapter, you will create an AVS/Express application from the ground up to visualize a data file in a standard scientific format.
In this chapter you:
6.1 Download the data file
In this section you will download a file that provides a snow cover data set from the Climate Diagnostics Center. The name of this file is snowcover.mon.ltm.nc. You can view information on this file at http://www.cdc.noaa.gov/cdc/data.snowcover.html.
This file is available through ftp at ftp.cdc.noaa.gov. It is located in the directory Datasets/snowcover
If you can not access this file, a copy is provided with Express in </data/netCDF>
- Visualization Edition users type:
Table F-1
|
|
|
|
|
click on the application icon
|
- Developer Edition users type:
Table F-2
|
|
|
|
|
click on the application icon
|
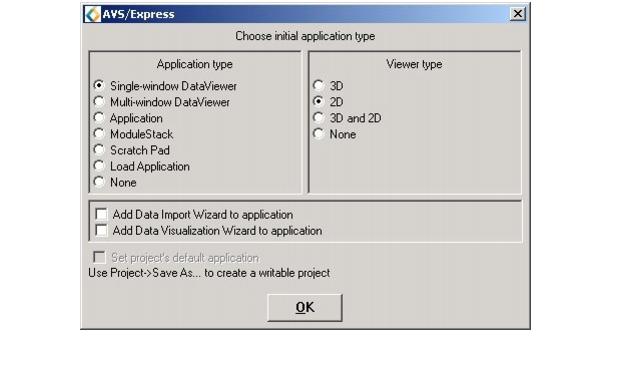
n Select
single-window Data Viewer as the application type in the initial application dialog box and
2D in the
Viewer type box:
In the previous step you created a 2D viewer in a single viewer application.
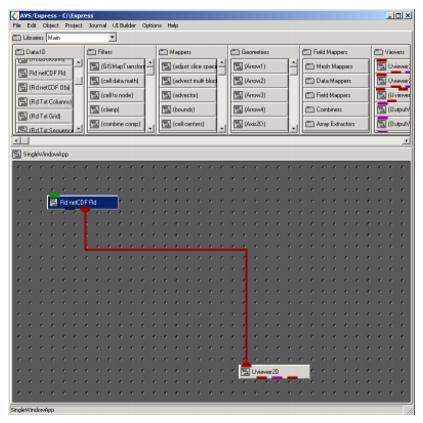
1. Drag an instance of
Rd_netCDF_Fld located in the
Main Library under
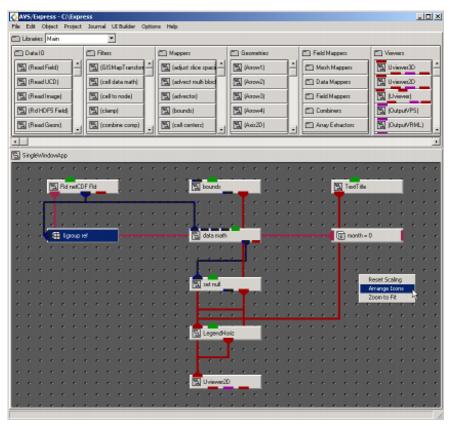
Data IO. Connect the red output port of Rd_netCDF_Fld to the red input port of Uviewer2D. Your network editor should look similar to this.
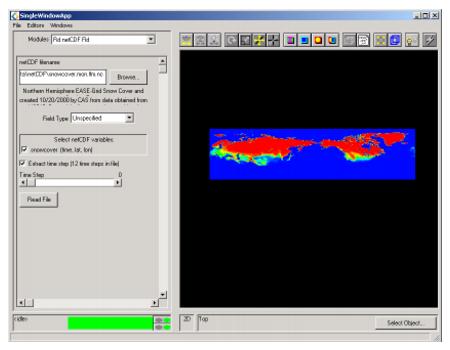
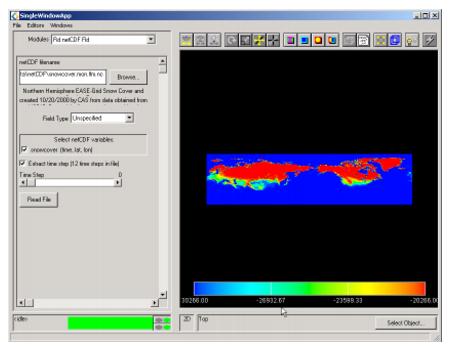
2. In the SingleWindowApp panel, click
browse to locate the file named
snowcover.mon.ltm.nc. If you are using the included file locate
snowcover.nc.
3. In the panel titled
select netCDF variables click the check box for
snowcover (time, lat, lon).
4. Click the check box marked
Extract time step.
5. Click the button
Read File. A map should appear. The first time step contains the date for January. Click on the arrows of the
Time Step slider to see the data for the other months.
Using the Group Reference to Examine the Field
1. In the Network Editor Scroll through the library and select Standard Objects. Go to parameters and select
&group_ref. Connect
Rd_netCDF_Fld field output port (black and blue) to the
&group_ref. Double click on
&group_ref to open it.
- Note: This is a useful technique to explore many types of objects.
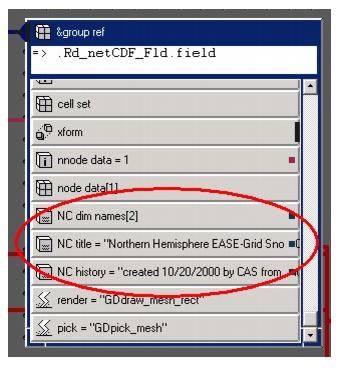
2. Scroll through the
&group_ref
till you find: NC dim names [2], NC title, and NC history. These objects were added by the netCDF Field reader and are not part of a typical field.
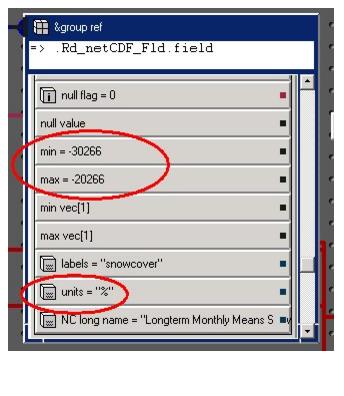
3. Now, look at
Node data in &group_ref. Note,
NC long name has also been added by the netCDF reader and is not part of a typical field.
- Notice the min, max and units. In order to make these values more meaningful, the sets will need to be translated. The numbers are units, but the values range from -30266 to -20266.
In this section we will add a Horizontal Legend to the map.
1. In the Main Library, from Geometries select
LegendHoriz.
2. Connect the red port output port of
Rd_netCDF_Fld to the red input port of LegendHoriz and the red output port of LegendHoriz to red input port of Uviewer2D. Look at the SingleWindowApp. You should view something similar to the picture below.
- Note: In the last section, using the group reference you noticed, the min, max and units were numbers that didn't make too much sense to you. You will notice now in the SingleWindowApp that the min and max numbers correspond to the data range in the legend.
1. In the Main Library from Filters drag an instance of
DataMath. Connect the black and blue port of
Rd_netCDF_Fld to the first black and blue port of DataMath.
2. Disconnect the
Rd_netCDF_Fld from LegendHoriz. Connect the red port of DataMath to the red input port of LegendHoriz.
- Note: If you have the ncdump utility (Not included with AVS/Express) installed on your computer you can view the netCDF file to get a better understanding of the next step.
3. Select
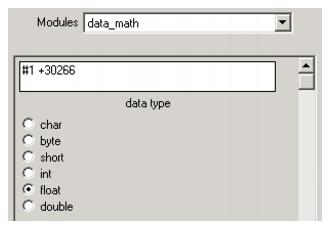
DataMath user interface panel by scrolling through the "modules" menu in the SingleWindowApp. In the type in box you will notice "#1." This refers to the first field input to data math. Multiple inputs are possible athought this example does not use them. We will attempt to change the numbers for min and max in the data math field.
- Note: Although the values for min and max have changed in the data math field, the original data from rd_netCDF_Fld remains the same. The data math module makes a new copy of the node data.
4. We will want to convert the min and max into positive numbers. In the type in box type add
30266 to the #1. The number comes from the max you observed earlier.
- You will notice that the min and max on the legend have changed to non negative numbers.
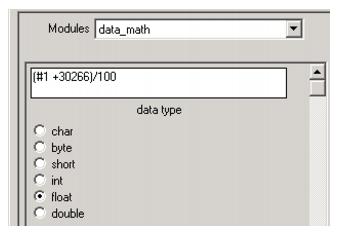
5. Since these numbers which look to be in the 10,000 range represent percentages we will divide these numbers by 100 to set the field values. In the type in box enter
(#1 +30266)/100.
- The numbers on your legend now should go from 0 to 100.
In this section we will filter the oceans from our data set, removing the blue from around the continents.
1. From the Main Libraries in the filters instance
set_null.
2. Unhook data_math from Uviewer2D. Connect the black and blue output port of data_math to to the black and blue input port of set_null. Connect the red output port of set_null to red input port of Uviewer2D.
3. Unhook data_math from LegendHoriz. Connect the red output port of set_null to the red input port of LegendHoriz.
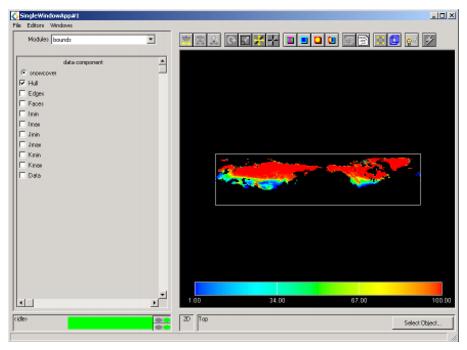
4. Instance from the Main Library,
Bounds. Connect it to the red output port of Rd_netCDF_Fld and to the red input port of Uviewer2D. A white box will be drawn around the map which represents the extent of the original data set. Your SingleWindowApp should look like this.
In this section you will add a title to the application.
1. From Geometries in the Main Library instance
Text_Title.
2. Connect Text_Title to the Uviewer2D.
3. From the Standard Objects Library instance int. Rename it "Month."
To rename an object right-click and select
rename.
4. Double-click on Rd_NetCDF_Fld to open it. Double-click on Read_NetCDF_Param to open it. Find timeStep, right-click on it and select
properties. Scroll through the property group and select
Network Editor Properties. In the Current Properties select
NE Port Levels. Change the 2 to a 3. Select
OK. Another port should appear on Rd_NetCDF_Fld.
5. Double-click to close Read_NetCDF_Param. Double-click to close Rd_NetCDF_Fld. Connect the new port on Rd_NetCDF_Fld to the int you created, Month.
6. Open Text_Title, open Text_UI, open string and scroll to open text. Enter this string into the type in box:
=>str_format("Snow Cover for month %d",month)
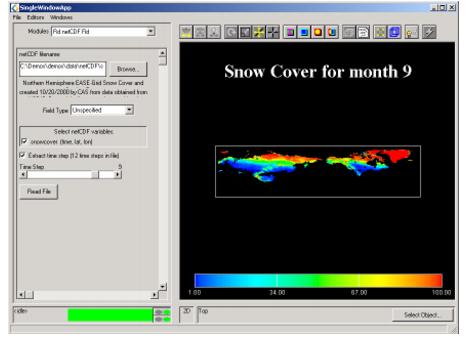
7. Close Text_UI, and Text_Title. Now view your SingleWindowApp. It should appear similar to this. Slide the Time Step in the Rd netCDF Fld module if you wish to change the month.
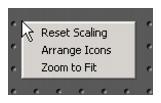
- Look at the network editor again. Right-click in the working area. This menu should appear.
-
- Click on Arrange Icons. The icons in the work area will be arranged in an orderly fashion.
-
- You have now created an application similar to one of the examples of AVS/Express. The example is differs from your copy in two ways. In the AVS/Express example, a summary panel is included and the example contains a more involved technique for constructing the title string. You can view this example, named NetCD_Snowcover, in the Examples library under visualization and subheading readers.