5 Modifying the Data Visualization Application
In this chapter, you use the DataViewer editors and the Network Editor to modify your data visualization application.
- Start AVS/Express
- Load Your Application
- Add Objects to Your Application
- Add a Crop Object to Your Application
- Save Your Application
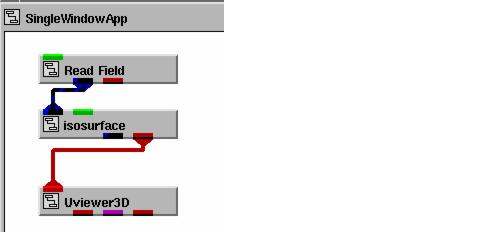
In the last chapter, you created a data-visualization application that reads a field data file, generates an isosurface of the field, and renders the isosurface in a data viewer.
In this chapter, you modify the application. You add two modules to the application:
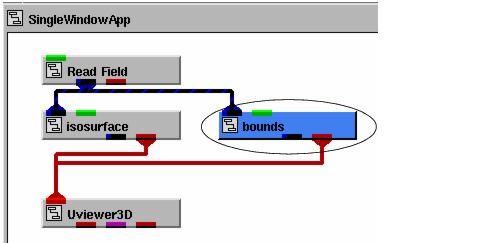
- The bounds object displays a bounding box around the hydrogen object in the view. It connects through an input port to the Read_Field object to reference the hydrogen data. Internally bounds calcuates the extents of the data from the field. It connects to the UViewer3D object to output a bounding box that represents the extents of the data in the viewer.
- The crop object allows the user to reduce the field data to a specified range, much like cropping a photograph, before it is passed to isosurface. crop, like bounds, connects to Read_Field to reference the data, clamps the data according to values set by the user through the module interface, and outputs the modified data as a field through its connection to isosurface.
- Note: Developer Edition users can use the techniques learned in this chapter to customize the subobjects in existing AVS/Express objects. By maximizing an object and adding subobjects to its network, you can extend and specialize the behavior of the AVS/Express objects.
For more information, see the Using AVS/Express manual.
- Visualization Edition users type:
- Developer Edition users type:
- Note: Do not start AVS/Express in the background. You start AVS/Express in the foreground because AVS/Express' V Command Processor (VCP) uses the shell window.
- Because you will load the application that you built and saved in the last chapter, you start the Network Editor without an application framework. Instead the Network Editor workspace displays the Applications object. This is a special object that contains all the applications you load into the Network Editor. It does not include the DataViewer editors or viewer window.
You begin by loading your application into AVS/Express.
- A file-selection dialog appears.
- Navigate to it, select it, then select the OK button.
- AVS/Express loads the application into the Applications workspace:
- The SingleWindowApp DataViewer appears with Read Field's interface displayed inxx the Modules editor.
- A file selection dialog box appears
The hydrogen data is read into the Read Field module, triggering both the isosurface and Uviewer3D modules. The hydrogen image appears in the DataViewer window.
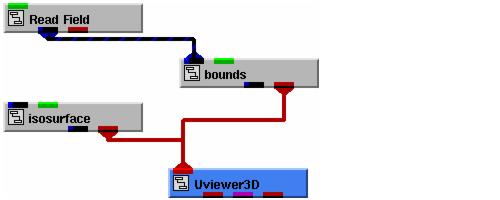
The bounds object creates a bounding box for a field. A bounding box helps you visualize your data's extents. In this section you add a bounds object to your application, then test it.
- Note: You can add a bounding box to the hydrogen object in the view using the Object editor in the DataViewer. The DataViewer provides easy access to a bounding box but does not give you as much control over the bounding box as the bounds object.
- bounds is located near the top of the Mappers library- the same library where you found isosurface.
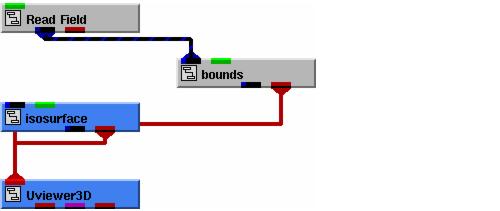
- You connect the left input port of bounds to the left output port of Read_Field. You connect the input port of Uviewer3D to the right output port of bounds.
- You will not see the bounding box in the DataViewer view window yet.
b. Move the mouse pointer to the hydrogen image in the viewer window. Press and hold the left mouse button and drag the mouse pointer downward a bit.
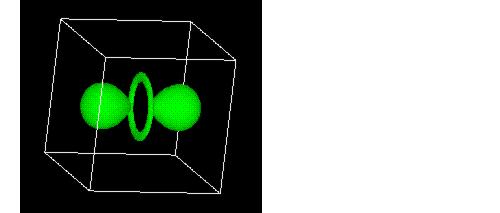
- Notice that the object has a bounding box, which in the current perspective appears as a white square surrounding the object.
- bounds lets you display various surfaces along the bounds.
- From the Modules option menu at the top of the editor panel in the DataViewer, select bounds. The user interface for bounds appears, consisting of a set of toggle options:
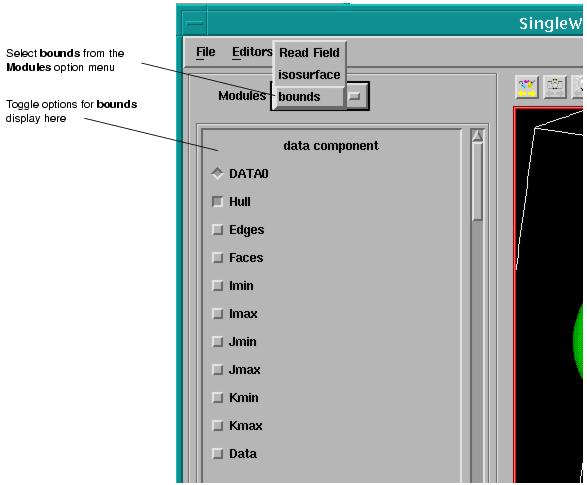
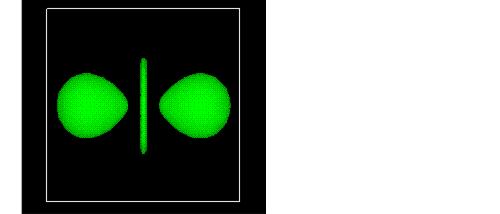
- Select the following toggles: Edges, Imax, and Data. AVS/Express displays the surface data along the maximum I face:
The crop object crops a set of field data along one or more selected dimensions. In your application, you insert crop between Read_Field and isosurface so that the application will display an isosurface of data that has been cropped.
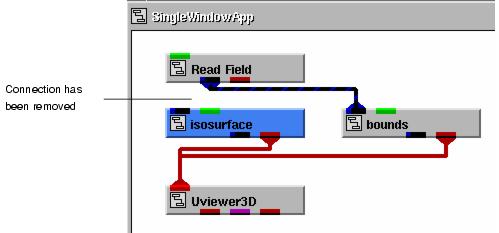
- One way to disconnect objects is to repeat the connection operation, as if you were connecting the objects a second time. Another way is to move the mouse pointer to the connection line, then select the Delete Connection popup command with the right mouse button. AVS/Express disconnects the objects.
- You want to insert crop between Read_Field and isosurface, but it will not fit. So you first move isosurface and Uviewer3D down. One way to do this is to drag each object separately. Another way is to lasso the objects and move them at the same time. The instructions below illustrate how to lasso objects.
- Note: You do not have to physically place crop between Read_Field and isosurface to make the connections. You could place it anywhere, but the connection lines would not be as clean, and it would be harder to see the structure of your application.
- As you do, the Network Editor displays a rectangle. This is the lasso. Any object completely or partially inside the lasso when you release the mouse button will be selected.
- The Network Editor selects both objects and highlights them in blue.
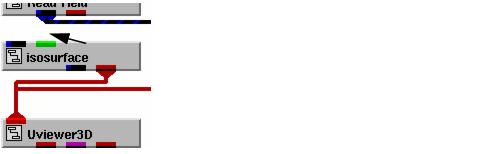
5. Move isosurface and Uviewer3D down by positioning the mouse pointer over one of the selected objects, then dragging the pointer with the left mouse button.
- The objects now look something like this:
- Notice that the connection line between Uviewer3D and bounds passes under isosurface. You can make the connection line clearer by moving Uviewer3D to the right.
6. Move the mouse pointer to an unoccupied area in the application workspace, then click the left mouse button.
- This deselects both objects.
- Uviewer3D, now the only selected object, moves accordingly.
- You are now ready to add the crop object.
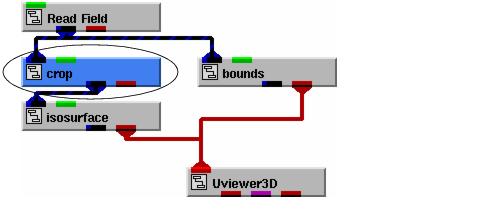
8. Instance crop and position it below Read_Field. Then connect crop to Read_Field and isosurface, as shown in the diagram below.
- crop is located in the Filters library. Connect the left input port of crop to the left output port of Read_Field. Connect the left input port of isosurface to the left output port of crop.
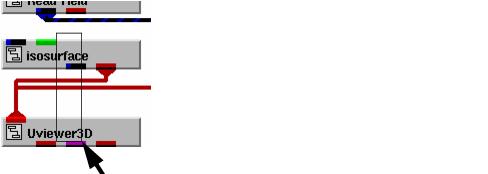
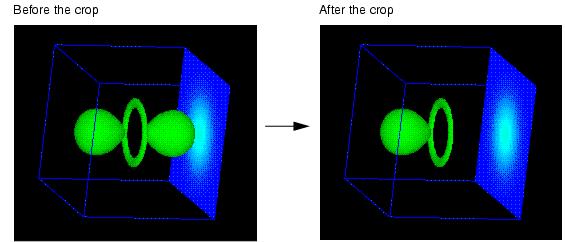
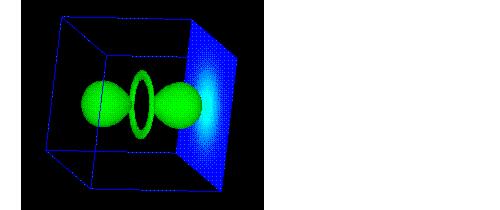
- Select the crop option from the Modules option menu. The user interface for crop appears, consisting of a set of min and max sliders for dimensions I, J, and K. Drag the I max slider (the second one down) with the left mouse button until it is set to 32.
- AVS/Express crops the data object, removing all values greater than 32 along the I dimension. Here is what the data object looks like in the viewer window, before and after the crop:
Finally, you can save the application.
- A standard file-selection dialog appears.
- AVS/Express requests confirmation and then saves the application.