3 Creating an Application Using the Wizards
In this chapter you will create a new application using the Data Import Wizard and the Data Visualization Wizard.
In this chapter you:
In the last chapter, you created a learned how to start demos and examples in AVS/Express. In this chapter, you will learn to create an application using the Data Import Wizard and Data Visualization Wizard.
These new wizards help the new AVS/Express user get started, by helping them create their own simple network easily. Experienced users may find the wizards a useful tool to quickly start creating an application.
1. Open a command shell or an xterm window.
2. Navigate to the
express directory.
3. Start AVS/Express by typing the platform-specific command listed below.
Table C-1
|
|
|
|
|
click on the application icon
|
- Note: Do not start AVS/Express in the background. You start AVS/Express in the foreground because AVS/Express' V Command Processor (VCP) uses the shell window.
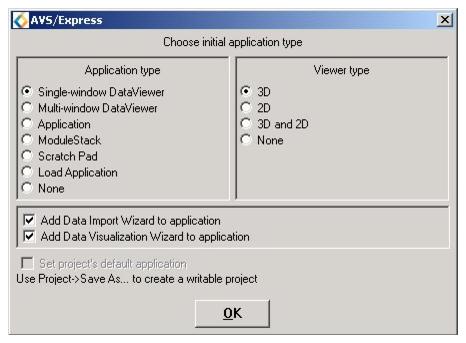
4. Select
Single-window DataViewer as the application type,
3D as the viewer type,
Add Data Import Wizard to application,
and
Add Data Visualization to application in the initial application dialog box:.
-
3.3 Using the Data Import Wizard
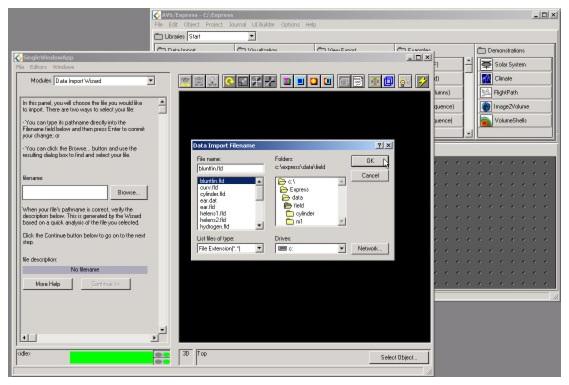
1. Click on
browse in the Data Import Wizard panel. A file-selection dialog appears.
2. Select
bluntfin.fld which should be in
Express\data\field.
- Navigate to it, select it, then select the OK button.
-
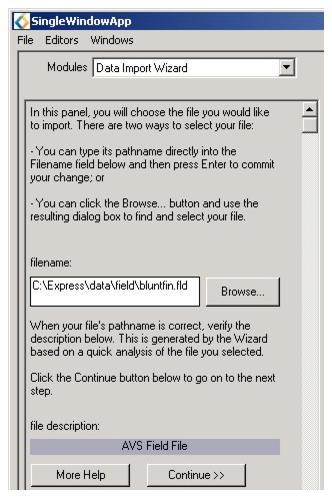
3. After you have selected bluntfin.fld, your application window should look similar to this. The darker grey box near the bottom of the panel will have a description of the file you have chosen. Click on
continue to read the file
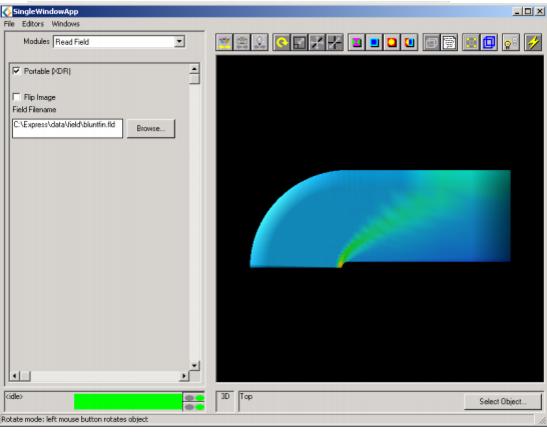
Your application window should look something like the picture below. For this particular file the reader has automatically read in the file. This is not true for all files. In some cases you will be prompted to answer questions about your file in order to choose the correct reader.
-
3.4 Using the Data Visualization Wizard
In this section we will use the Data Visualization Wizard. Your file has been read in and you can visualize your data on the right side of your applications window.
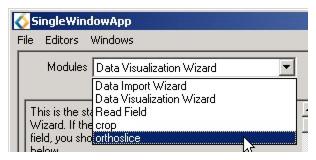
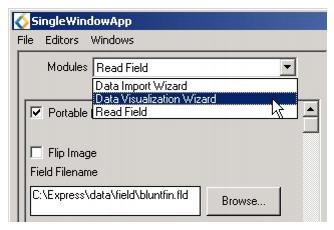
1. In the modules menu, select
Data Visualization Wizard.
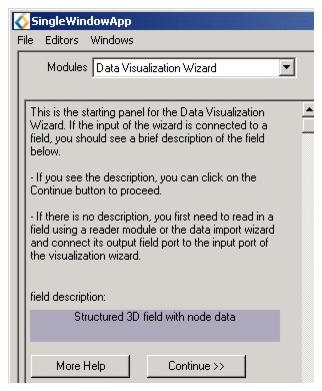
2. You will now see the starting panel for the Data Visualization Wizard. Notice the darker grey box near the bottom of the panel with the field description. When using the Data Visualization Wizard you must already have a file read into AVS/Express.
-
- Click on continue to proceed to the Wizard.
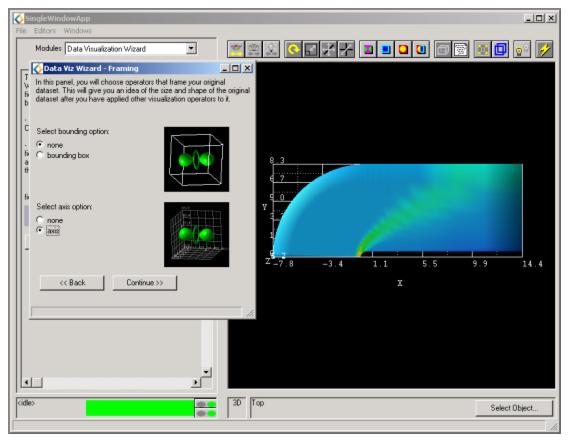
3. The Data Visualization Wizard's first dialog window will pop up. Note that it appears in a new window independent of the Single Window Application. The first panel asks you if you want to have operators that frame your dataset such as a bounding box or axis. You are free to select both to see what they do in the application window. When you are ready to go on select
none for bounding option and for
axis for the axis option. Click on
continue to proceed. Notice that the visualization in the viewer window will immediately update.
-
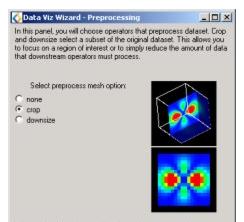
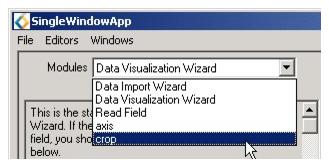
4. The next panel asks you how to preprocess your data. Preprocessing allows you to focus on a region of interest or to reduce the amount of data that the operators must process. In this tutorial we will be using the crop operator. Select
crop and go to the application window.
-
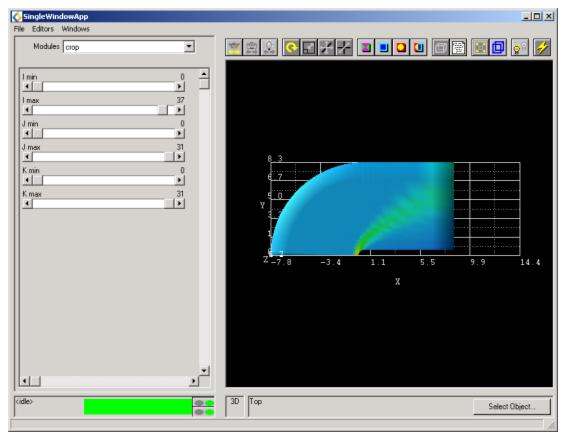
5. In the modules window select
crop.
6. In the crop panel click on the arrows of the
l max scroll bar. This crops the image. When you are done return the scroll bar to its original position on the right.
-
7. In the Data Visualization Wizard dialog click
continue. In this panel you will choose the core visualization operation. If you are using another dataset, the list of options might vary.
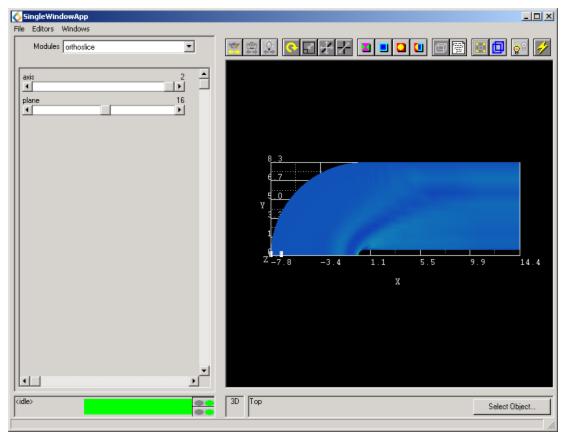
9. In the application window scroll through the modules and select
orthoslice.
-
-
10. In order to visualize the position of the slice relative to the rest of the dataset, it would be best to view the visualization at an slight angle. If you change the orthoslice axis by rotating the visualization, it will prevent the slice from being "invisible" due to being edge on to the viewer. Rotate the image by clicking on it and dragging your mouse slightly to the left.
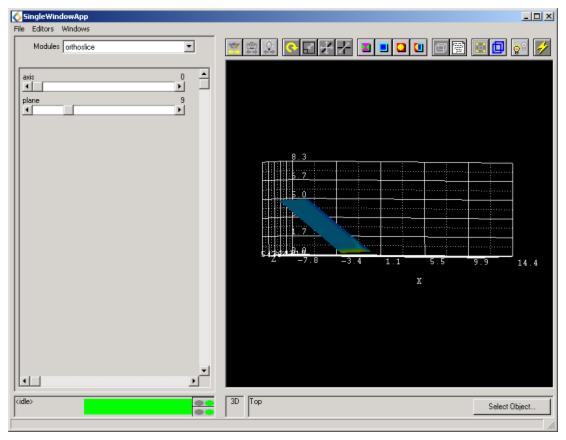
11. Use the axis slider to make the value 0.
-
12. Click on the arrows of
plane. The position of the orthoslice in the viewer will change.
13. When you are finished, go back to the Data Visualization Panel and select
continue to go on.
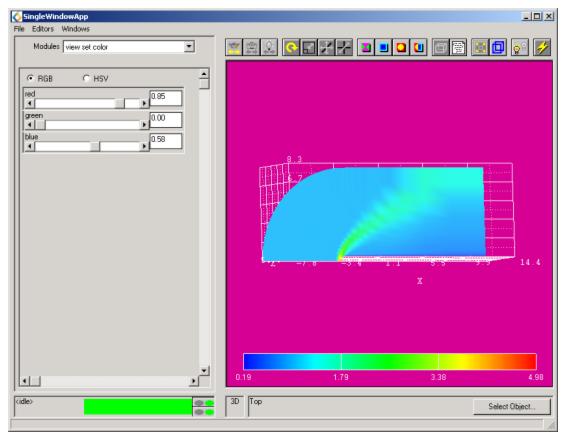
14. This is the last panel of the wizard. You can choose a legend and the background color of your viewer.
15. Select
horizontal, you will see a full colored legend at the bottom of your viewer.
16. Select
set color scroll though the modules in your application window to find
view set color. You can change the color by using the sliders to change the values.
-
17. Click
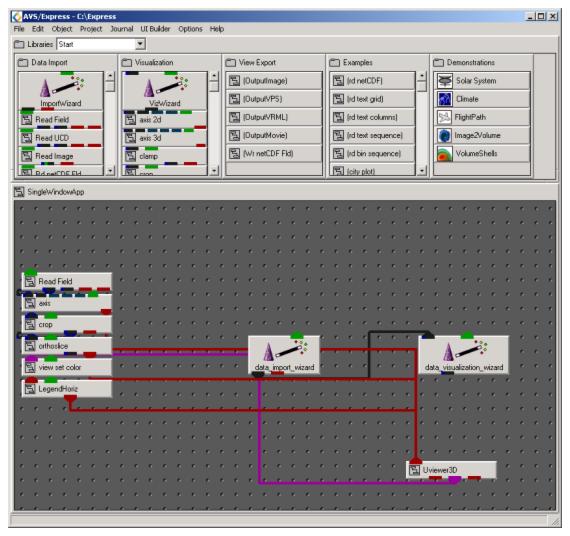
finish. You have completed the Data Visualization Wizard. Your network editor should look something like this.
-
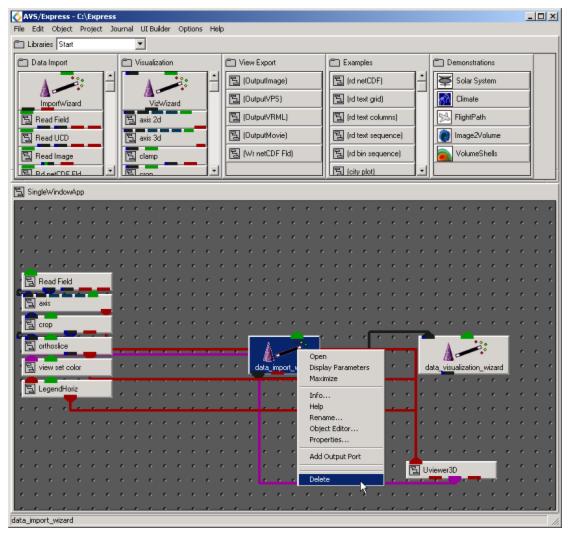
18. Once the network is created, the wizards can optionally be deleted from the workspace. Right click on the Data Import Wizard and select
delete.
-
19. Repeat step 18 with the Data Visualization Wizard.
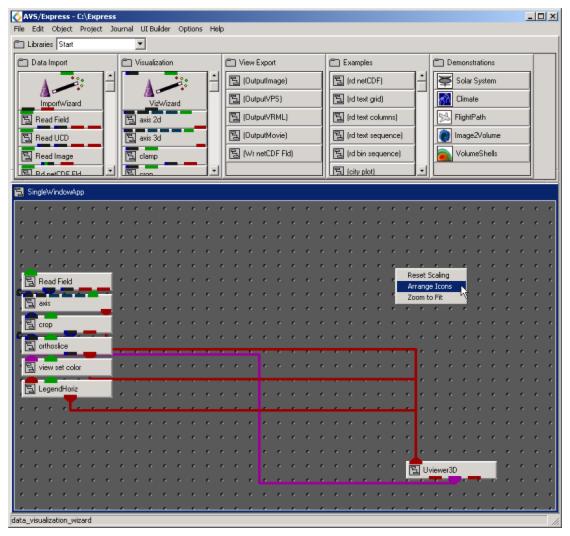
20. Now you can organize your workspace so that you can study how everything is linked together. Right click on the desktop and select
Arrange Icons.
-
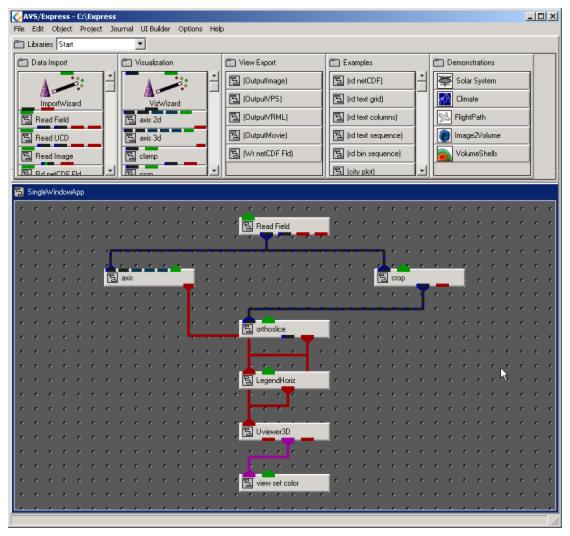
- Your final workspace should look similar to this.
-
-