This is an archival copy of the Visualization Group's web page 1998 to 2017. For current information, please vist our group's new web page.
|
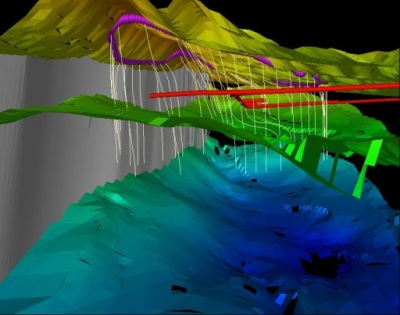
In 1997, the LBNl Visualization Group collaborated with scientists from LBNL's Eartth Sciences Division to create a visualization showing the Yucca Mountain storage facility. This visualization integrates divergent types of data, and will be used to ask "what if" questions pertaining to water flow through the site. Look for this model soon in in LBNL's Washington DC office. More information. |