|
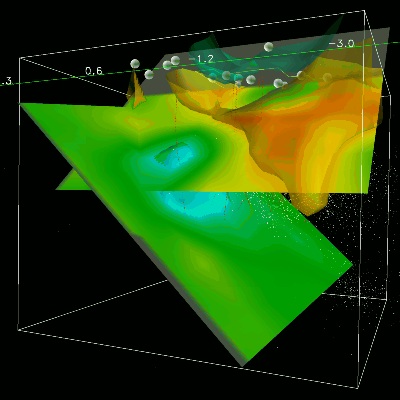
This example, circa 1991, is characteristic of site modeling problems in
Earth Sciences. The image shows visualization of several variables in
data taken from a geothermal energy site in Northern California. The slice
planes show color-coded pressure (water), and the two isosurfaces show
3D regions of constant water pressure within the field. The spheres at
the surface (top of the image) are observation stations, and the
cloud of points inside the volume represent earthquake epicenters. Although
hard to see, the red polylines show the path taken by geothermal
wells in the field. Unfortunately, there is no additional information
about this image or the science - such information has been lost to
history.
|