Visualization of three-dimensional reconstructions
of Electron Tomography studies of Bacterial Structure and Function
Table of Contents
The Science
Bacteria contain a wealth of mechanisms that organize their internal and
external structure. Electron tomography offers the possibility to localize
the cell components at a resolution that allows a better understanding
of their structure and function. The 3D reconstruction of whole cells should
lead to the ability to model spatial and temporal relationships between
sub-cellular structures, organelles and macromolecular complexes
[1]. For more
information contact
Dr. Ken Downing, Life Sciences Division,
Lawrence Berkeley National Laboratory.
Electron Tomography
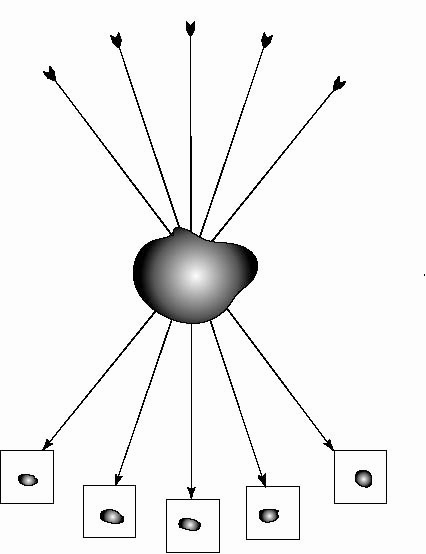
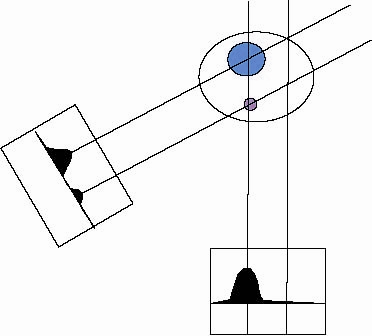
Electron Tomography consists of obtaining a three-dimensional reconstruction
of an object from a series of projection images. Data collection is accomplished
by tilting the specimen in the electron beam to produce what is known as a
tilt series (see Figure 1A). Like other imaging techniques that use penetrating
radiation, TEM provides
a translucent view of the specimen where the details from different depths
are superimposed in a 2D projection. A computational operation called
"back-projection" is then used to create a three-dimensional object from the
tilt-series images. The back-projection algorithms project back the mass of the
specimen into the reconstruction volume. When this process is repeated for a
series of projection images from different angles, back projected rays intersect
and reinforce at the points where mass is found in the original structure
(see Figure 1B).
The rays will pass through different amounts of specimen mass producing a different
image for each angle.
|
|
|
Figure 1A.
Single axis tilted series.
|
Figure 1B.
Projection process.
|
The resolution and quality of the reconstruction depend primarily upon two
factors. First, the resolution of tilt angle between each successive image
has a dramatic effect upon reconstruction quality. The smaller the tilt angle,
the better the reconstruction. Second, the total tilt range determines the
amount of 3D data "seen" over all tilt angles. The larger the total tilt angle,
the more data will be seen in the reconstruction.
Generally, images are acquired at 1-2 degrees of tilt angle between successive
images over a total tilt range of about ± 60-70 degrees. A CCD camera is
generally used
for image acquisition. Radiation damage sets a limit to the effective resolution
in frozen-hydrated samples (the samples are heated and melt in the radiation
beam over time). It has been predicted that the resolution limit
is around 20Å to 30Å for thick, frozen samples.
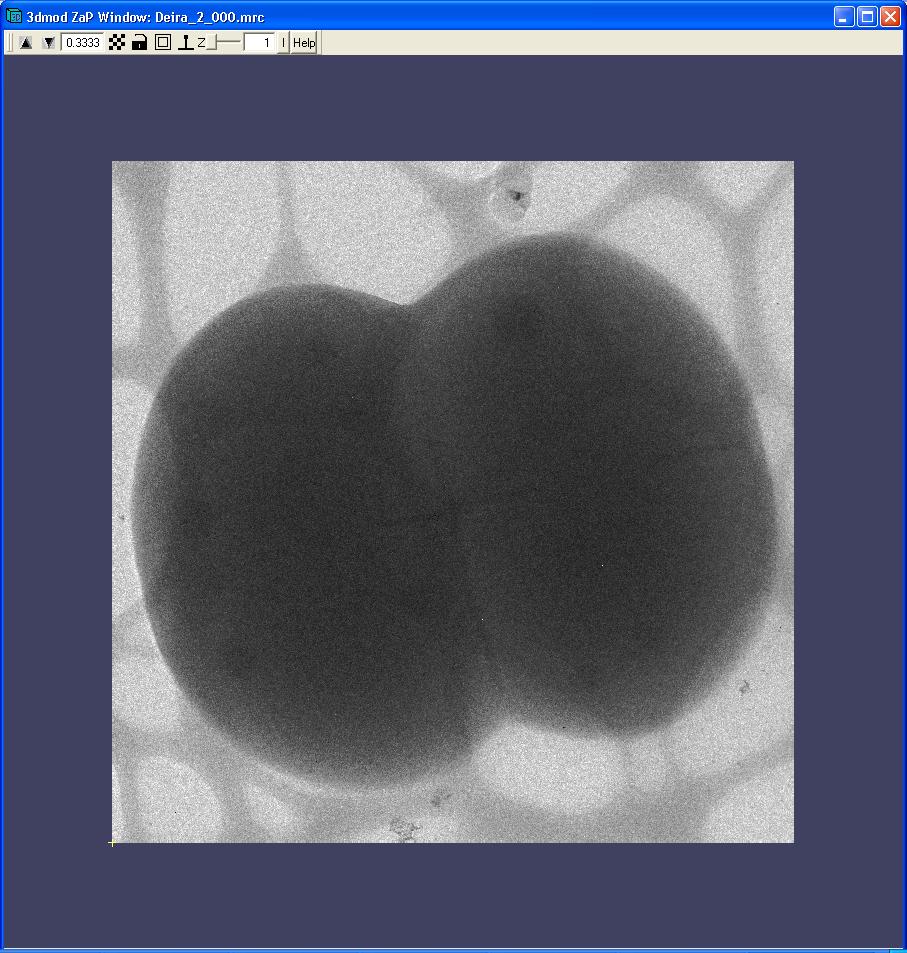
From Images to 3D Volume
|
|
Figure 2.
Alignment in process. Click on the image to see a movie of the tilt series.
The tilt series images are aligned before back-projecting them.
|
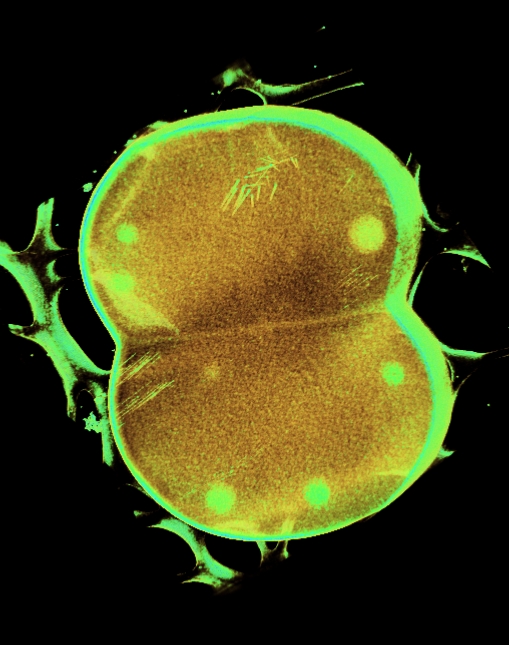
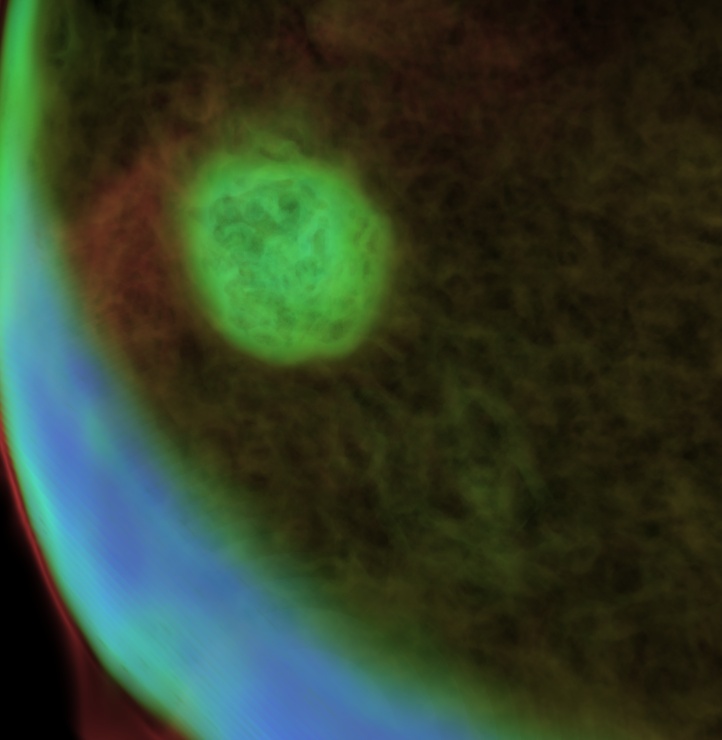
Volume renderings of the 3D reconstructions
|
|
|
|
|
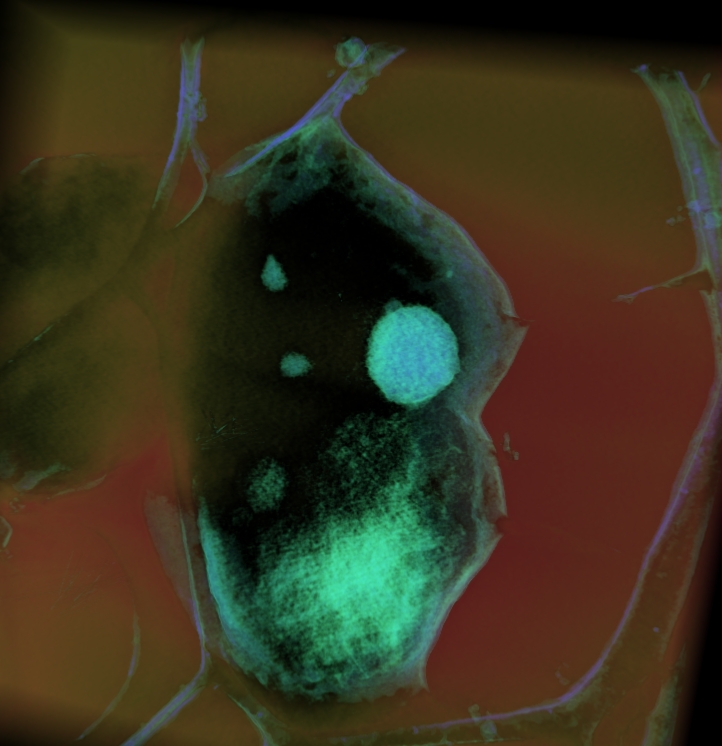
Frozen-hydrated Deinococus Radiodurans, prepared by plunge-freezing into liquid
ethene and later transfered to liquid nitrogen.
|

|

|
|
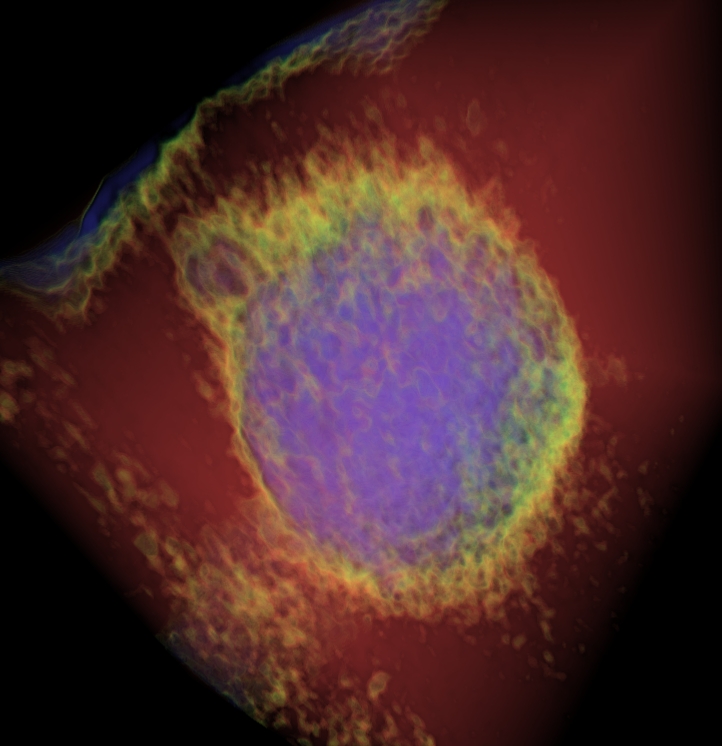
A plastic-embedded section of Desulfiovibrio vulgaris.
|
|
|
|
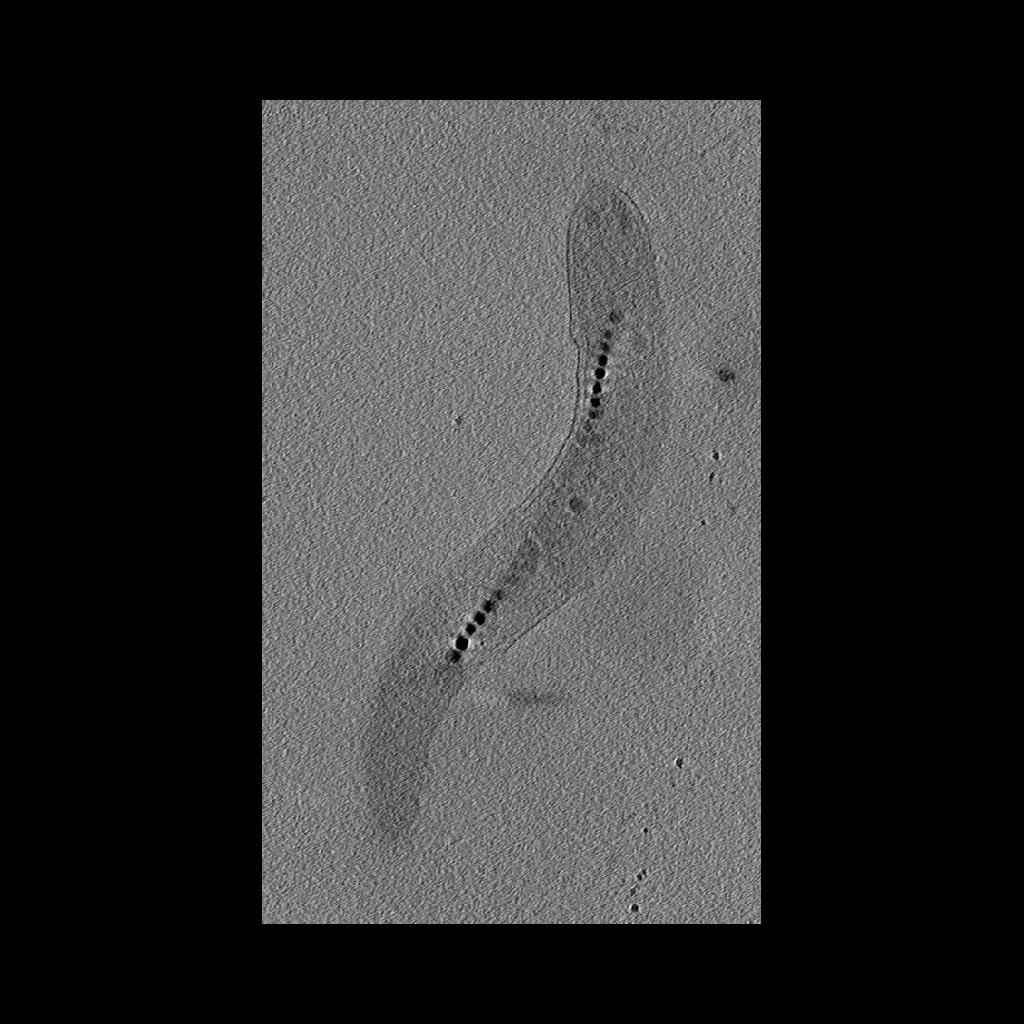
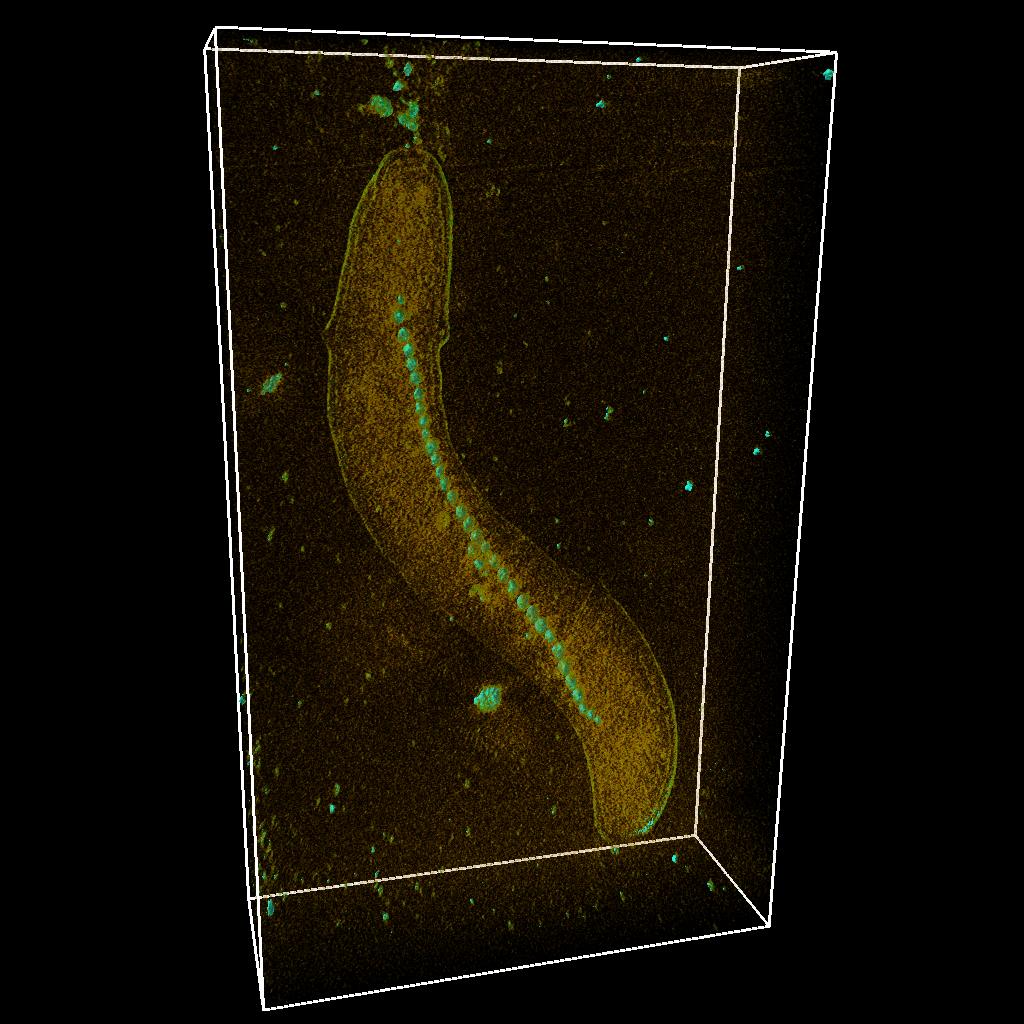
Frozen-hydrated (unstained) Magnetospirillum magnetotacticum, slice through the reconstruction and 3D volume.
|
AVSExpress Model Builder
Some of the three-dimensional reconstructions have a low signal to noise ratio
resulting in data that produces difficult-to-interpret visualization output.
Volume data with 2D features that are not easy to distinguish make a perfect
case for construction of a model of structural features. The model - discrete
representation of structure partially visible in noisy data - is easier to
visually interpret, making it easier for researchers to understand the shape
and topology of such features. In contrast, attempting to extract model surfaces
using isocontouring applied to noisy data produces results that are exteremely
difficult if not impossible to interpret.
AVS/Express offers considerable flexibility for constructing sophisticated
visualizations. However, it does not provide a built-in module to construct models
of the form required for this particular scientific project. We developed a custom
AVS/Express module that allows a user to interactively select points in 2D slices
of the 3D, reconstructed volume data (uniform mesh). Next, the module constructs a
line mesh, then join the lines from adjacent slices into 3D surfaces.
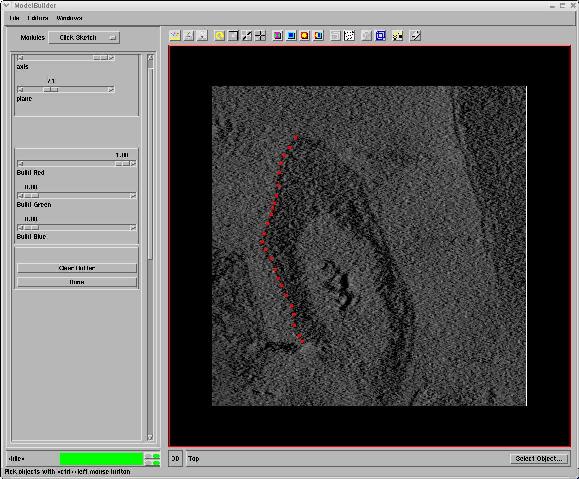
Solution:
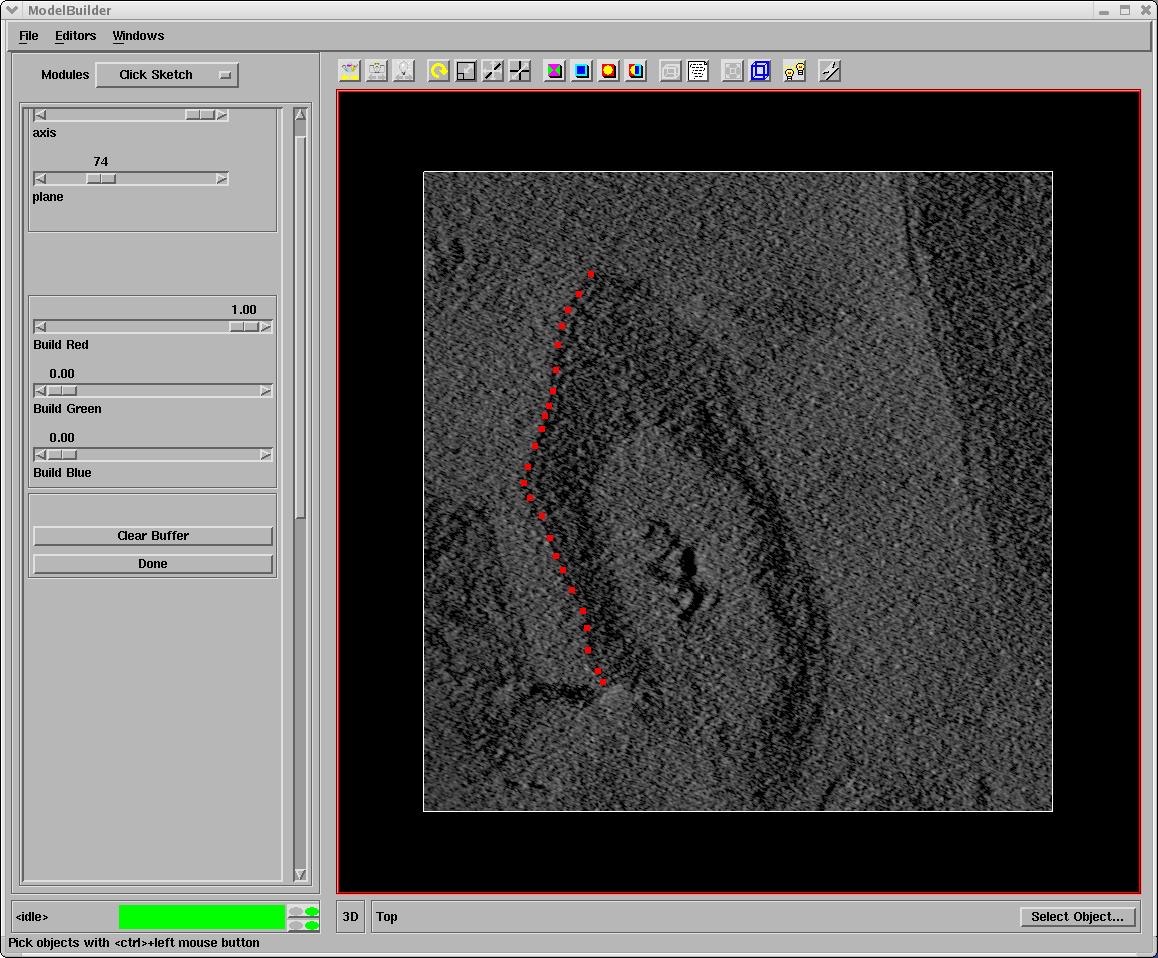
The model builder application uses AVSExpress built-in modules along with several
custom-developed modules. The user starts by selecting points in orthogonal slices
of the 3D reconstruction volume data (see Figure 3a and 3b). After manually selecting
points on multiple slices from the 3D volume data, the composite surface mesh is
automatically created from the lines in each slice.
 |
 |
|
Figure 3_a. User interface with points selected in slices of the volume using a modified Click Sketch module.
|
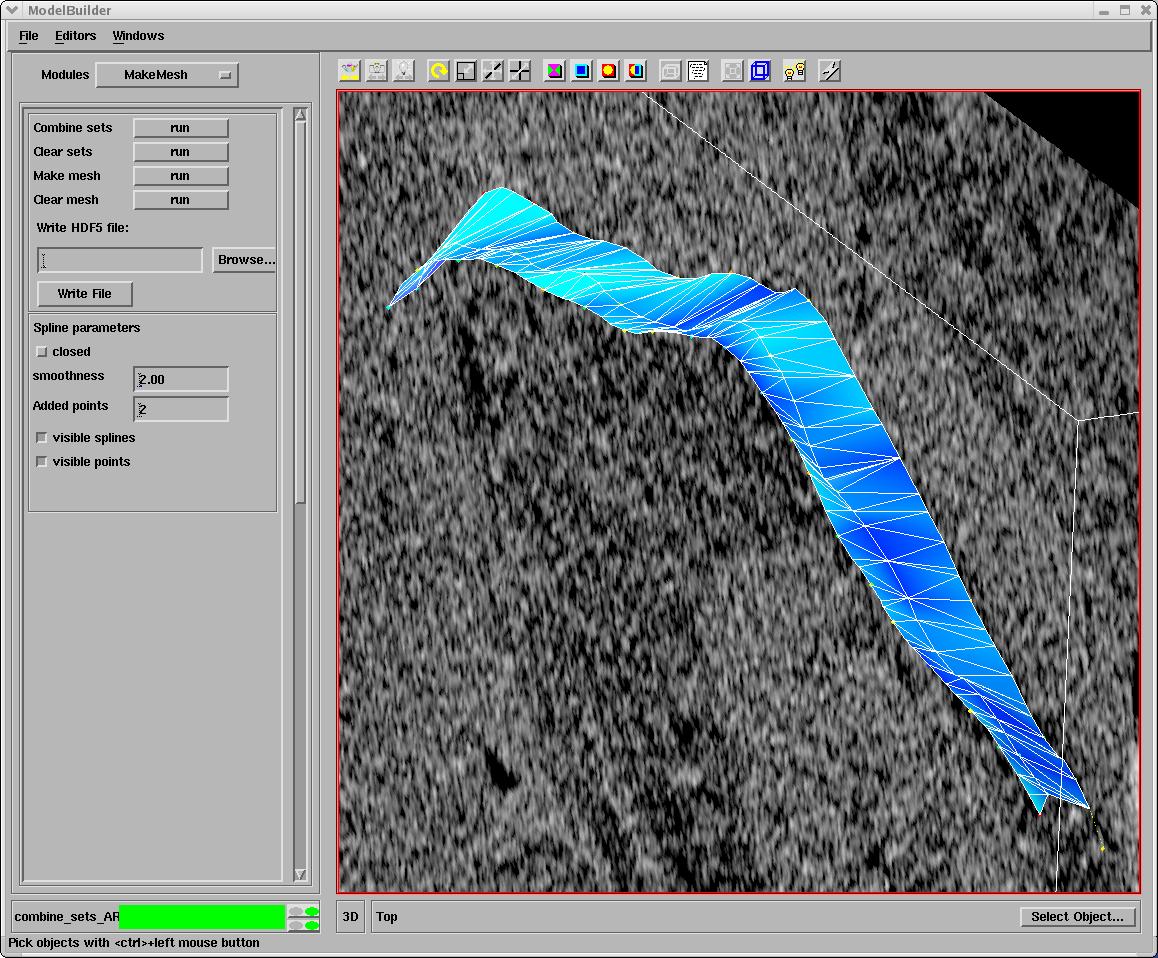
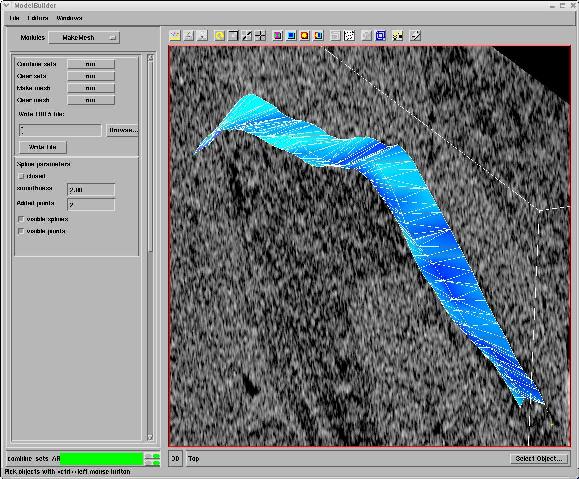
Figure 3_b. Splines connected to make a surface of the selected points. |
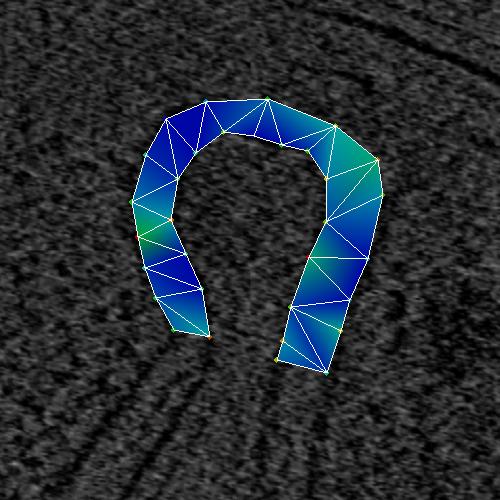
The line mesh builder has the option of joining the points with a Catmull-Rom spline
(more information about
Catmull-Rom splines) with a smoothness and an "added_points" parameter.
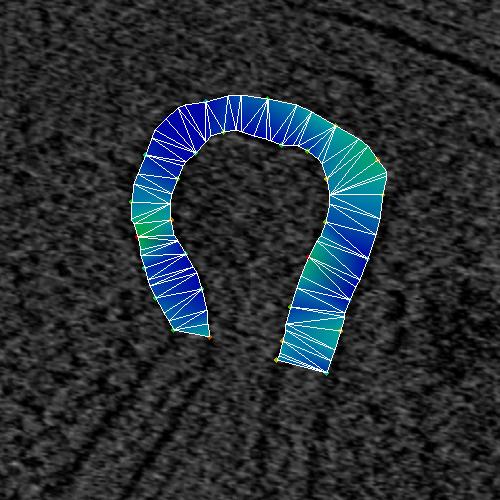
Figures 4a, b,and c show different settings for the splines.
 |
 |
 |
|
Figure 4_a. Line mesh with no points added.
|
Figure4_b. Line mesh with two points added and smoothness 1.
|
Figure4_c. Line mesh with two points added and smoothness two.
|
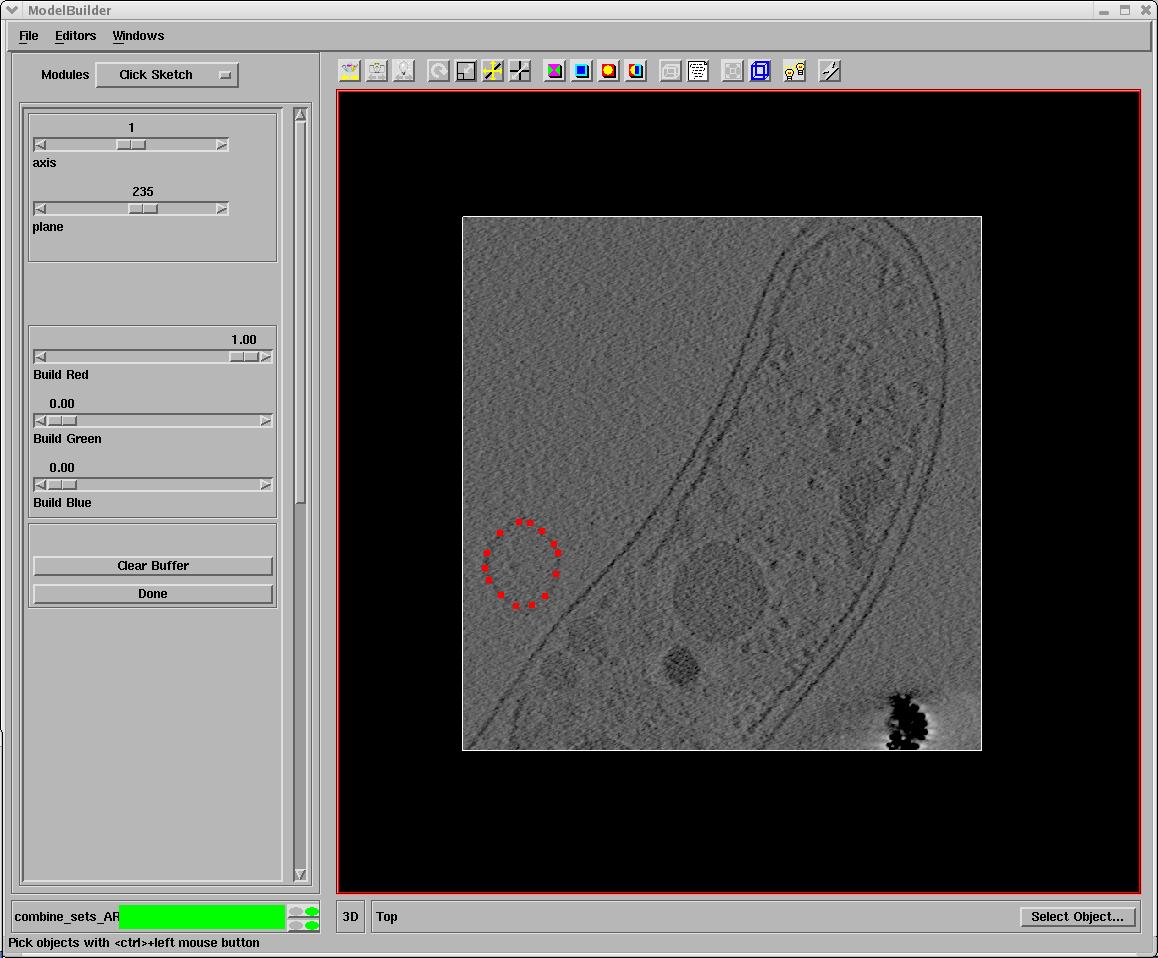
The MakeMesh interface allows a user to make closed lines. Figure 5 shows the
selected points while Figure 6 shows the closed splines.
 |
 |
|
Figure 5_a. Points selected to make a closed surface.
|
Figure 5_b. Resulting surface. |
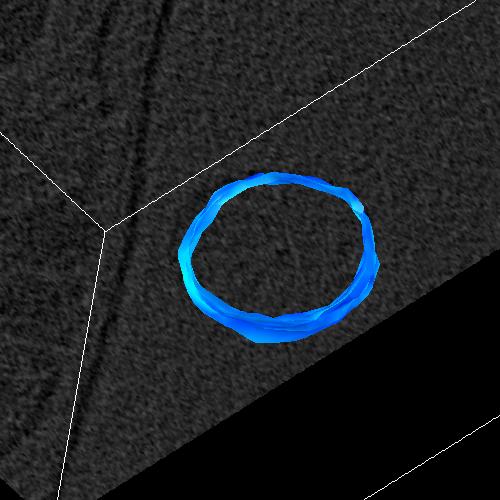
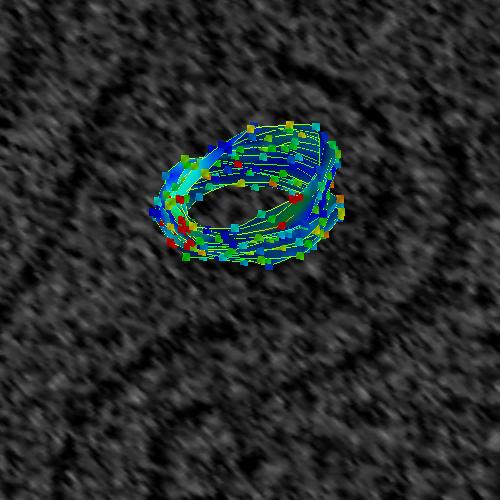
Two toggle buttons are provided to turning on and off the visibility of splines
and points. In Figure 6_a below, the splines and points are visible. In
Figure 6_b, the splines and points are off.
 |
 |
|
Figure 6_a. Splines and points are visible.
|
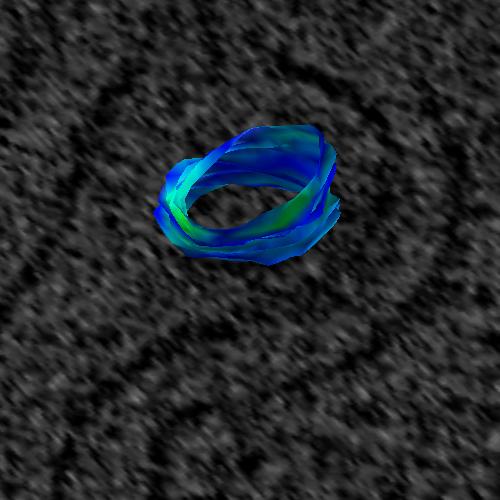
Figure 6_b. Splines and points have been toggled off, leaving only
the visible surface. |
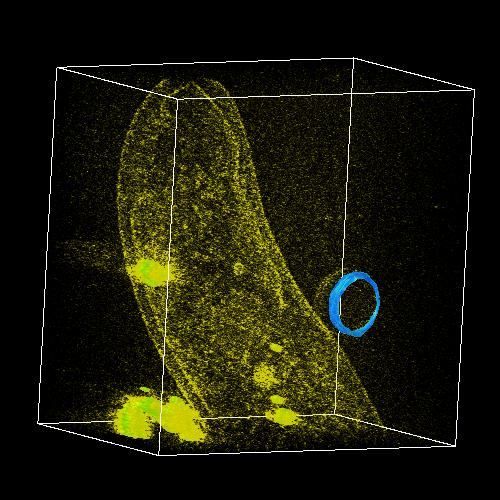
The generated surfaces and/or the splines can be saved as HDF5 files
(AVS/Express data model) for later use together with other rendering or
analysis techniques.
 |
|
Figure 7. Modeled surface and volume rendering.
|
References
[1] Electron Tomography in the Study of Bacterial Structure and Function, Kenneth H. Downing, Haixin Sui, Luis R. Comolli and Hoi-Ying Holman, Microscopy Today, submitted.