This is an archival copy of the Visualization Group's web page 1998 to 2017. For current information, please vist our group's new web page.
Visualization of Magneto-rotational instability and turbulent angular momentum transport
Table of Contents
Introduction
This project, led by by Fausto Cattaneo, University of Chicago, was awarded 2 million processor-hours to study the forces that help newly born stars and black holes increase in size. In space, gases and other matter often form swirling disks around attracting central objects such as newly formed stars. The presence of magnetic fields can cause the disks to become unstable and develop turbulence, thereby causing the disk material to fall onto the central object. This project carries out large-scale simulations to test theories on how turbulence can develop in such disks.
The visualization group worked with the researchers to visualize the results of their simulations.
First Light
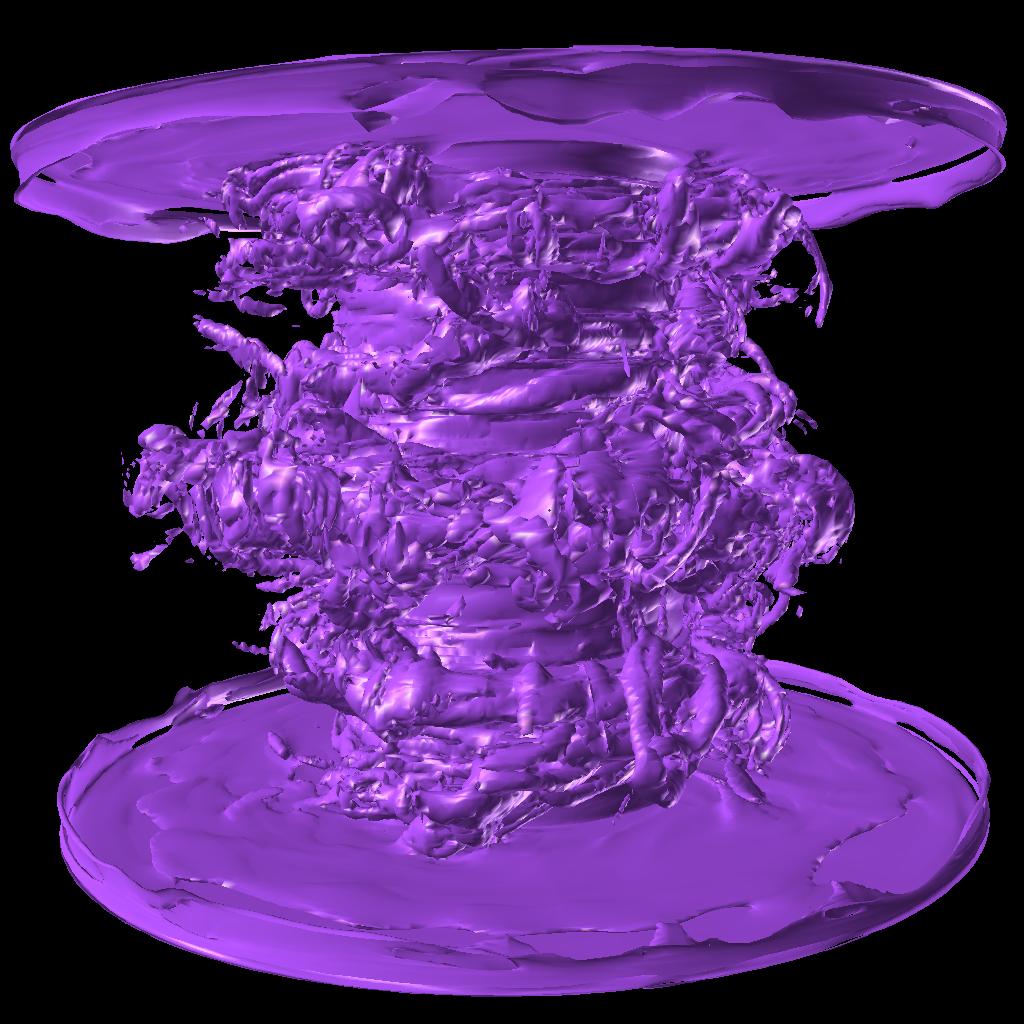
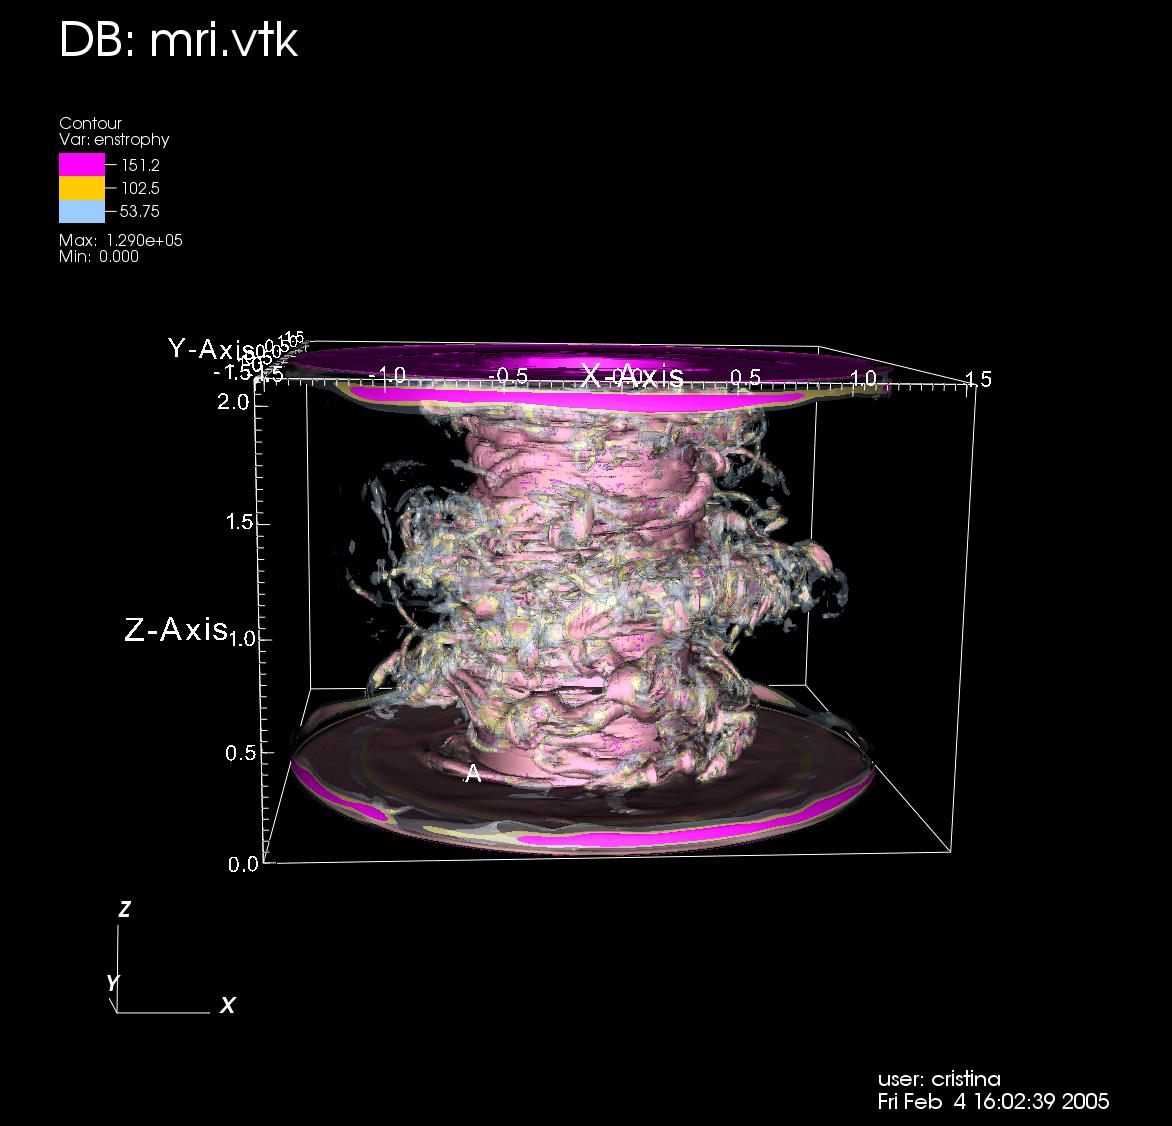
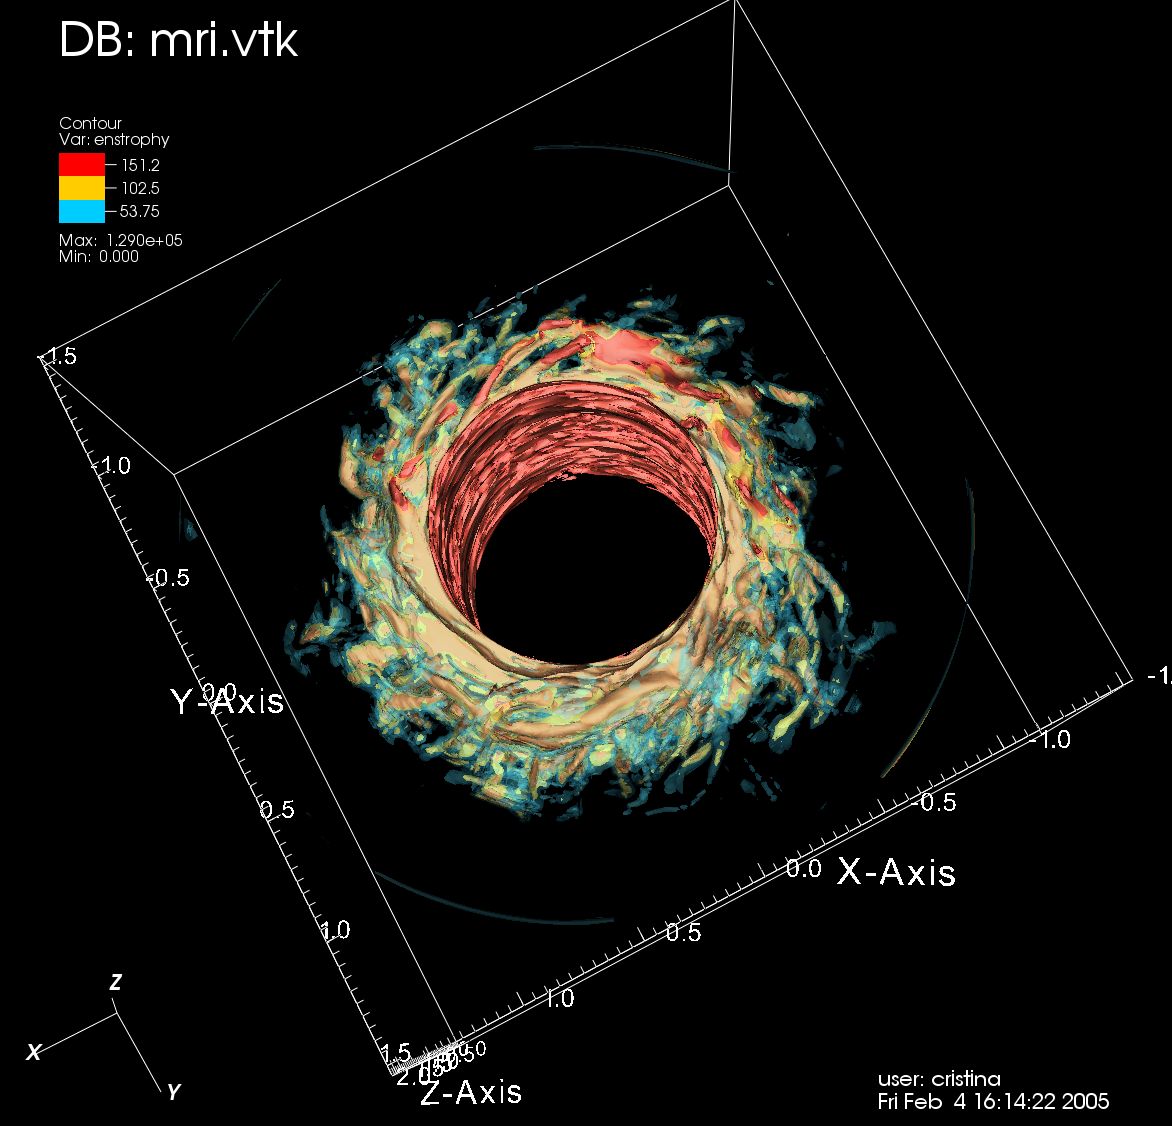
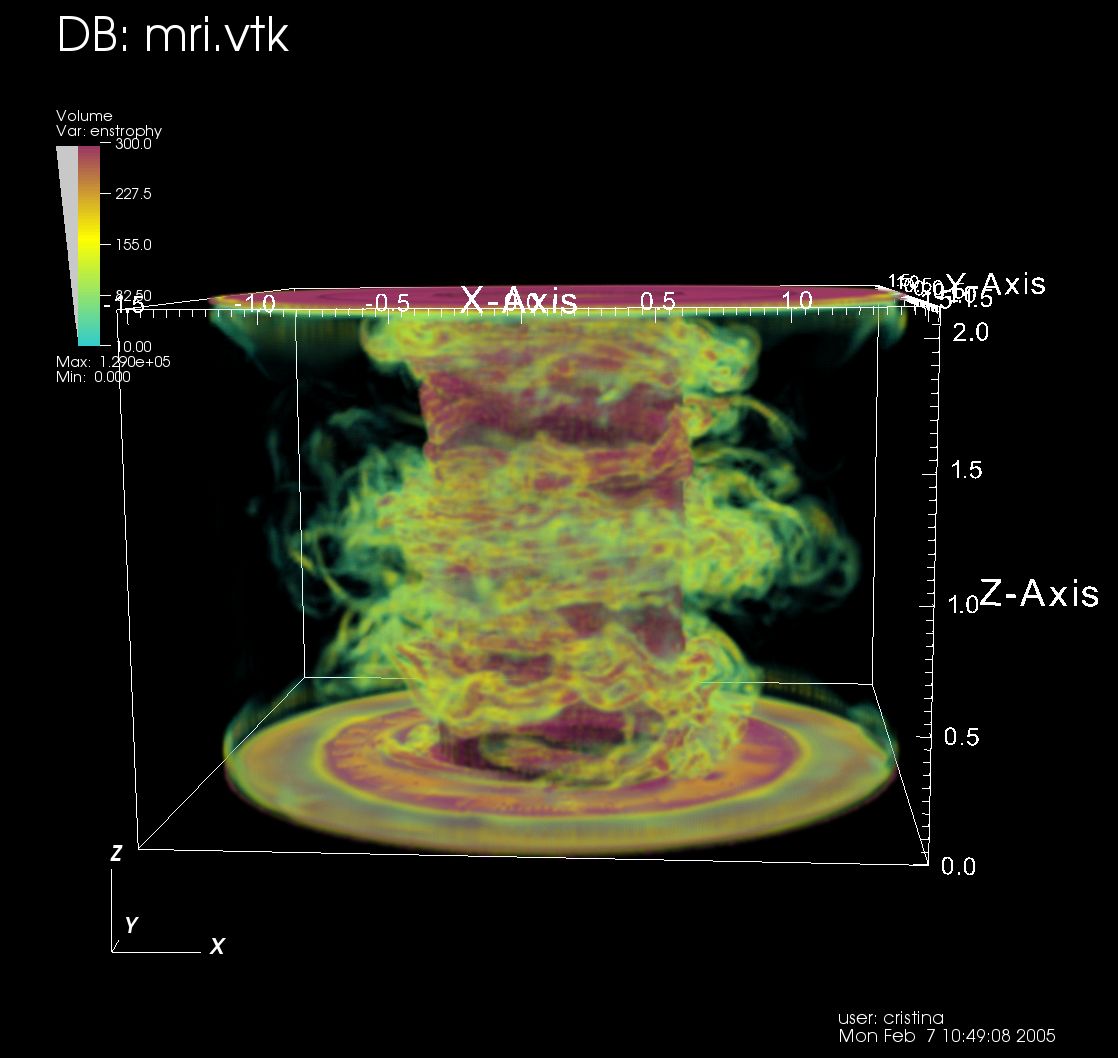
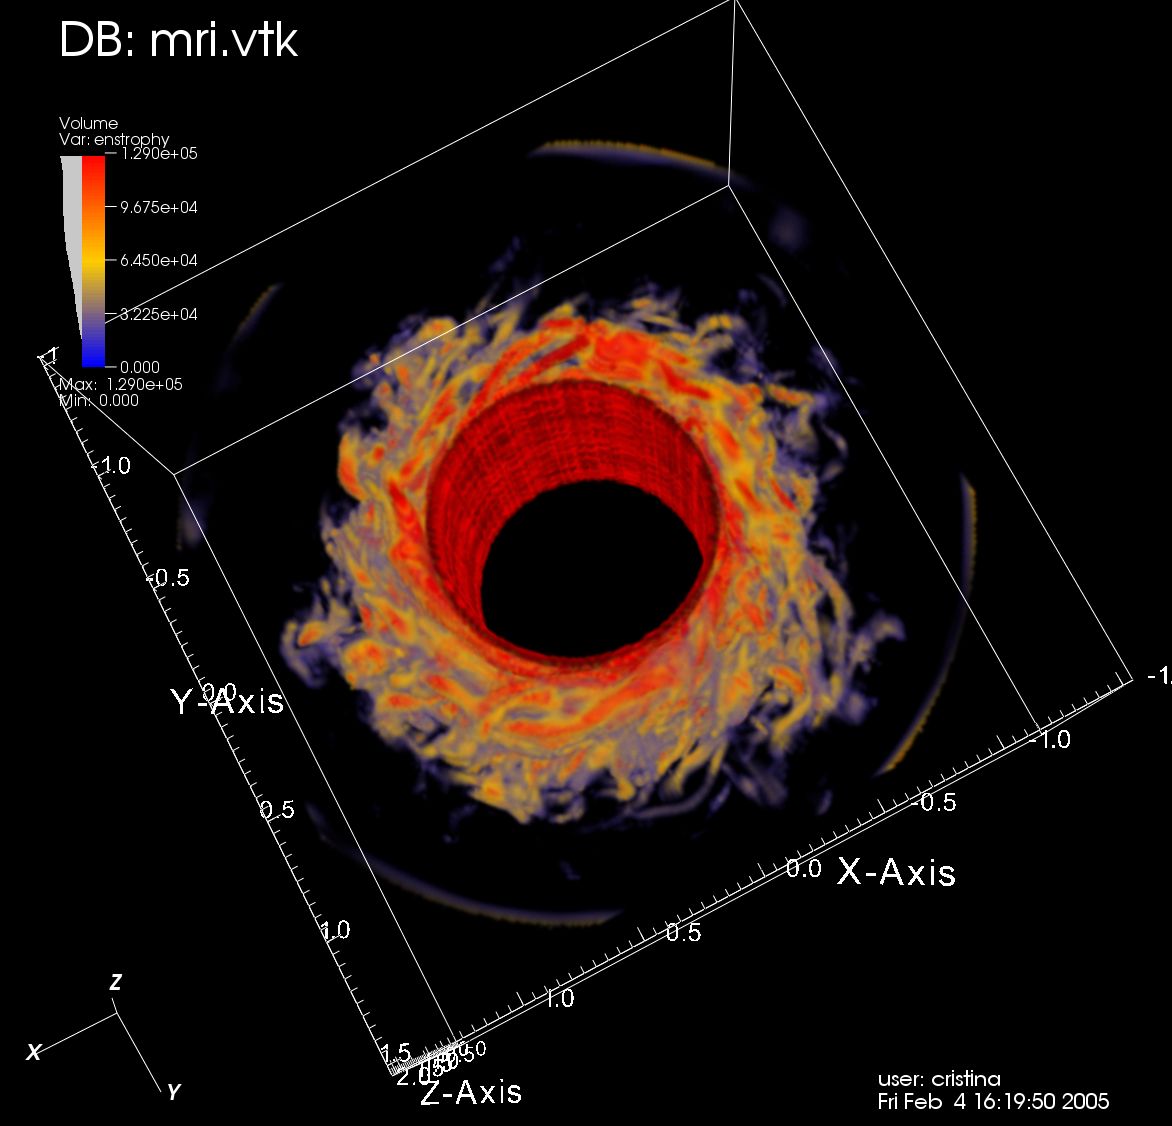
As a first step we tried different visualization techniques and different visualization applications to see which one was best for the data. Figure 1 shows isosurfaces and volume renderings of enstrophy using AVS/Express(http://www.avs.com). For the volume rendering the data was interpolated to a uniform mesh and converted to byte. Figure 2 shows similar views using VisIt (http://www.llnl.gov/visit) which support volume rendering of unstructured meshes.
|
|
| Isosurface of the cylindrical Hexahedral mesh. | Nested Isosurfaces of the cylindrical Hexahedral mesh. |
|
|
| Volume rendering of an interpolation to a uniform mesh. | Volume rendering of an interpolation to a uniform mesh. |
|
|
| Isosurface of the cylindrical Hexahedral mesh. | Nested Isosurfaces of the cylindrical Hexahedral mesh. |
|
|
| Volume rendering of the cylindrical Hexahedral mesh. | Volume rendering of the cylindrical Hexahedral mesh . |
3D Visualization of the magnetic and hydro flux
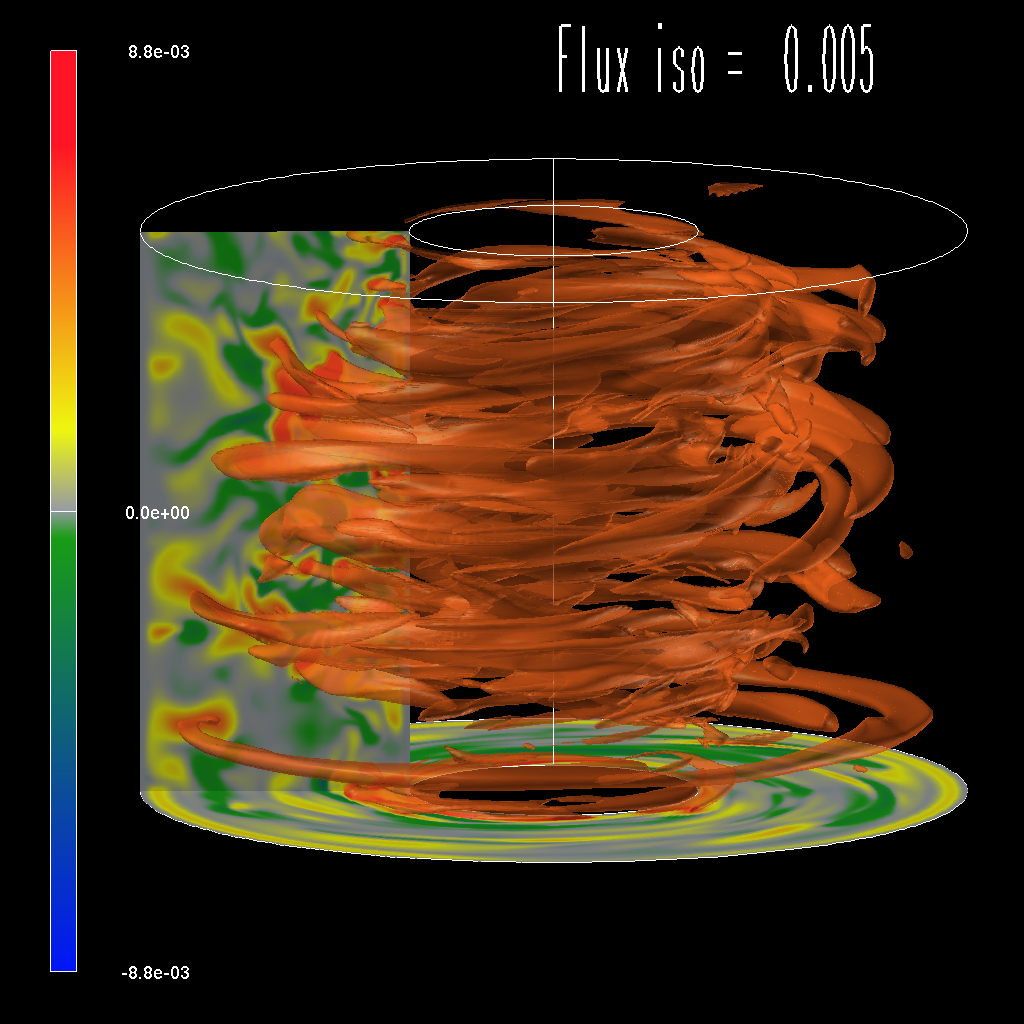
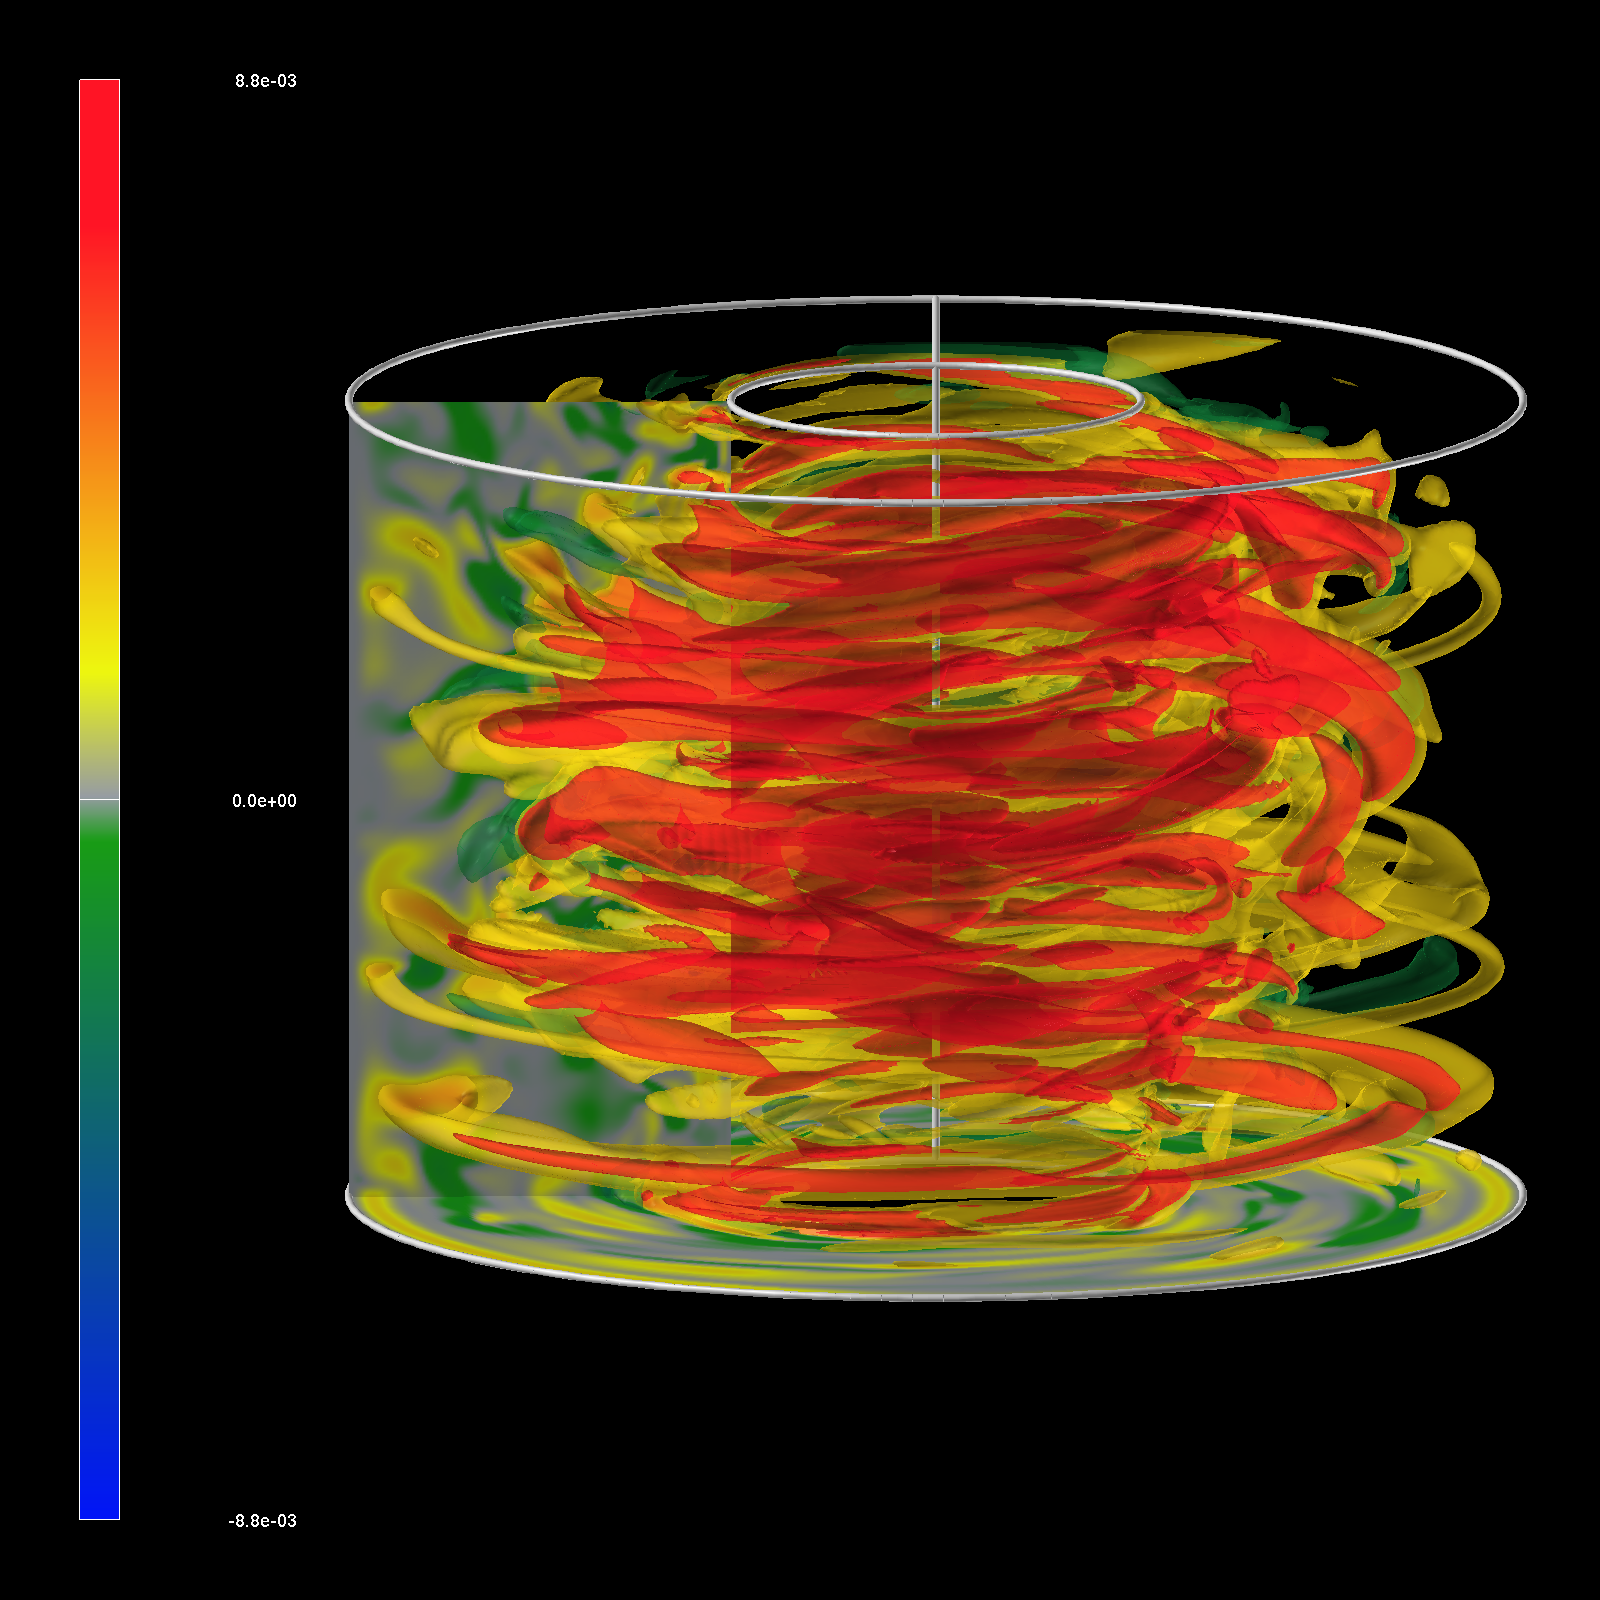
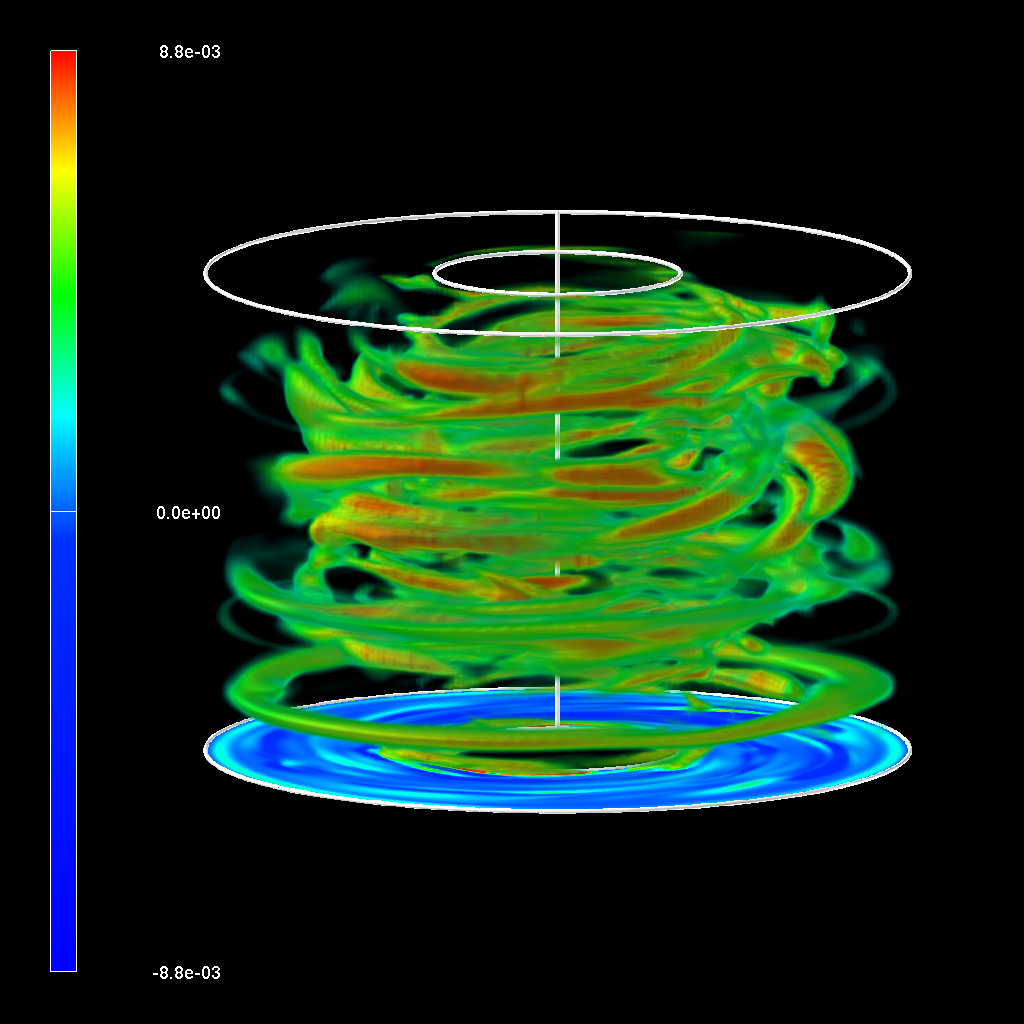
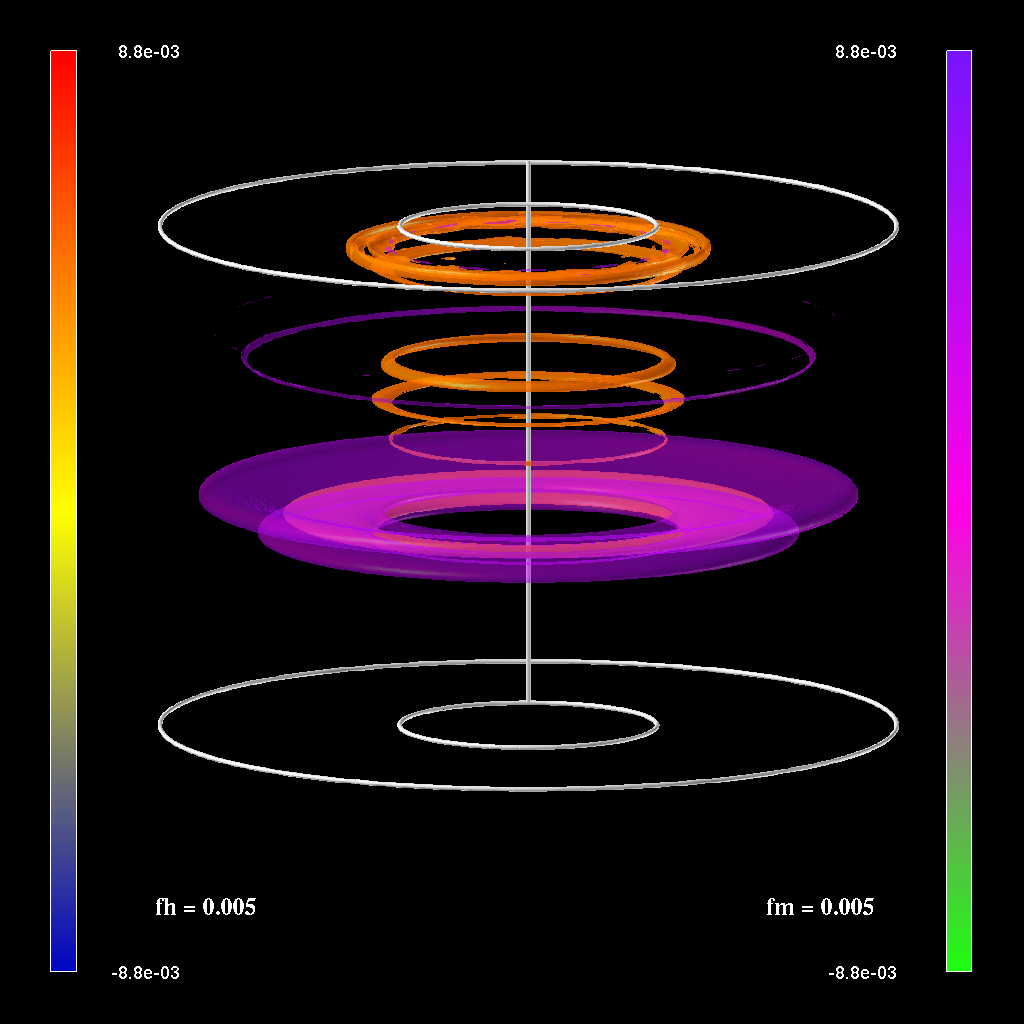
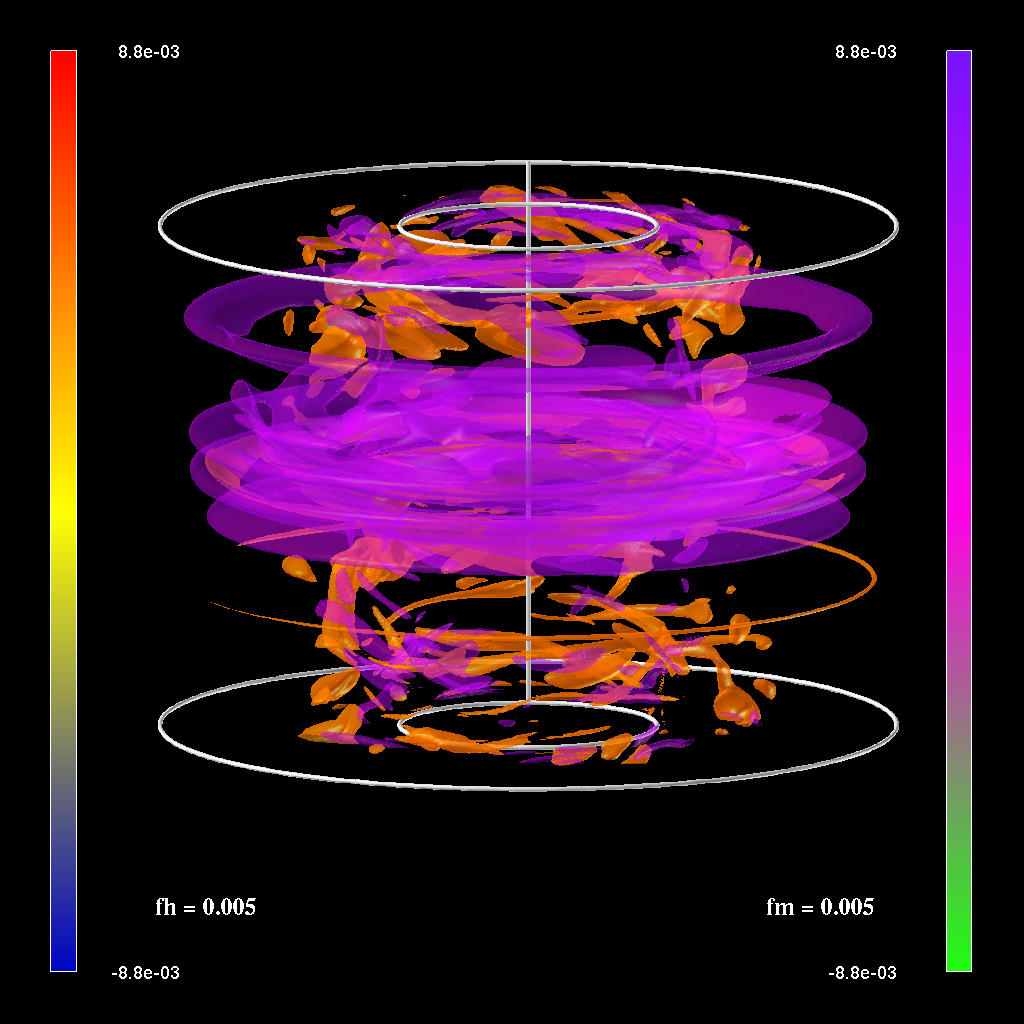
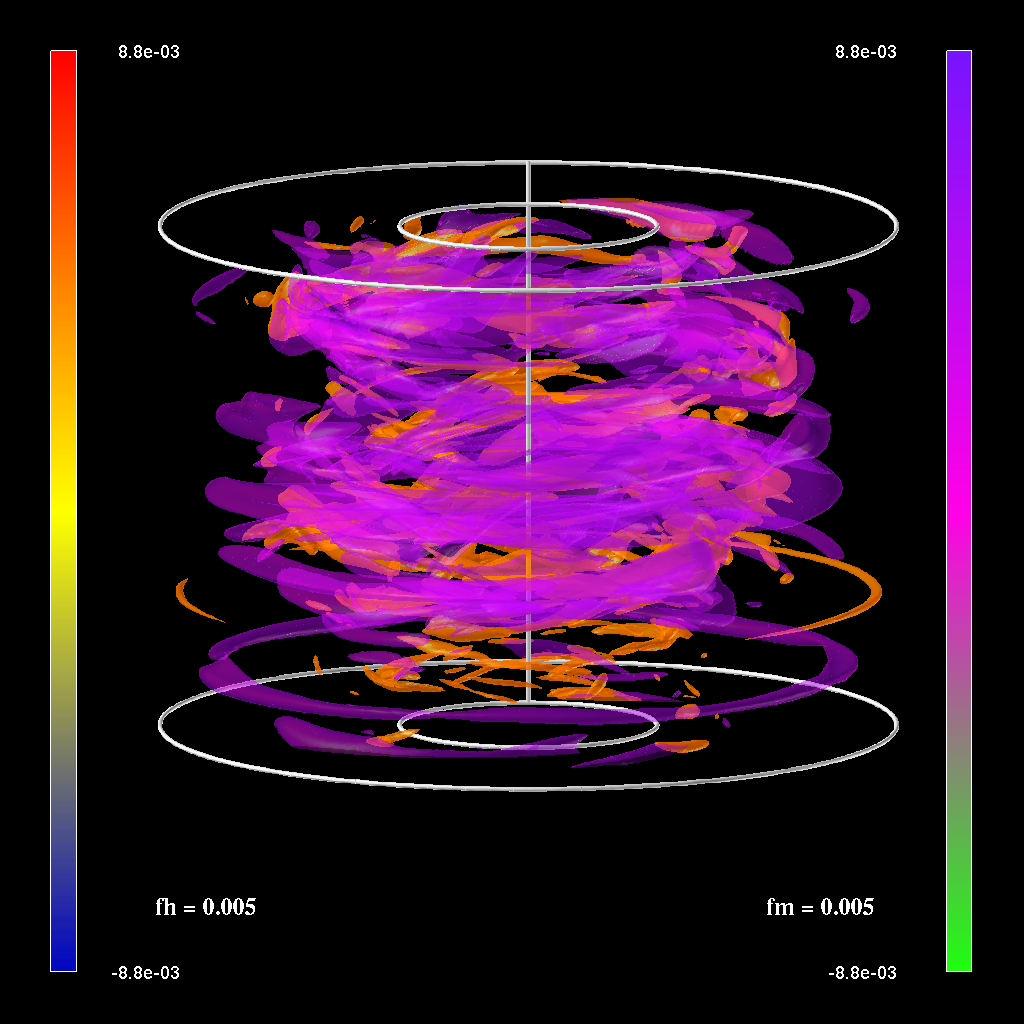
We made several renderings of the time evolution of the total advective radial flux of axial angular momentum and for the hydro and magnetic flux. Figures 3 and 4 shows the results.
|
|
|
| Movie of the time evolution of the 0.005 isosurface(~34M) | Movie of the time evolution of nested isosurfaces (-0.002, 0.0025, 0.007) (~30M) | Movie of the time evolution of a volume rendering(~12M) |
|
|
|
| Time evolution movie (~36M) |
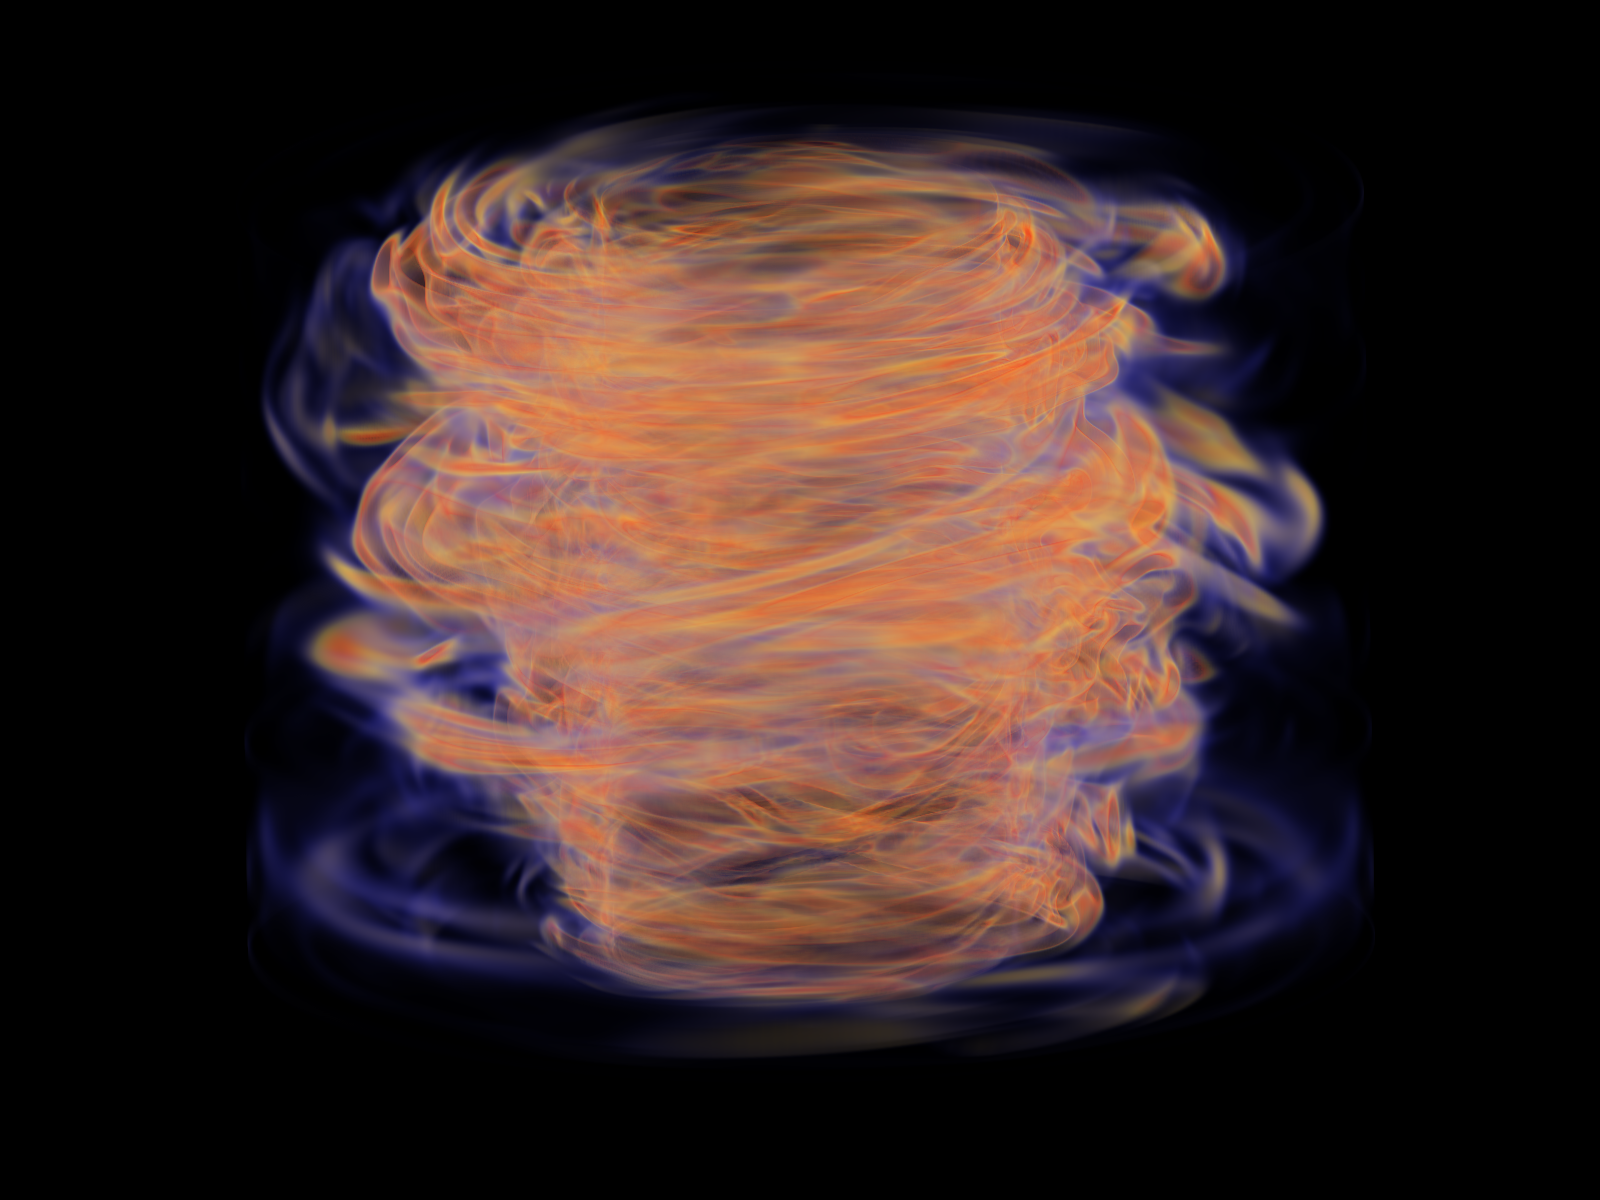
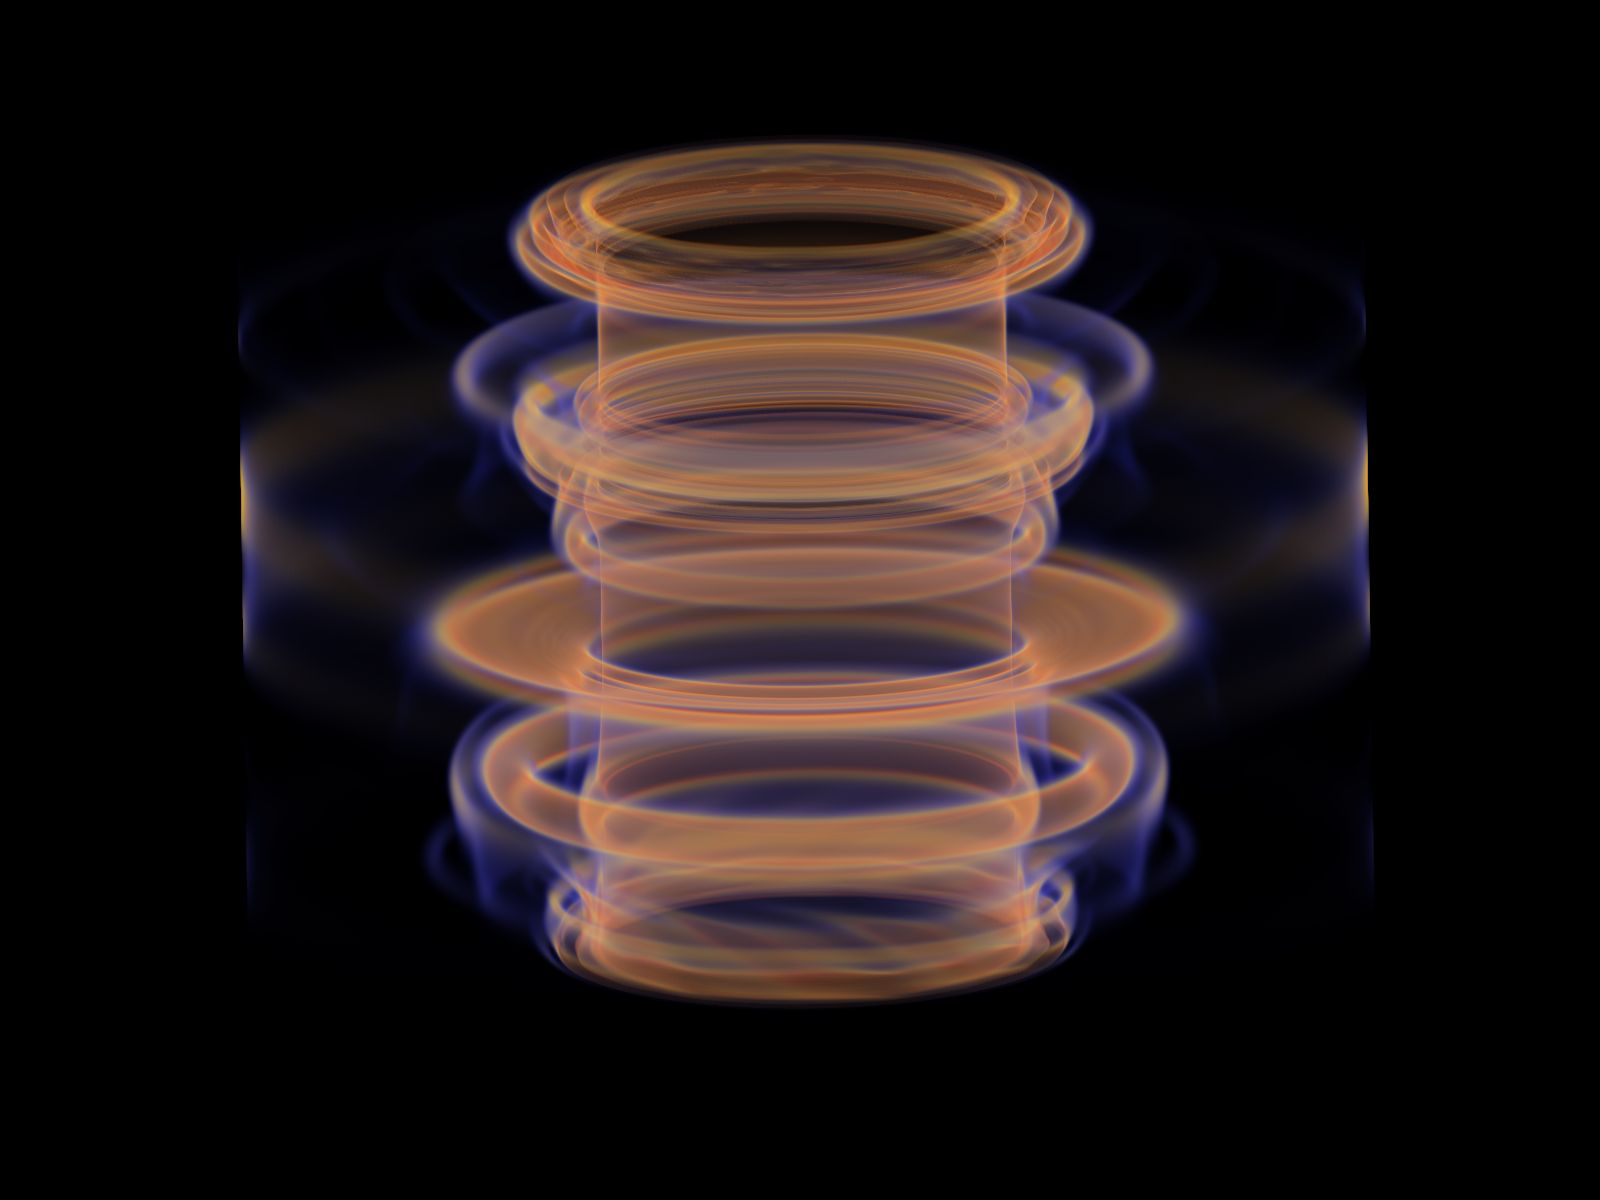
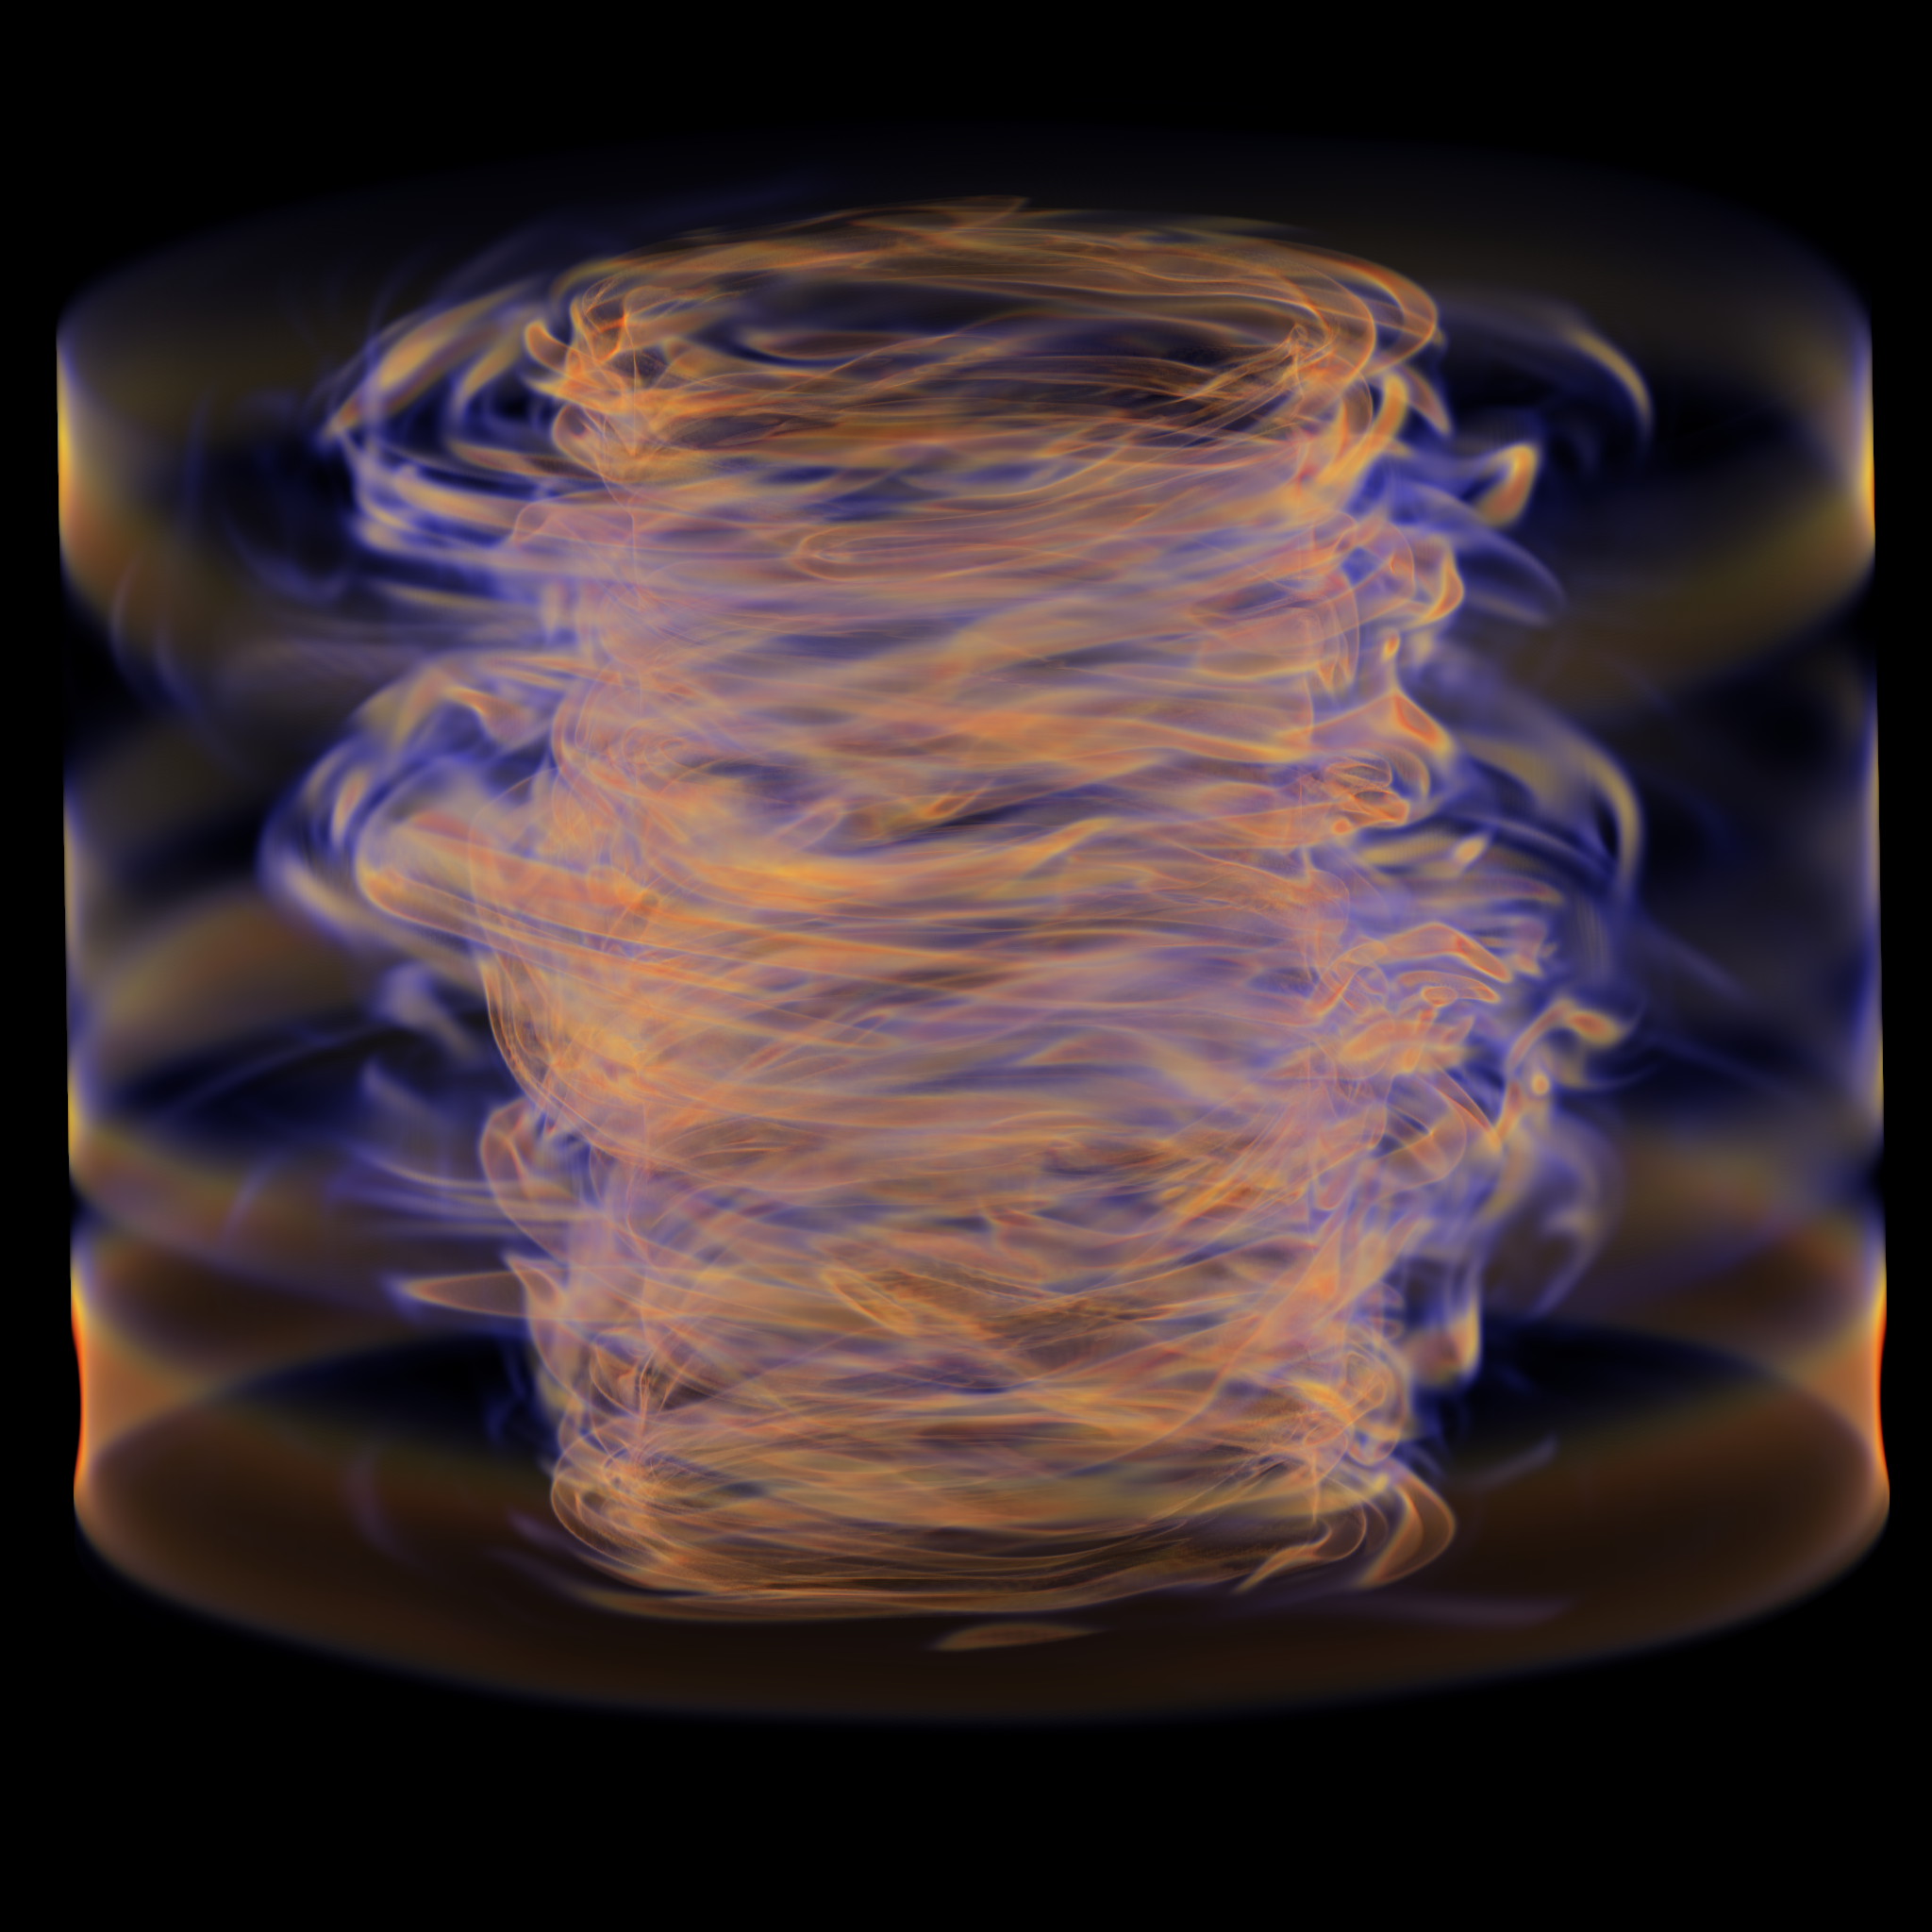
3D Visualization of the magnetic and hydro enstrophy
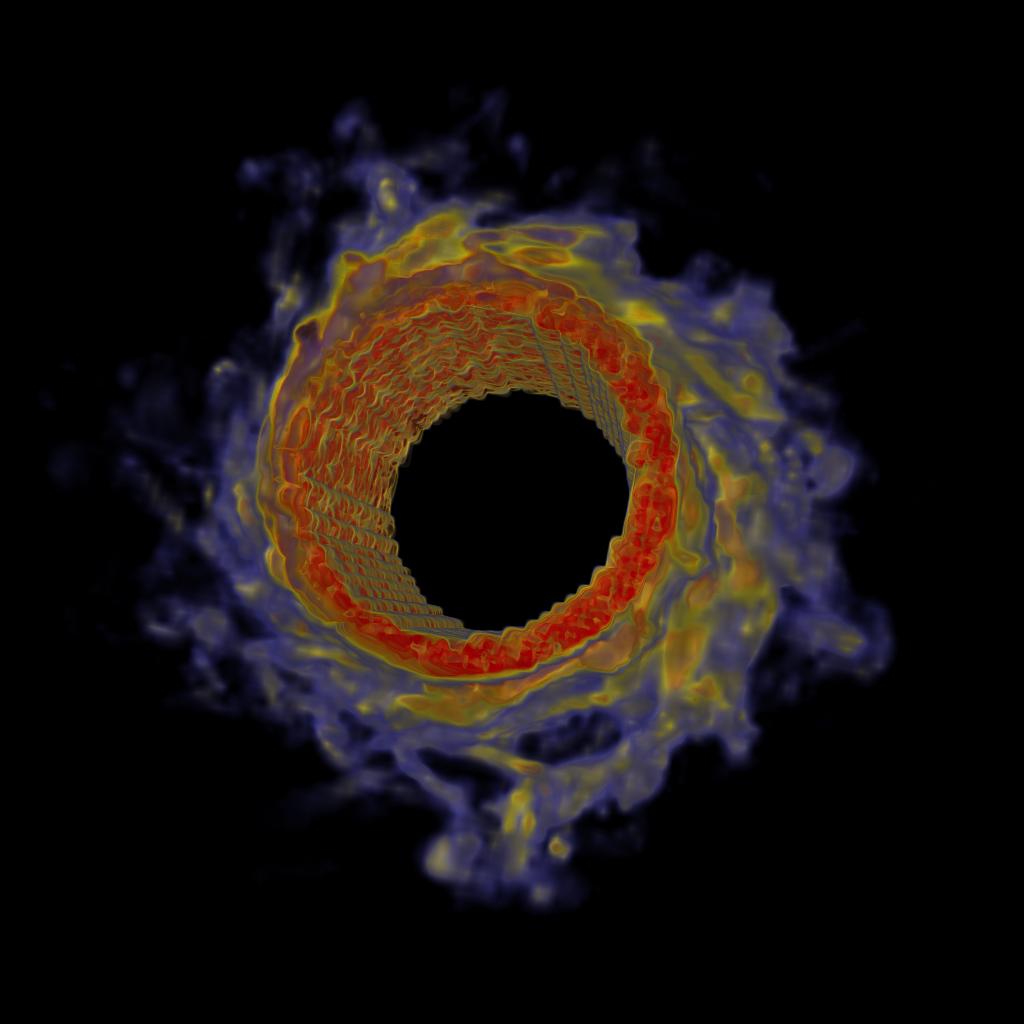
We used VisIt to visualize the magnetic and the hydro enstrophy. We chose VisIt to do the rendering in the original cylindrical mesh. Figure 5. shows the hydro-enstrophy volume rendering of steps 0 and 400. Click in the link to see a time evolution movie.
|

|
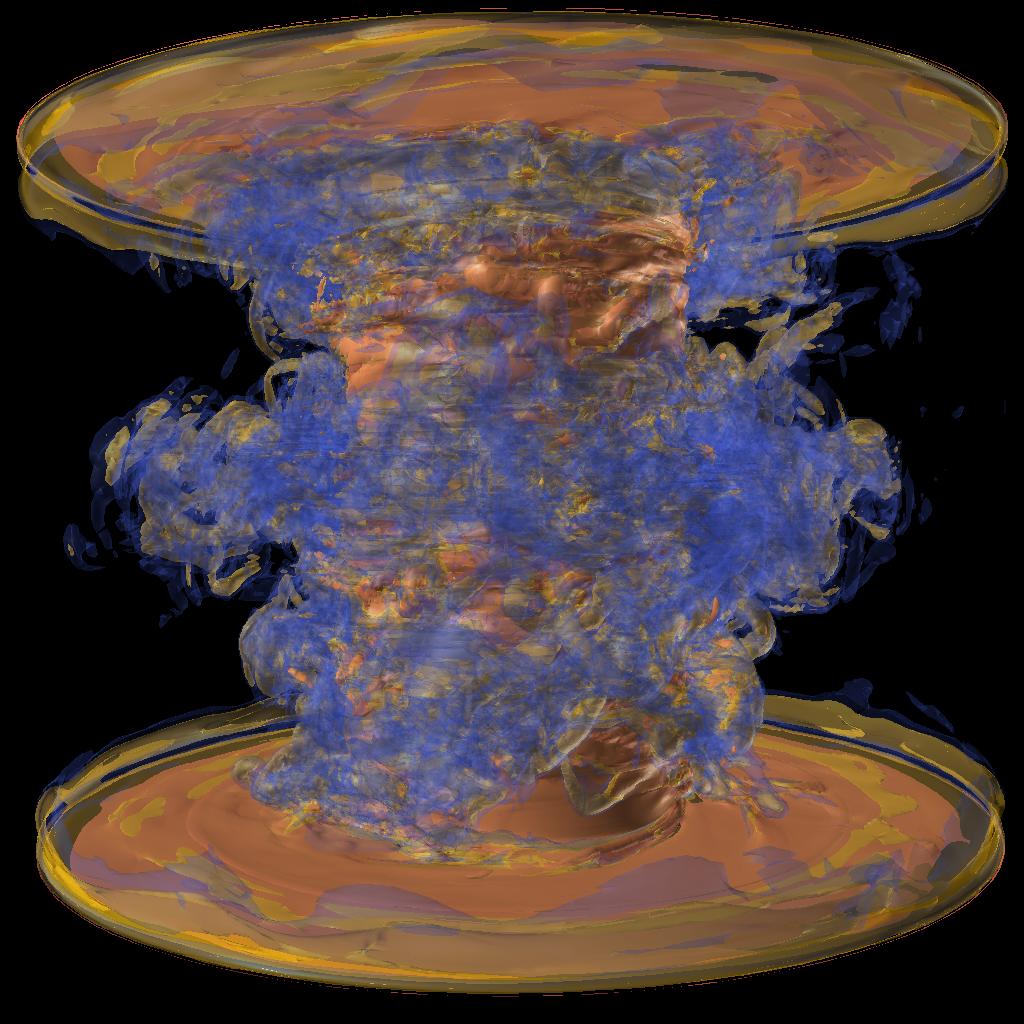
We used different colormaps and transfer functions to render the interesting features of the data. Figure 6. shows the magnetic-enstrophy volume rendering for steps 0 and 400. Click in the link to see a time evolution movie.
|
|
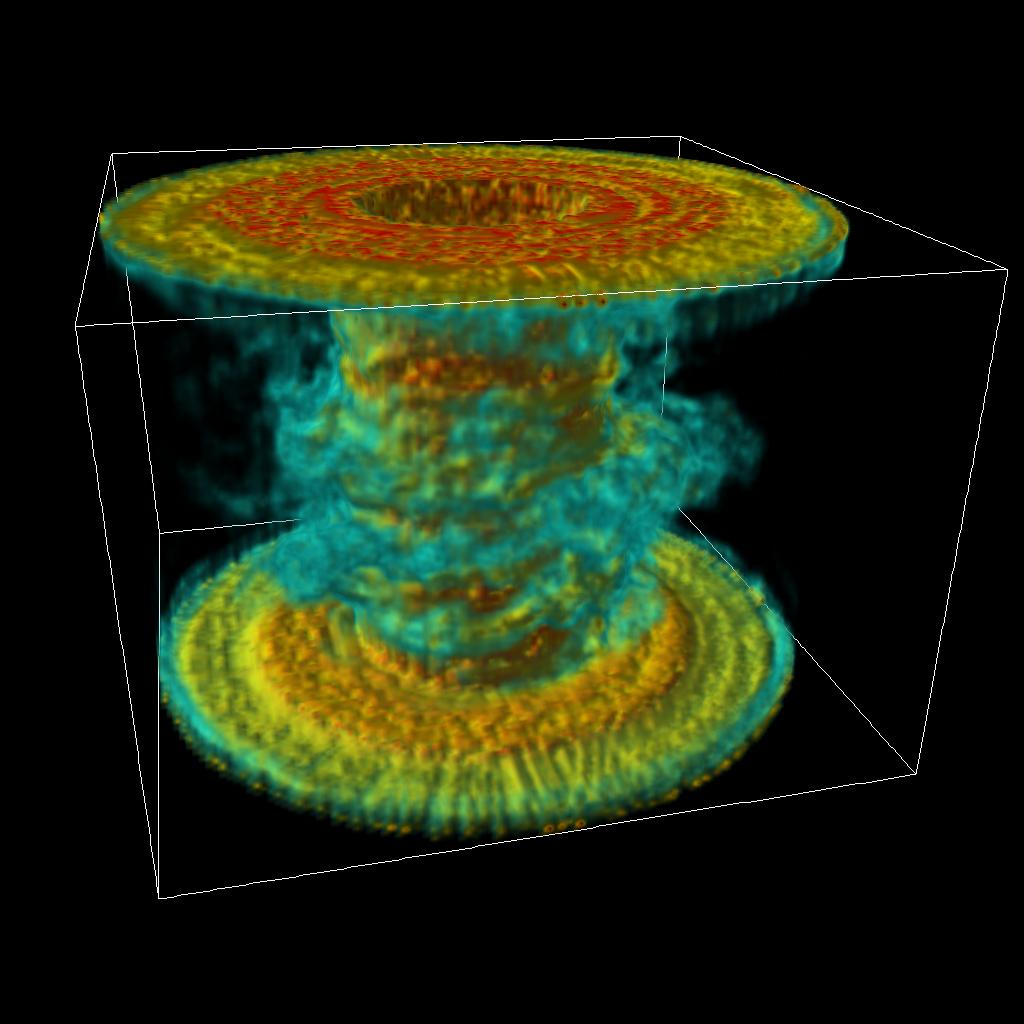
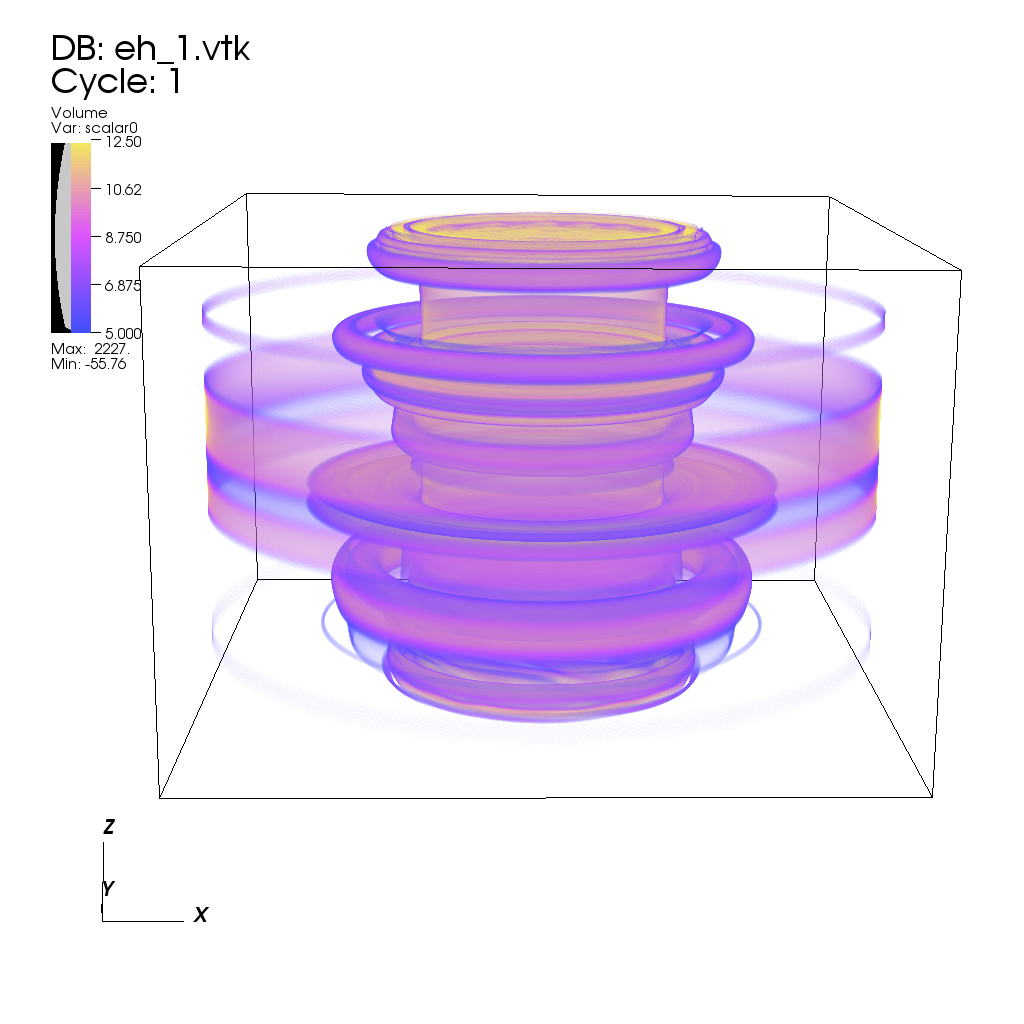
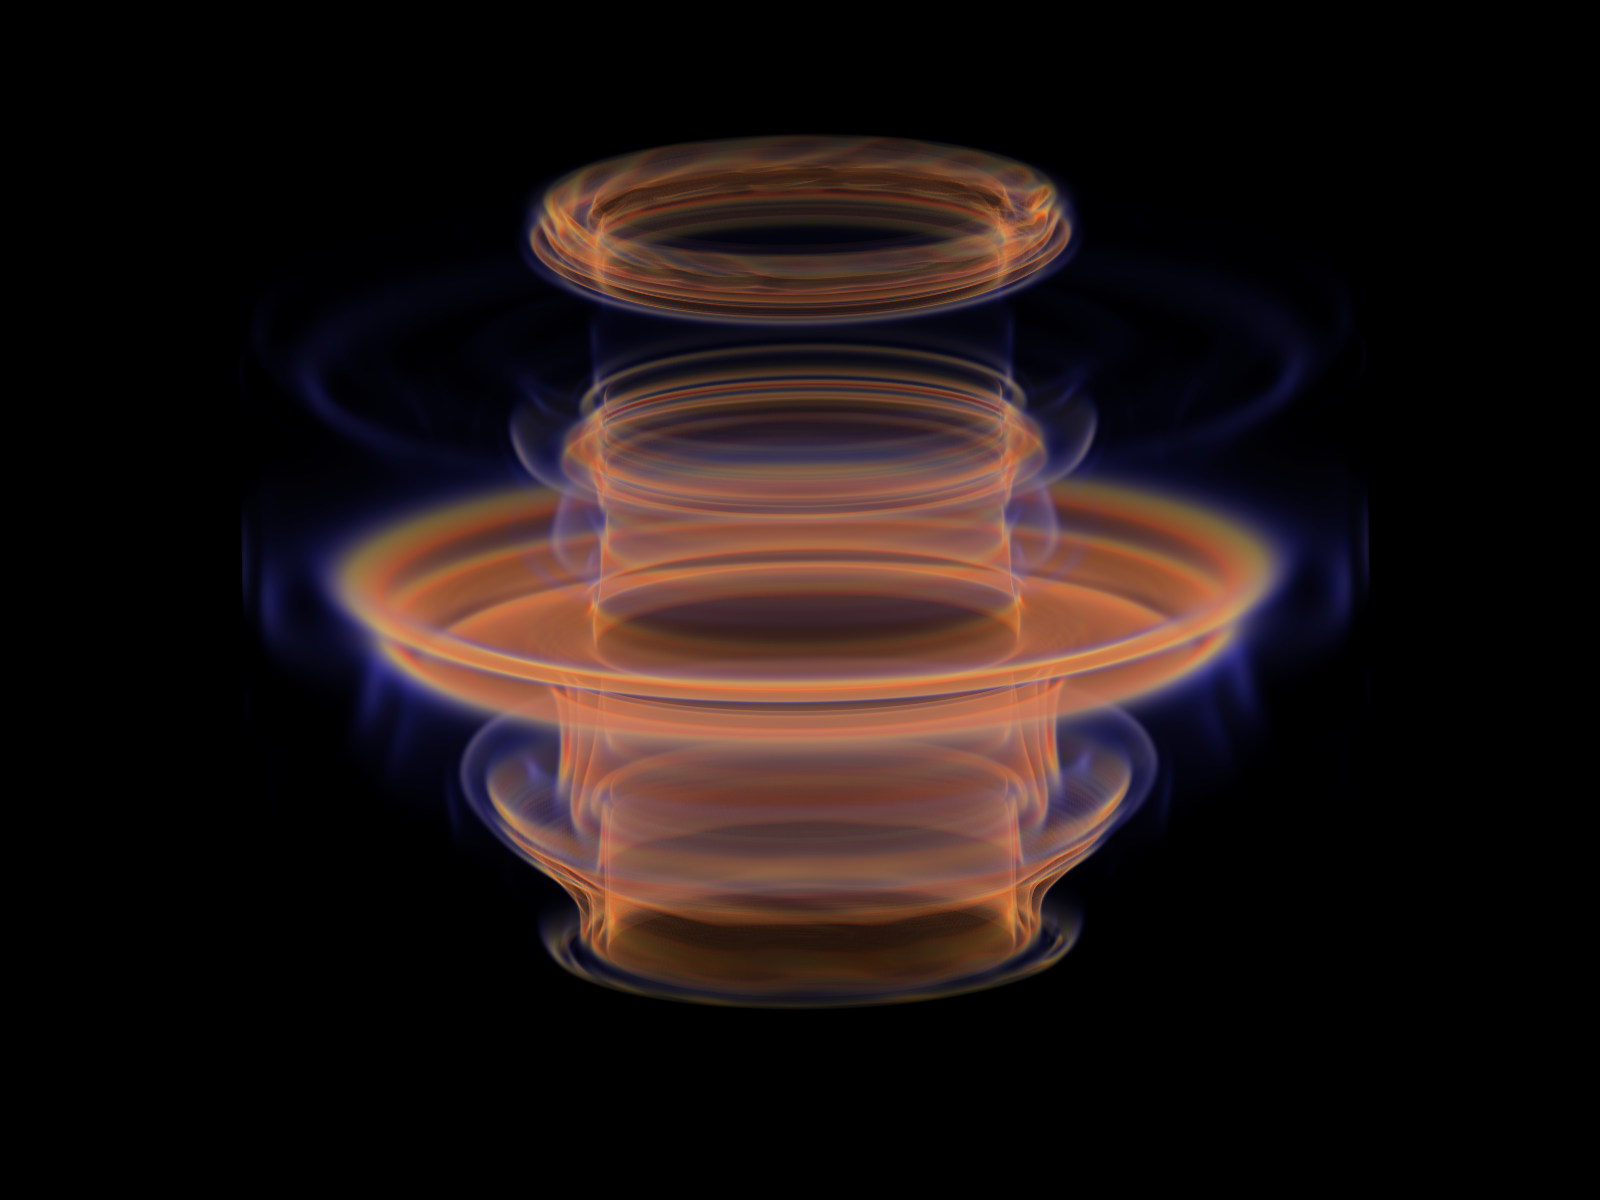
With a similar colormap we rendered the hydro-enstrophy. Figure 7. shows the volume rendering of eh for steps 0 and 400. Click in the link to see a time evolution movie.
|

|
High Resolution images of the hydro enstrophy (eh)
| enstrophy 2048x2048 |
| flux 2048x2048 |
References
MHD computations by F. Cattaneo, P. Fischer and A. Obabko on NERSC resources supported by DOE under Contract No. DE-AC03-76SF00098