Tutorial 1: Loading your dataset and simple interactions
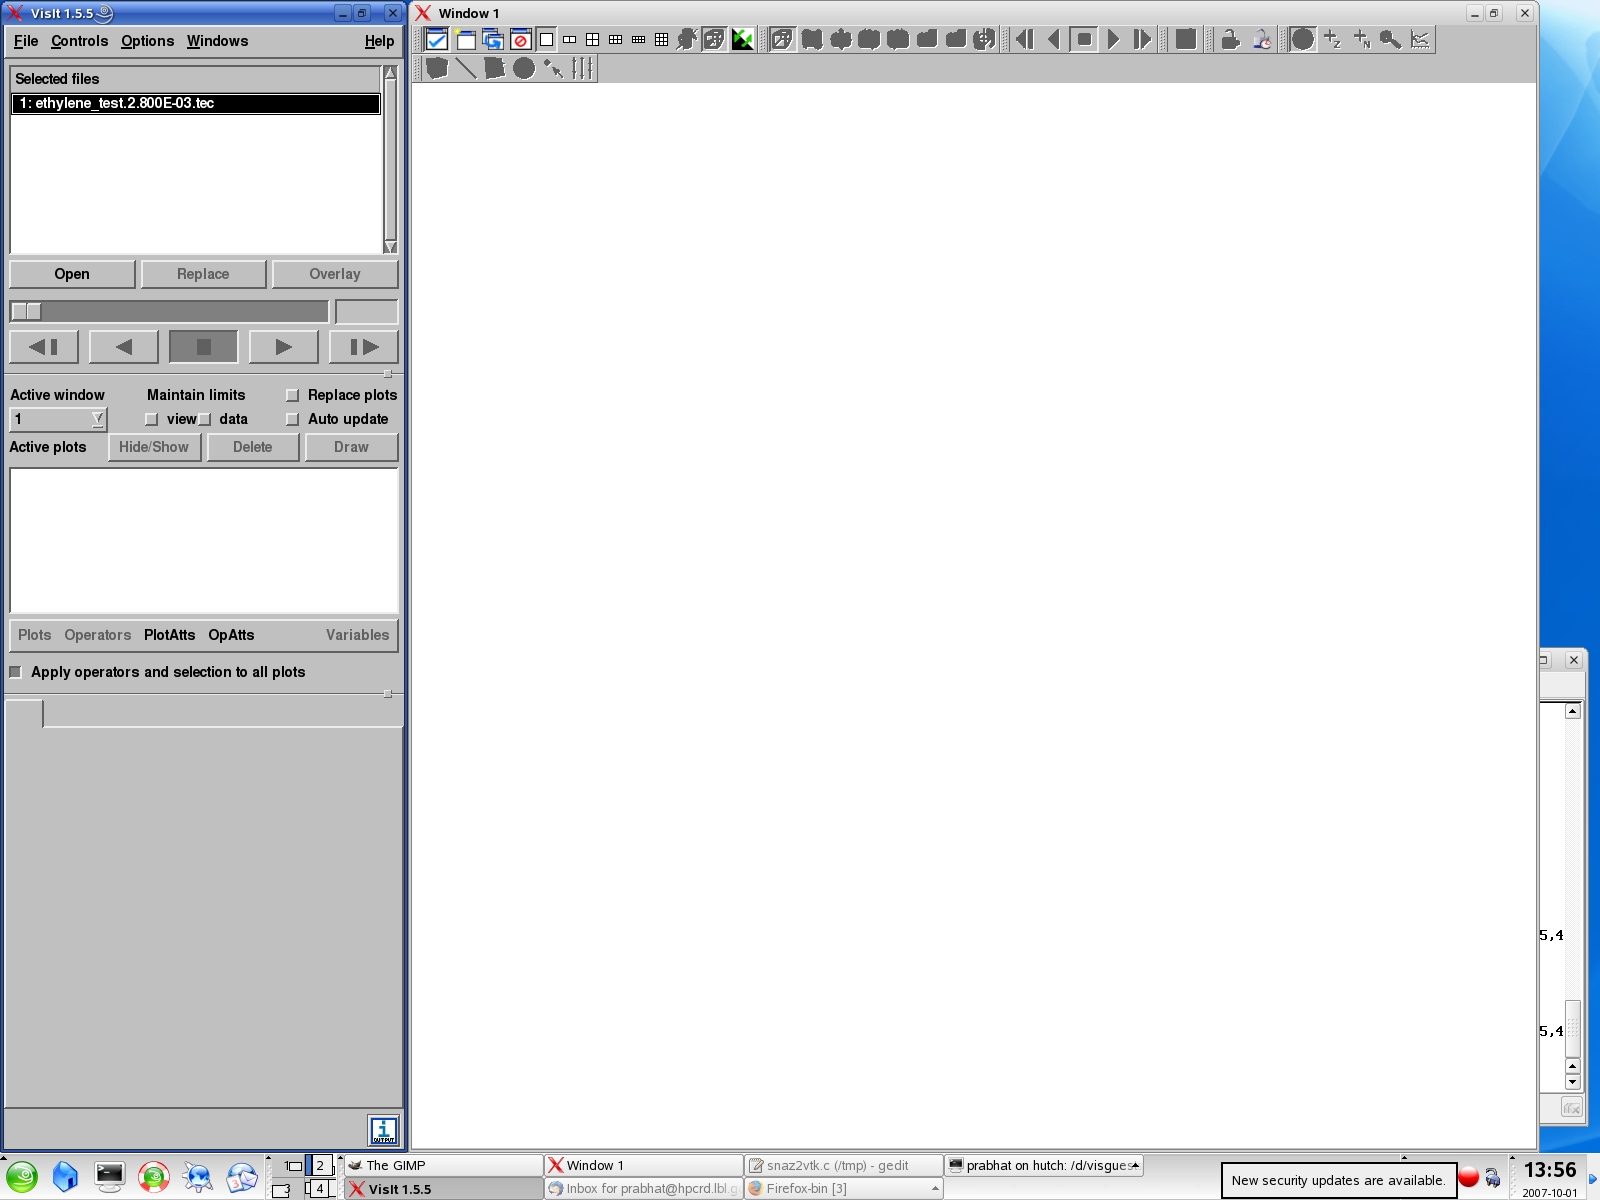
Open your tecplot file by going to the File->Open Menu.
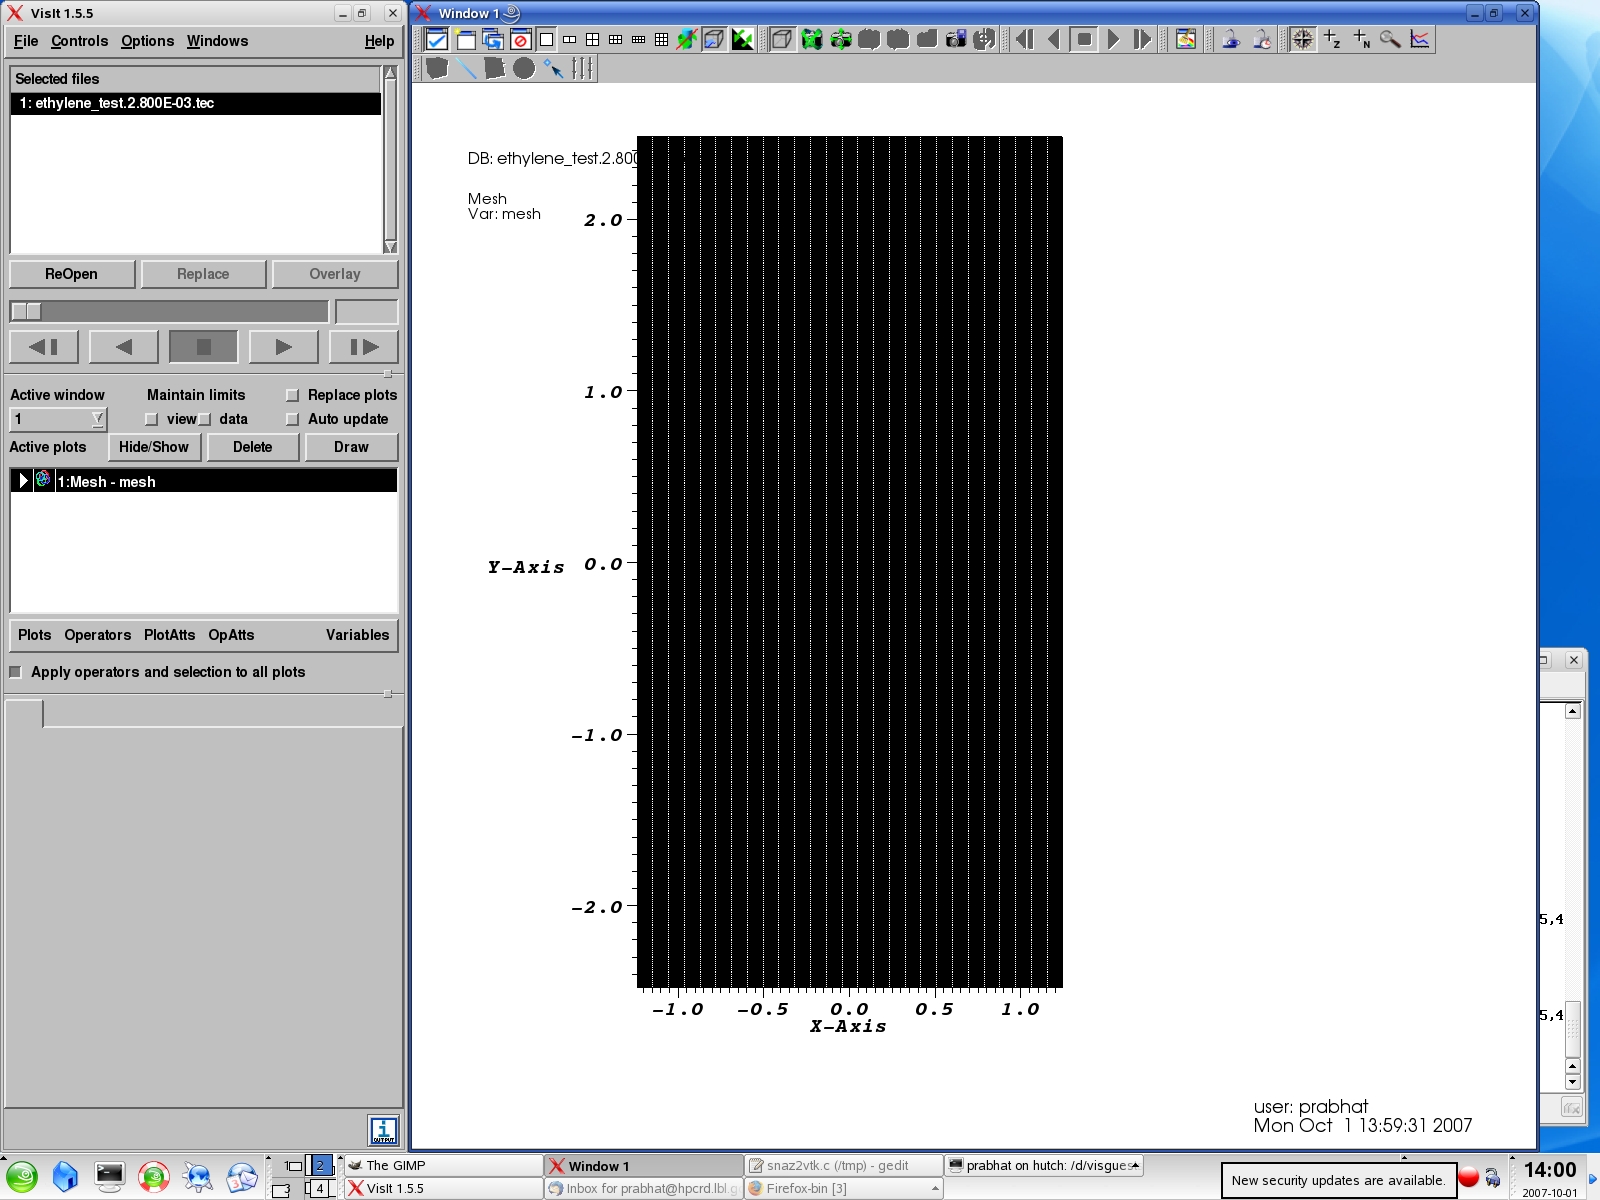
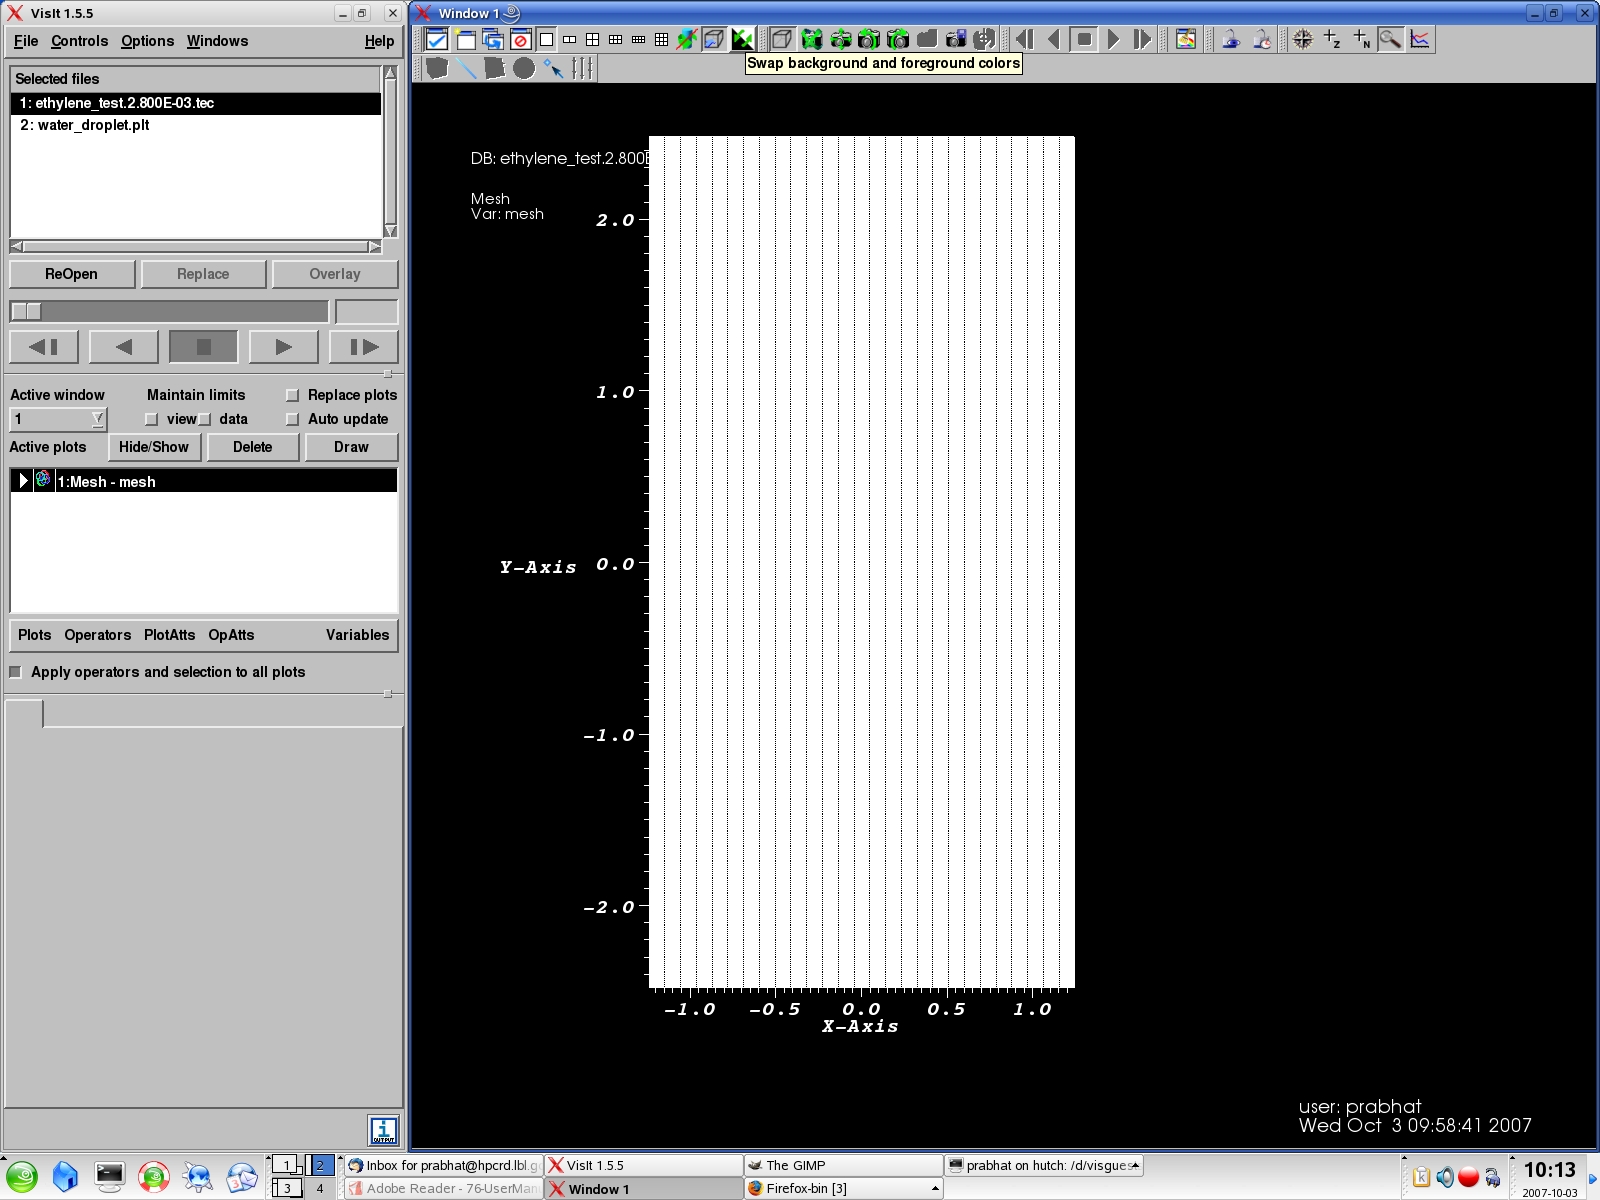
You can plot the computational Mesh by choosing Plot->Mesh. Note that it appears as solid black due to the density of the mesh.
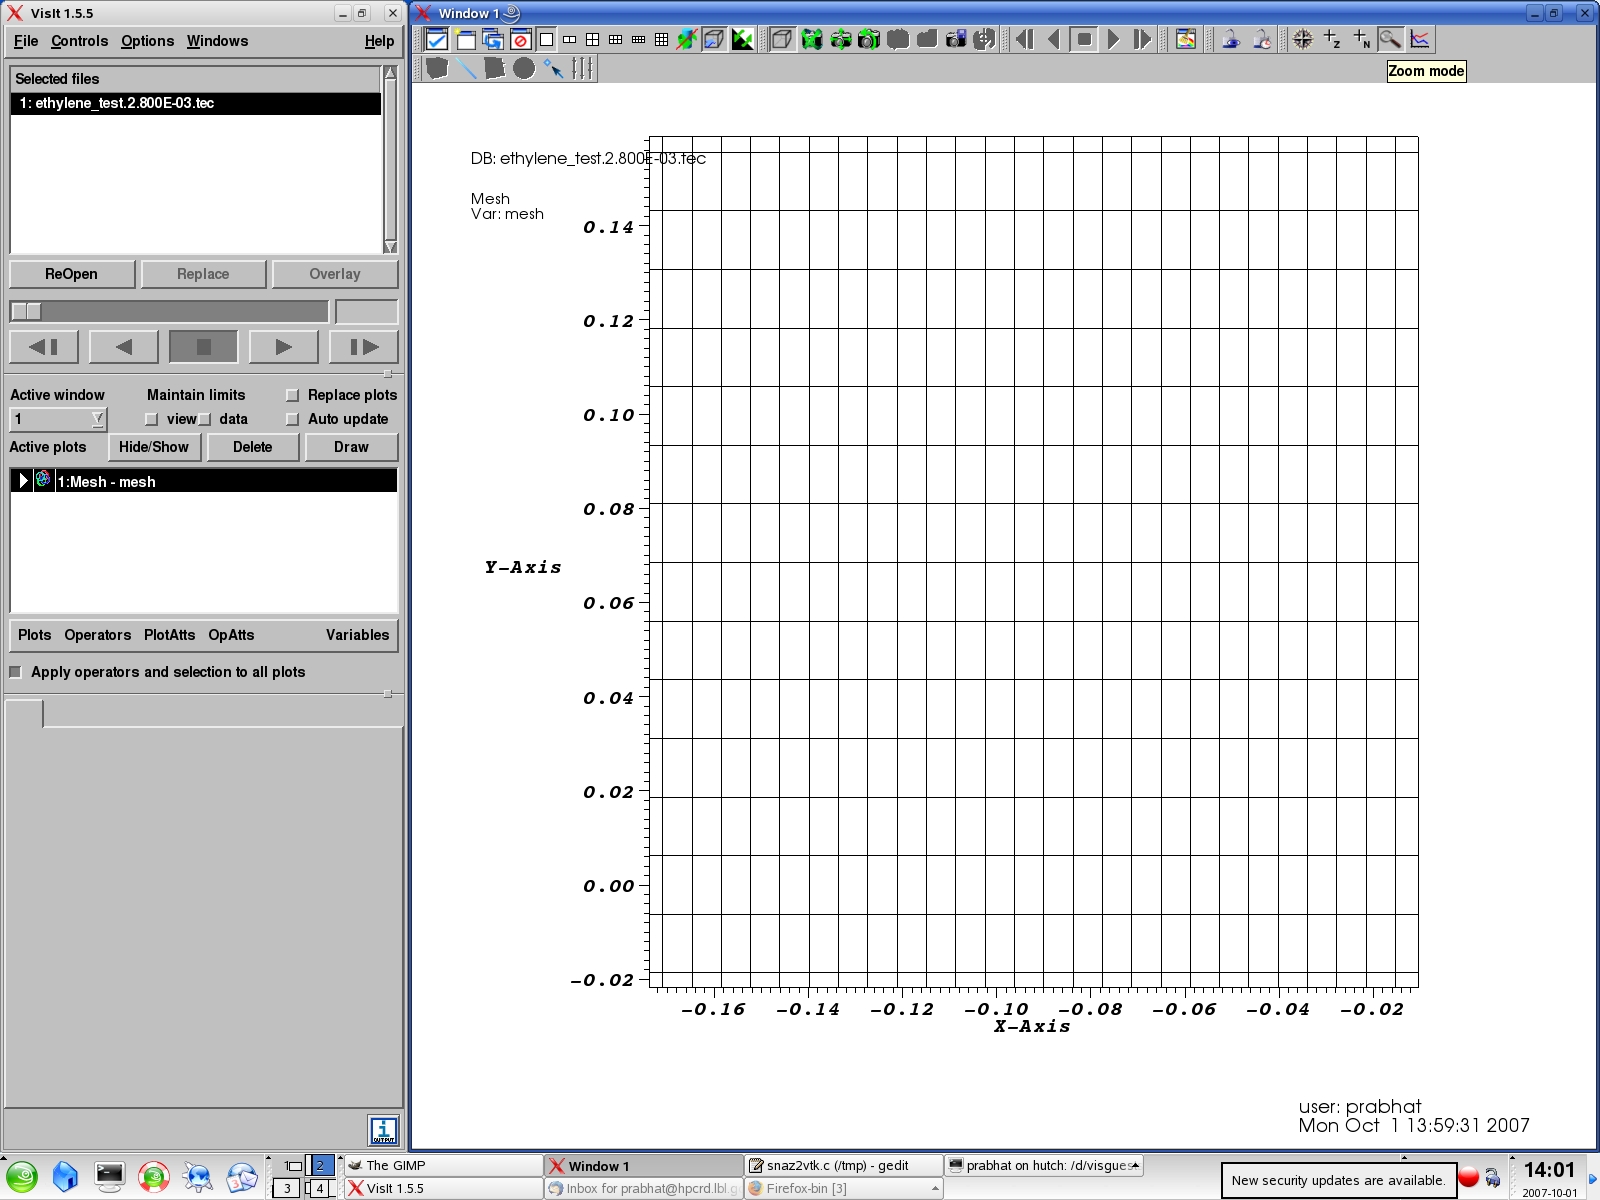
Use the Zoom interaction (near top-right corner) drag out a rectangle and zoom into the mesh. You should be able to resolve individual cells. Use the Navigate mode (compass icon); you should now be able to move the plot by dragging with your left mouse button. Note that the compass mode is the default navigation mode.
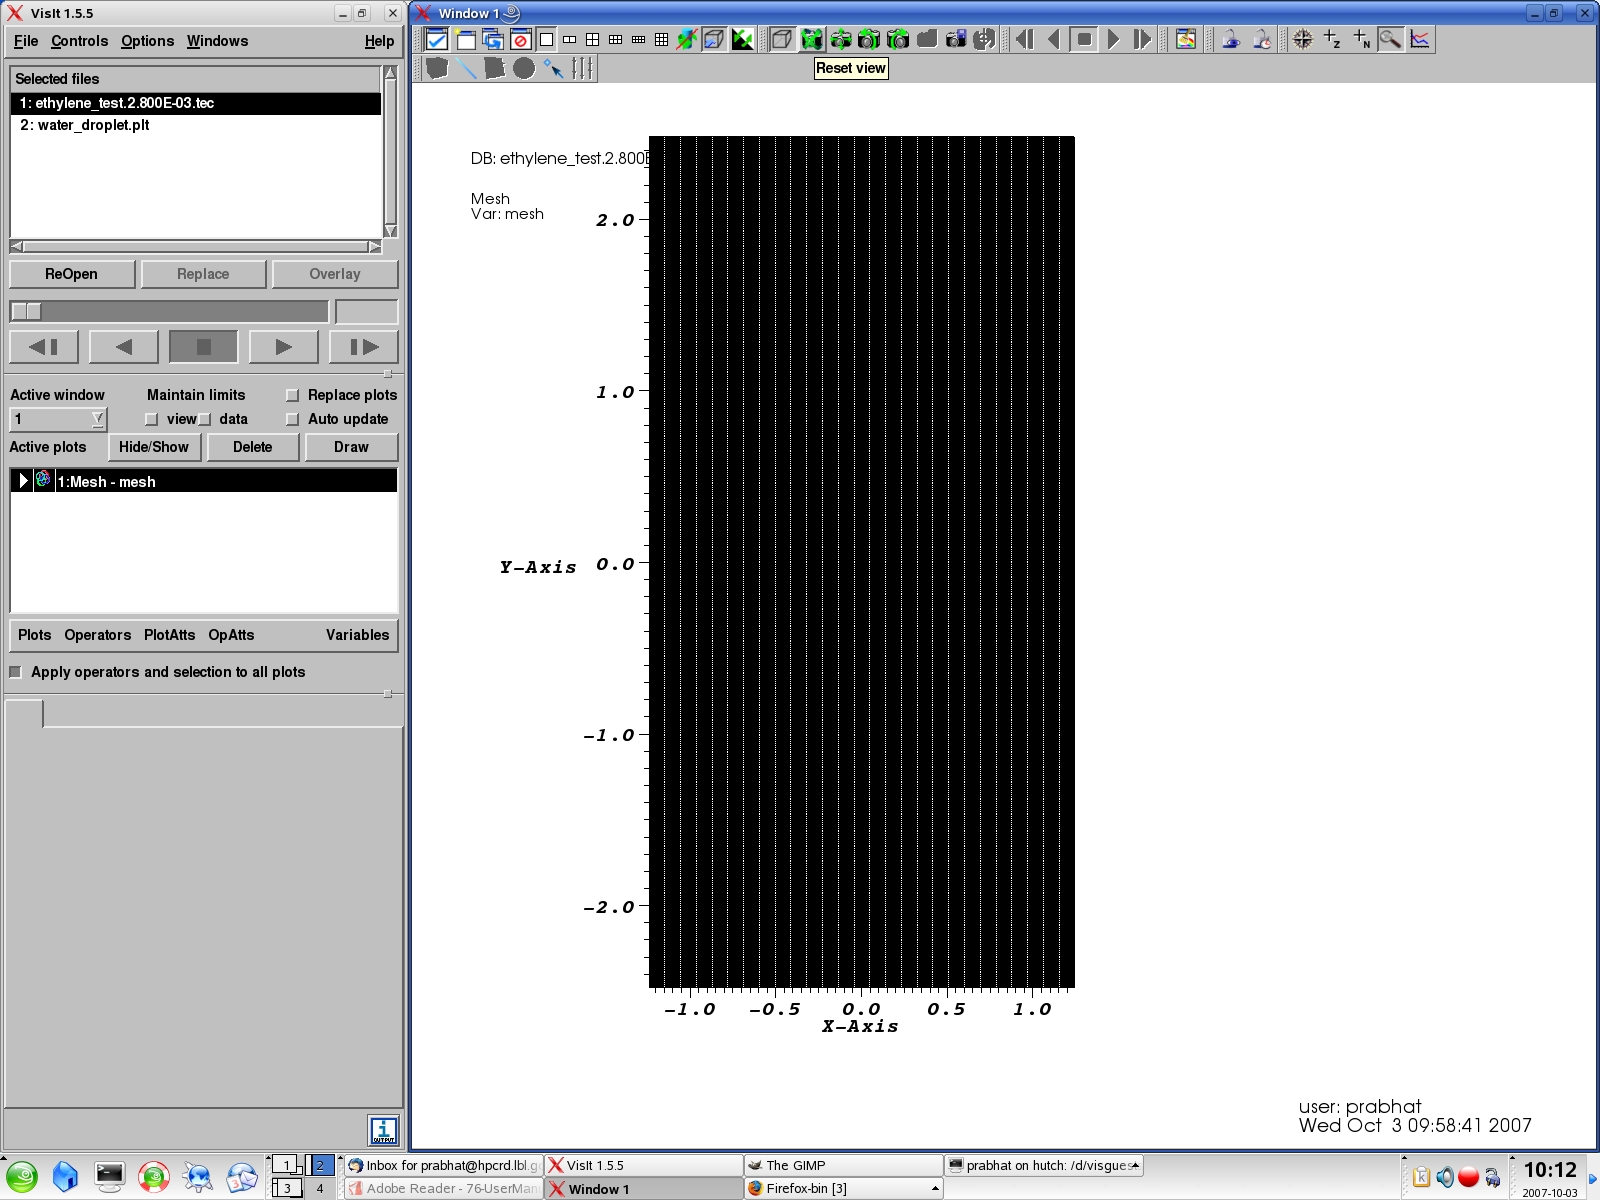
Press the camera reset button to zoom back to the original view. Note that there are camera buttons to undo and redo your view changes.
Press the "Swap background/foreground colors button". Depending on the dataset and color schemes that you use, this can be a useful tool to know about. Restore the white foreground. Click on Hide/Show button for the plot to hide it temporarily.