This is an archival copy of the Visualization Group's web page 1998 to 2017. For current information, please vist our group's new web page.
Visualization of Large-Scale GFDL/NOAA Climate Simulations
 |
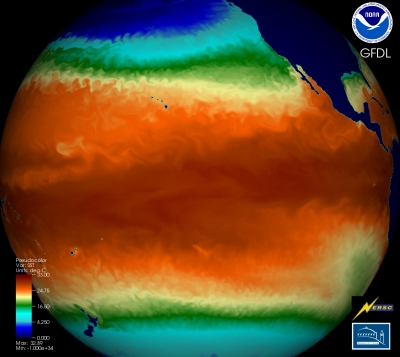 |
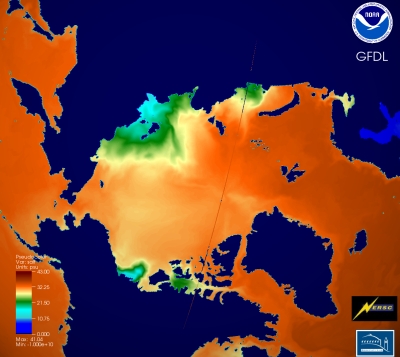
| Plot of Sea-Surface Salinity in the Arctic (CM2.4 model) | Plot of Sea-Surface Temperature in the Pacific (CM2.4 model) |
 |
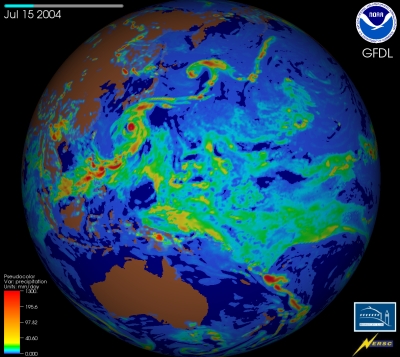 |
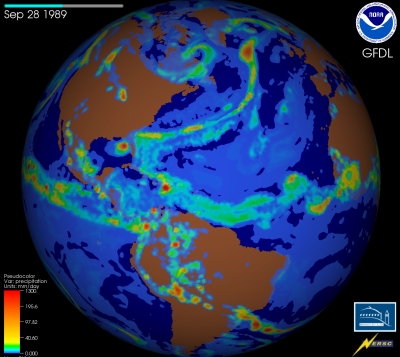
| Plot of Surface Precipitation in the Atlantic (c180 model) | Plot of Surface Precipitation in the Pacific (c360 model) |
Scientists at the Geophysical Fluid Dynamics Laboratory (GFDL), located at Princeton University, have developed models capable of modeling the global atmosphere at resolutions down to 5 km, and the ocean at resolutions between 10 km and 20 km. They also have designed numerical experiments which generated 1 to 4 terabytes of data for every year of simulation. NERSC provided GFDL with the computation resources for this computational challenge by setting aside over 800,000 CPU hours on the Cray XT4 named Franklin.
In order to visualize the large datasets generated by the simulations, the NERSC Analytics team supported the GFDL scientists. The Analytics Team used the VisIt visualization and analysis package to create images and movies for climate scientists at GFDL. VisIt, which recently won an R&D 100 award, was developed by the DOE Advanced Simulation and Computing Initiative (ASCI) to visualize and analyze the results of large-scale simulations. The Analytics team accelerated time to discovery by developing software that eliminates costly data format conversion barriers, namely extra computation, extra data storage and more manual processing steps. As a result, it was possible to load the simulation output generated on Franklin directly into VisIt for visual data exploration and analysis.
Developing the visualizations was a collaborative effort. The Analytics Team had extensive interactions with GFDL staff and scientists in order to create visualizations that focus on the most interesting and significant phenomena (e.g., the formation of tropical storms and ocean eddies). The visualizations present the simulation data in an accessible format using conventions familiar to the climate modeling community. Because of the work done by the Analytics Team, VisIt now provides GFDL scientists with the capability to do large-scale visualization of climate data, which was impossible with conventional visualization tools. The Analytics Team has installed VisIt at GFDL to allow scientists to use the new visualization capability on a day-to-day basis.
GFDL Collaborators
- V. Balaji
- Chris Kerr
- Remik Ziemlinski
- Hans Valenkamp
Media
Outreach
More Information