This is an archival copy of the Visualization Group's web page 1998 to 2017. For current information, please vist our group's new web page.
Visualization of Microearthquakes Data
|
|

|
|
||
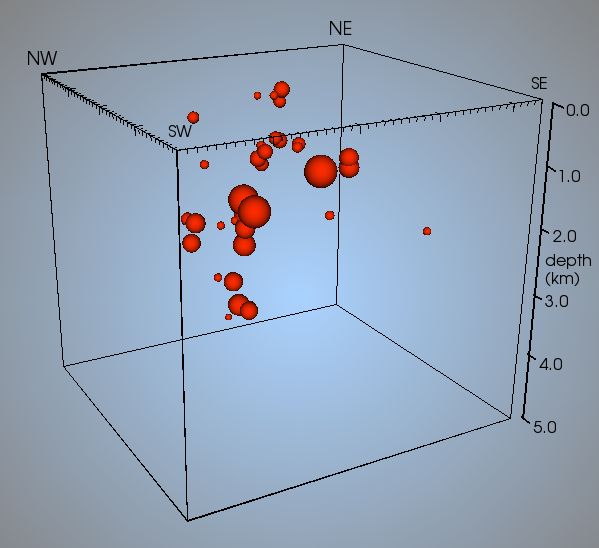
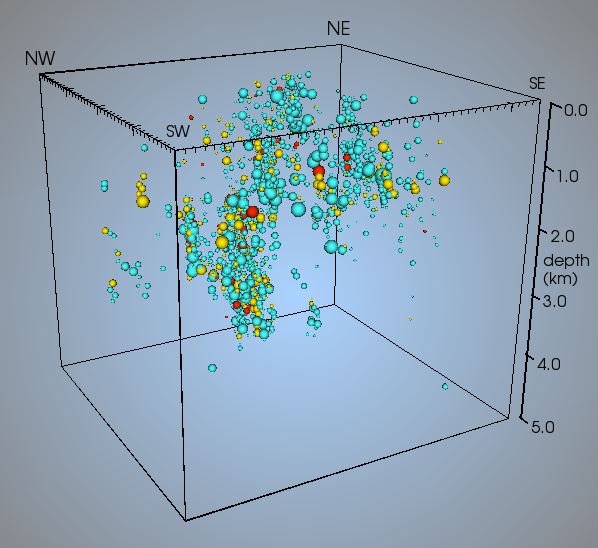
| day view, click to enlarge | week view, click to enlarge | month view, click to enlarge |
Making Microearthquake Data From The Geysers Publicly Accessible
The Earth Science Division at Lawrence Berkeley National Laboratory has developed a Web site to provide information about enhanced geothermal systems and induced seismicity, as well as near real-time data on microearthquakes occurring at The Geysers. See the For More Information section below for links to this information.
In order to provide 3D visualizations of the microearthquake data, we installed the visualization and analysis package, VisIt, on the server that receives and archives the microearthquake data from The Geysers. To generate the 3D visualizations shown above, a PHP script calls VisIt to run in command line mode; a Python script is used to control different aspects of the visualization. Though it is not possible for the user to interact with the image generated by VisIt, different viewing angles are available by selecting the desired orientation.
Future Plans
We plan to implement the same technology used to create visualizations of microearthquakes at The Geysers to create visualizations of microearthquakes at Desert Peak & Brady's Hot Springs, also in California. In addition, we plan to install VisIt on a workstation at the Desert Peak/Brady's Hot Springs site in order to provide real-time, 3D visualizations of the earthquake data for viewing by the geothermal plant operators.
For More Information
Earth Sciences Division, Lawrence Berkeley National Laboratory
What is an Enhanced Geothermal System?
What is Induced Seismicity?
Interactive, Real-Time Map of Earthquakes at The Geysers
Interactive, Real-Time Map of Earthquakes at Desert Peak & Brady's Hot Springs
U.S. Department of Energy
Geothermal Technologies Program