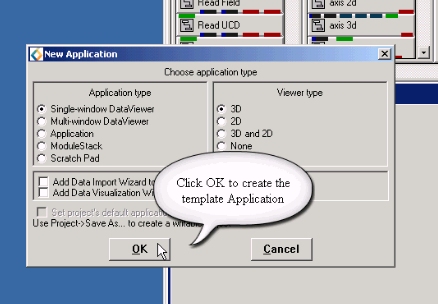
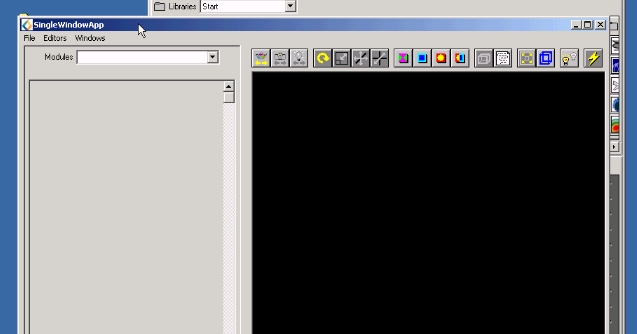
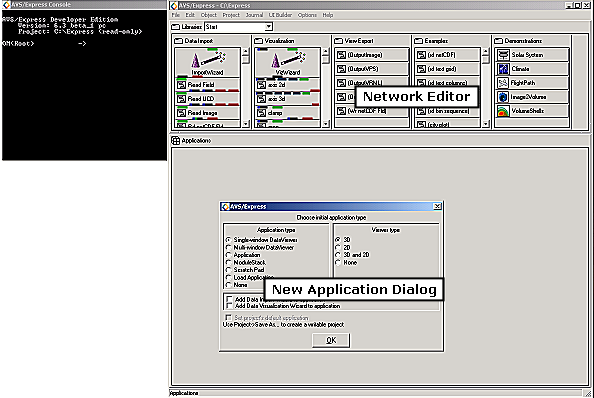
| This creates the
SingleWindowApp user interface and provides you with an application
workspace to create a visualization network within. The SingleWindowApplication
user interface provides you with a lot of functionality for controlling
the appearance and style of the objects that will be placed into the viewer.
It is a fully functional 2D and 3D viewer offering an ability
to change the properties associated with every object in the scene. The
toolbar also provides you with the ability to transform the objects (rotate,
pan and zoom) as well as the camera and lights in the scene. You can also
toggle functionality like bidirectional lighting and perspective camera
view.
| Creating the Visualization
Network |
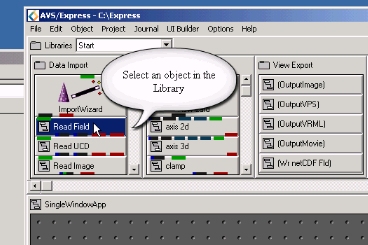
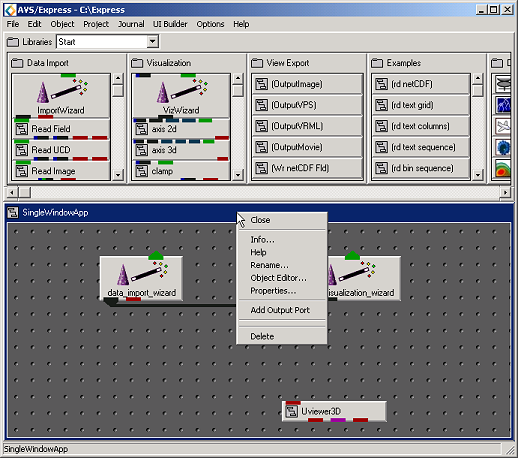
To create an application in
AVS/Express you select objects from the available libraries. Whilst
it is possible to create your own custom objects with their own functionality
there are many objects already available in the product for you to use.
Above, we select a ReadField object using the left mouse button
and then drag it into the application workspace as shown below.
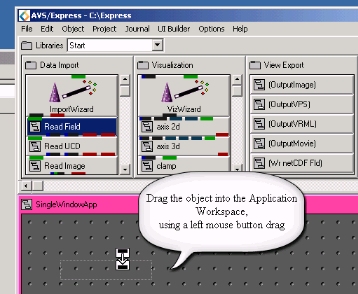
Notice that the SingleWindowApplication
container turns a pink colour to indicate that you are inserting an object
into it. This procedure is known as instancing an object in the
network editor. You are basically creating a copy of the object in order
that it is available for use within a visualization network.
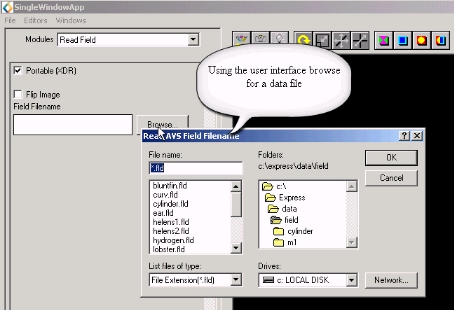
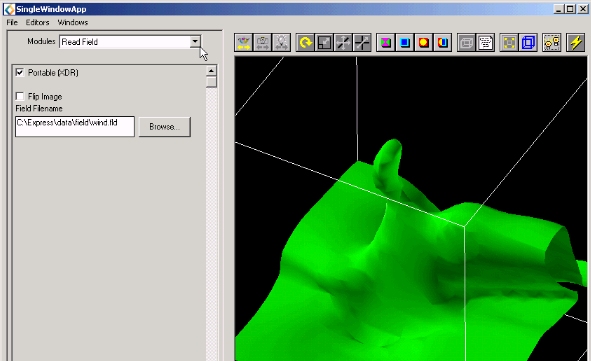
| Reading Data into AVS/Express |
In the case of objects
like ReadField, there is some use interface that automatically becomes
created inside the SingleWindowApplication user interface as shown below.
This allows you to browse for a data file, and the ReadField object then
performs its function and reads the file. There is now data available
to AVS/Express and it resides within the ReadField object.
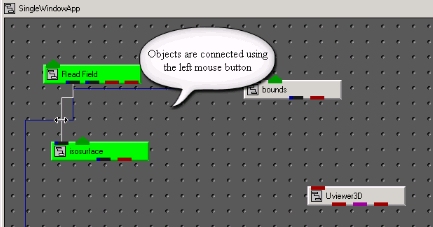
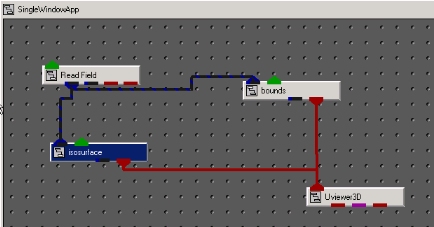
You can then proceed to instance
further objects into the application workspace as shown below. In order
for you to create a visualization network, you need to connect the objects
you have instanced together to create the application workflow. This is
achieved by clicking the left mouse button on the coloured ports on each
of the objects that you have instanced. Below, you will see an example
of connecting the ReadField and the isosurface
objects. Note that when you click the left mouse button over a coloured
port and then drag the mouse around AVS/Express will indicate the available
connection points by highlighting the objects in green and drawing a white
connection line between the ports. The colours of the ports and connections
are significant - they indicate the type of object that you are connecting.
In particular, the blue/black represents the AVS field object and
the red represents an object that can be rendered in a viewer.
Once you have made all the
necessary connections you will have created what is known as a network.
You are now ready to use the viewer and all of its constituent controls
to visualize and interact with your data.
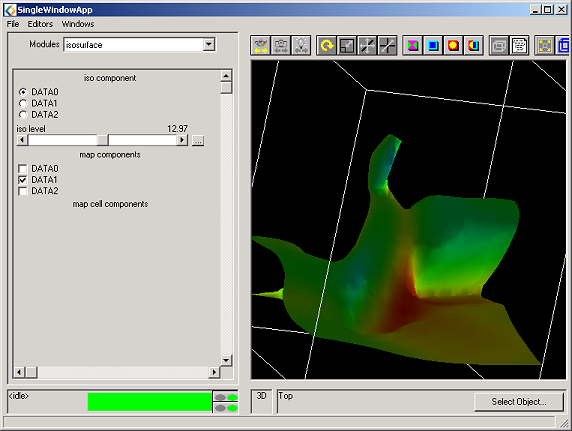
| Visualize and Interact
with your Data |
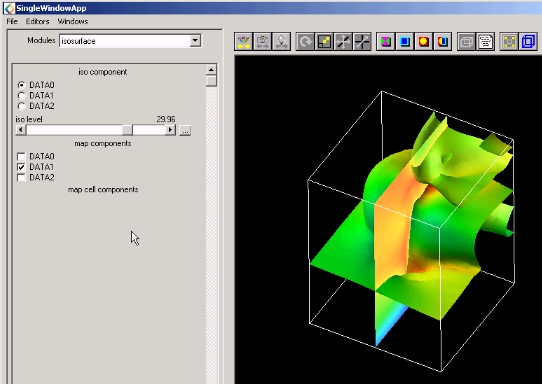
The SingleWindowApp pictured
below shows what the above network looks like in the viewer once a dataset
has been read in. The controls on the viewer allow you to pan/zoom/rotate
the isosurface in the viewer. There are also many other controls on the
attributes of the isosurface object. Basically, any object that is seen
in the viewer has its own set of properties that you can change. For example,
you may want to change the surface opacity, or the metallicity for light
reflection on the surface of the object.
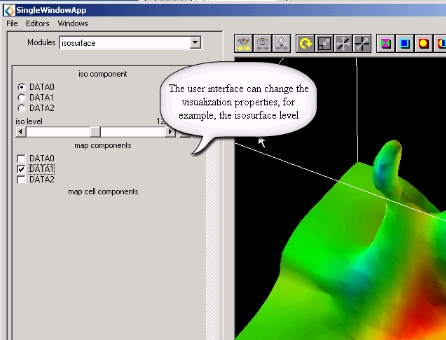
Once you have positioned the
object in the viewer, you can also change the properties which are exposed
in the user interface that is created when you instance some objects.
For example, the isosurface object created the user interface shown below.
You can change the level of the isosurface (surface of constant value
through the data volume) by using the slider widget.
You will also notice that there
are selections for DATA0, DATA1 and DATA2. These are the parameters that
exist in the dataset that we have read using ReadField. It is possible
to select one of the parameters (eg. DATA0) to perform the isosurface
algorithm on and select another parameter (eg. DATA1) for the data on
each of the vertices on the data. (the vertices in the data are commonly
referred to in AVS/Express as nodes and together with a mesh
constitute what is described as a field). This results in you seeing
the variation of DATA1 across an isosurface of a particular value of DATA0.
This can be an interesting visualization technique across many application
areas. For example, you may have a data volume which contains pressure
and temperature values. It may be very beneficial to visualize the temperature
variation across a particular pressure isosurface.
| Modify and Adapt your
Visualization Network |
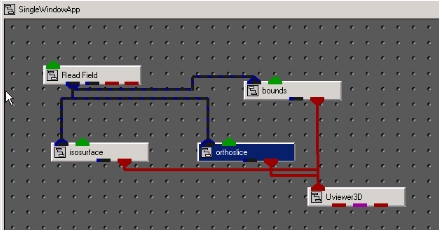
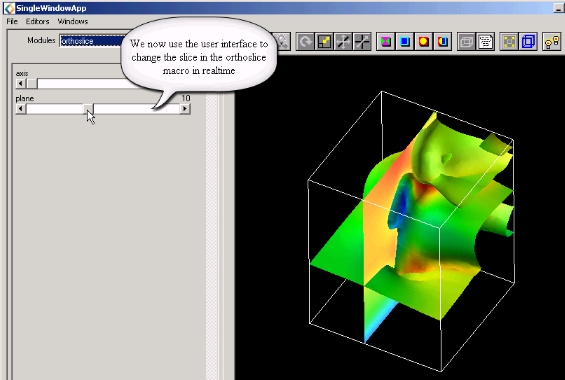
It is possible to continually
update and revise your application by adding/deleting objects and breaking/inserting
connections. By adding in an orthoslice object for example we then see
an addition object in the viewer. It is possible to have any number of
objects represented in the AVS/Express viewer, each one capable of having
its own individual properties associated with it. (eg surface opacity
etc).
In the same way that we changed
the isosurface level using the slider in the isosurface user interface
the illustration below shows how the orthoslice that has been added can
be controlled.
Once you have completed your
application you will typically wish to save your work. This is achieved
by using the File->Save Application option from the main menubar in
the AVS/Express network editor window, as shown below.
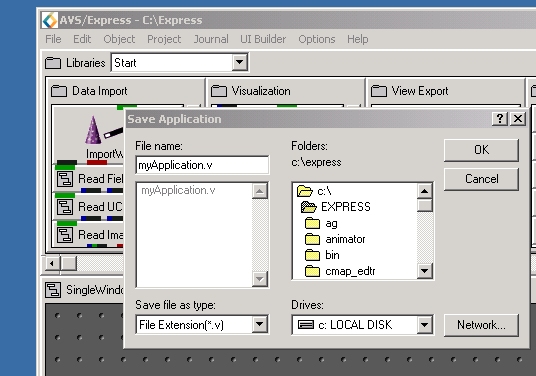
This creates the myApplication.v
file which contains the AVS/Express v code that can be reloaded to recreate
your application in the network editor. This can be achieved using File->Load
Application from the main menubar of the network editor window.
|
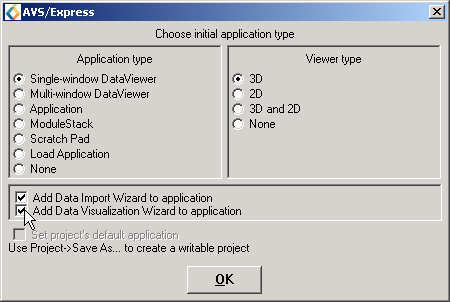
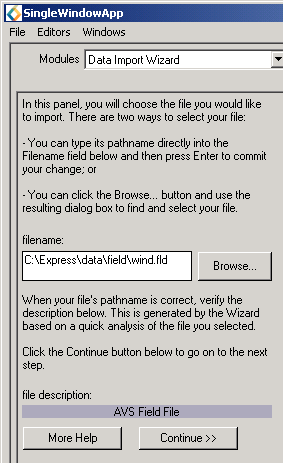 In
the SingleWindowApp window, pictured on the left, make sure that the Modules
selection is set to Data Import Wizard. Now, you will need to enter a
file name to get started. We will use wind.fld.
In
the SingleWindowApp window, pictured on the left, make sure that the Modules
selection is set to Data Import Wizard. Now, you will need to enter a
file name to get started. We will use wind.fld.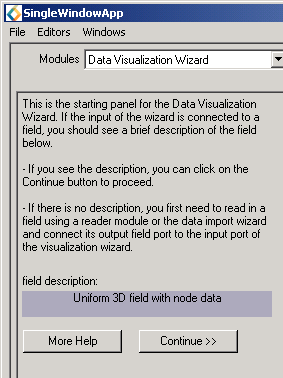 Using
the Data Visualization Wizard
Using
the Data Visualization Wizard