Using the Data Visualization Wizard
The Data Visualization Wizard will help you to create an simple visualization application without having to learn much about using the Network Editor. The Data Visualization Wizard, is not for building large, complex applications. It can be used by new users who are unfamiliar with the Network Editor editor and by experiences uses who want to quickly build a simple application.
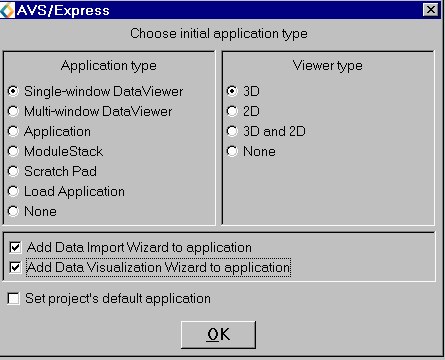
You may have created the wizard when you started AVS/Express with the initial "choose application" dialog.
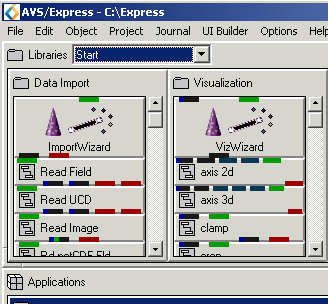
To add the wizard to an existing application, follow this procedure. Go to the Start page in the Network Editor and find the module labeled VizWizard. Click on it to select it and drag it down into the application workspace.
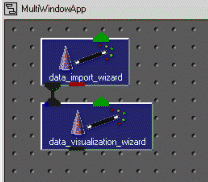
As a precondition for using the Data Visualization Wizard, you must have a valid AVS/Express field connected to the import port of the wizard. You can use the Data Import Wizard to read in a data file or you can directly use one of the readers.
 |
 |
|
import wizard connected to the
visualization wizard
|
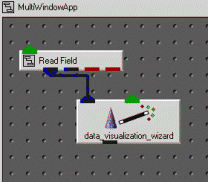
read field connected to the visualization
wizard
|
The Visualization Wizard knows how to automatically connect to the Import Wizard. However, if you use a standard reader module such as Read_Field you must remember to connect the field output port (for Read_Field, the blue/black port on the bottom left of the module), with the import port of the Data Visualization Wizard (the black port on the top left of the module).
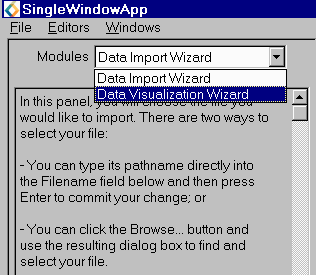 |
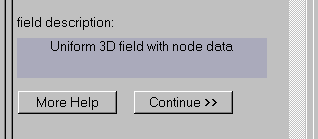
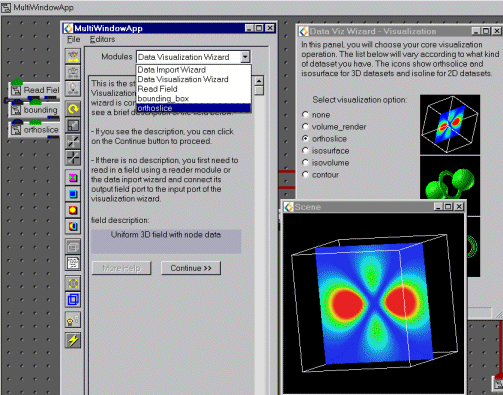
To interact with the wizard, you must access its user interface via the Modules menu. Scroll through the list (it may be short) and select Data Visualization Wizard. If you have successfully connected a field you will see a description of the field near the bottom of the wizard's main UI panel. If you have not successfully connected a field, you will see either a "No field" or "Invalid field" message. |
 Once you
have successfully connected a field, press the Continue button
to proceed to the rest of the wizard. You will be presented with a series
of dialogs which present menus of possible options. When you click on
an option, the relevant visualization module will be immediately created
and added to your visualization application. Thus the visualization that
appears in the viewer will change every time you make a choice. Since
some modules may take significant time to execute, there may be pauses
after you select an option.
Once you
have successfully connected a field, press the Continue button
to proceed to the rest of the wizard. You will be presented with a series
of dialogs which present menus of possible options. When you click on
an option, the relevant visualization module will be immediately created
and added to your visualization application. Thus the visualization that
appears in the viewer will change every time you make a choice. Since
some modules may take significant time to execute, there may be pauses
after you select an option.
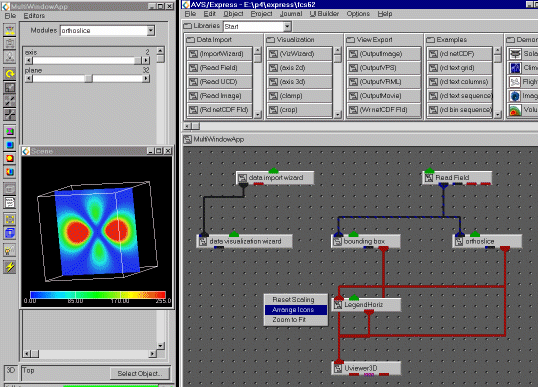
Most of the visualization modules that you create will have their own
user interface. You must use the Modules menu to access these user
interface panels. In the illustration,
the wizard has been used to create a orthoslice module. To change one
of the orthoslice parameters, you must switch to the orthoslice UI by
using the Modules menu.
Once you are finished with your application, you can make the appearance of the modules in the Network Editor more understandable, click right over ther Network Editor and select the Arrange Icons option. You may now delete the wizards. The new application you have created will not need them.