This is an archival copy of the Visualization Group's web page 1998 to 2017. For current information, please vist our group's new web page.
Visualization of Simulations of Beam Delivery System Designs
for X-Ray Free Electron Lasers
Contents
Introduction
Free electron lasers (FEL) have the same optical properties as conventional lasers (e.g., high spatial coherence), but use relativistic electron beams for the lasing medium. FEL have a wide range of tunable wave frequencies, short pulse duration, and high peak power. These characteristics make FELs ideal for application in the fields of biology, material science, chemistry, and condensed matter physics. For example, because of the precise way in which FELs can be tuned, they have the potential to improve the precision of laser surgery and tumor ablation by minimizing damage to surrounding tissue.
The shorter the pulse length, the smaller and faster the reaction that can be studied using a FEL. Pulse lengths on the order of 100 femtoseconds (1 femtosecond = 10-15 seconds) may be used to investigate changes in molecular structures resulting from chemical and biological reactions. However, being able to study the motion of electrons during reactions requires pulse lengths on the order of attoseconds (1 attosecond = 10-18 seconds).
Dr. Ji Qiang of the Center for Beam Physics in the Accelerator and Fusion Research Division at Lawrence Berkeley National Laboratory (LBNL) is using a computational approach to study the fundamental parameters that determine FEL cost and performance. These parameters include the electron beam emittance, the electron beam energy, the peak current, and the energy spread. Understanding the range and interactions of these parameters will lead to an optimal design for the electron beam delivery system, and in time, a new light source facility at LBNL that could be used to study molecular changes at the electron level.
We are in the initial stages of working with Dr. Qiang to provide 3D visualizations of simulation results. Simulation results for the beam electrons consist of the position and x, y, and z momentum of the particles. The visualizations provide a qualitative way to see how the shape and orientation of the beam changes as it passes through the electron bunch compressor, which is used to accelerate the electrons to relativistic speeds and to make the beam more coherent (e.g., more focused).
Technology Used
We are using the VisIt visualization and analysis software to create the visualizations. As a first step, and because initially we are working with a small number of data files (each corresponding to a position in the electron bunch compressor), we convert the data files to VTK format, which is VisIt's native data format.
The images shown below are "pseudocolor" plots. The particles are plotted as points to show the location of the electrons; the particles are colored in these examples by the momentum in the z direction. In order to compare the beam shape and orientation corresponding to different locations of the electron bunch compressor, we use a feature of VisIt to maintain the view limits so that the particles in each dataset are plotted on the same scale, with the same axes.
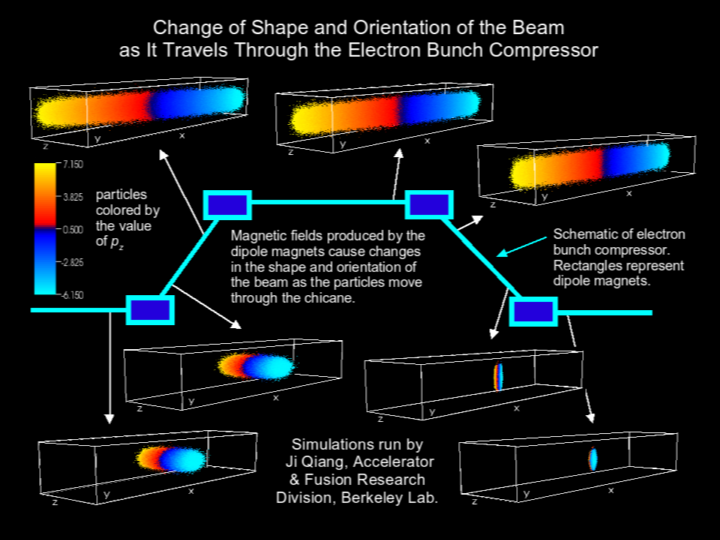
Image I - Single-Dataset Plots
In the image below, pseudocolor plots of seven datasets representing
different locations in the electron bunch compressor are shown next
to a schematic of the compressor. The rectangles in the schematic
represent dipole magnets that accelerate and focus the particles.
The decrease in the spatial extent of the beam is clearly seen in
the bottom right plot.
|
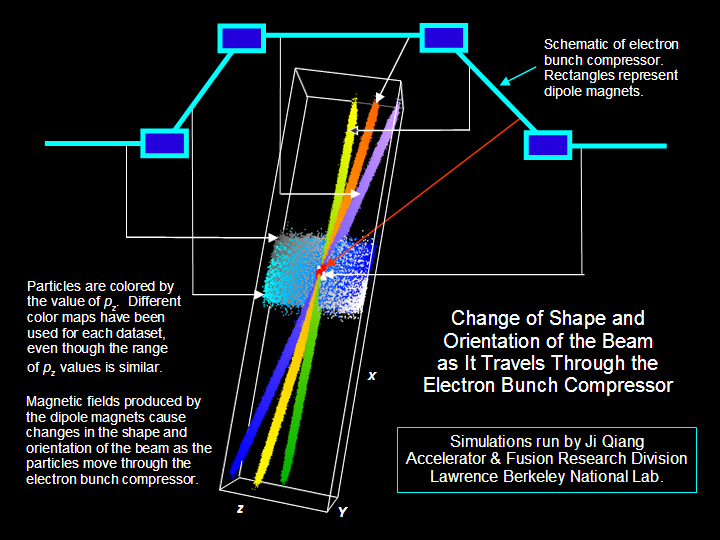
Image II - Superimposed-Datasets Plot
This image shows the same data used to make the individual plots
above, but now all of the data have been superimposed in one plot
in order to more easily compare the shape and orientation of the
beam at different locations in the electron bunch compressor.
In order to more easily distinguish between individual datasets,
distinct color transfer functions have been used for each dataset.
|