This is an archival copy of the Visualization Group's web page 1998 to 2017. For current information, please vist our group's new web page.
SNP-VISTA: An Interactive SNPs Visualization Tool
Table of Contents
Introduction
Polymorphisms are differences in genomic DNA sequences that naturally occur in a population. A single nucleotide substitution is called single nucleotide polymorphism (SNP). SNPs are common but minute variations that occur in human DNA at a frequency of one every 1,000 bases. SNPs are established genetic markers that aid in the identification of loci affecting quantitative traits and/or disease in a wide variety of eukaryote species. The recent completion of a single version of the human genome has now provided the substrates for direct comparison of individuals in both health and disease. Ideally, to better understand the genetic contributions to severe diseases, one would obtain the entire human genome sequence for all disease-carrying individuals for comparison to unaffected control groups. In reality, a strategy that is approachable with today's resources is the re-sequencing of a large set of appropriate candidate genes in individuals with a given disease to screen for causative mutations. Such an approach is fruitful in investigation different diseases [2].
In addition, SNPs have been used extensively in efforts to study the evolution of microbial populations. Such efforts have largely been confined to multi-locus sequence typing of clinical isolates of species such as Neisseria meningitidis and Staphylococcus aureus [3]. However, the recent application of random shotgun sequencing to environmental samples [4,5,6] make possible more extensive SNP analysis of co-occurring and co-evolving microbial populations. An intriguing finding from the Tyson et al. study was the mosaic nature of the genomes of an archaeal population inferred to be the result of extensive homologous recombination of three ancestral strains. This observation was based on a manual analysis of a small subset of the data (ca. 40,000 basepairs) and remains to be verified across the whole genome. Tools to analyze this type of data are in their infancy.
Related Work
Manipulation, cross-referencing, and haplotype viewing of SNP data are essential for quality assessment and identification of variants associated with genetic disease. The display and interpretation of large genotype data sets can be simplified by using a graphical display.
Several software tools have been developed to assist researchers to carry out this task. A visual genotype (VG2) display [7,2] proved to be useful in presenting raw datasets of individuals' genotype data. This format presents all data in an array of samples (rows) x polymorphic sites (columns) and encodes each diallelic polymorphism according to a general color scheme. This array format allows one to visually inspect the data across both individual's diplotypes and polymorphic sites to make comparisons.
Another program, ViewGene [8], was developed as a flexible tool that takes and constructs an assembly reference scaffold that can be viewed through a simple graphical interface. Polymorphisms generated from many sources can be added to this scaffold with a variety of options to control what is displayed. Large amounts of polymorphism data can be organized so that patterns and haplotypes can be readily discerned. One more software system for automated and visual analysis of functionally annotated haplotypes, HapScope [9], displays genomic structure with haplotype information in an integrated environment, providing alternative views for assessing genetic and functional correlation.
Although these tools provide a number of valuable options for the scientist, some of the needs have not been addressed. VG2 uses simple but effective representations to show genotype data with SNP classification and organizes the data using hierarchical clustering. The major drawbacks of this tool are its static display, lack of provision for details on demand and lack of capabilities to map SNPs to genomic structure. ViewGene provides a simple interface for analyzing sequence data to locate regions favorable to re-sequencing but is limited in its capabilities for post-processing of SNPs data. HapScope consists of valuable haplotype analysis methods along with interactive visualization, but its major focus is the presentation of results from haplotype analysis. Our goal was to develop exploration tools for discovery of disease-related mutations from re-sequencing data.
Motivation
Most experiments in SNPs research are exploratory in nature, and it has become essential to provide the scientific community with an advanced SNPs exploration tools. With SNPs data growing as a result of large-scale gene re-sequencing and ecogenomics projects, there exists a need to overcome limitations of current SNPs analysis tools. We present an interactive visualization tool, which aids scientists in generating hypotheses from large-scale SNPs data.
Implementation
SNP-VISTA is implemented as a stand-alone Java application using JBuilder (http://www.borland.com/us/products/jbuilder/index.html [10]) as a development environment. SNP-VISTA uses clustering software, Levenshtein (http://odur.let.rug.nl/~kleiweg/levenshtein/index.html [11]) which is bundled with the package. Automatic recombination points are calculated using a C++ program that can be invoked from the Java application.
Results
SNP-VISTA is available in two versions, as GeneSNP-VISTA or EcoSNP-VISTA, each tailored for a specific application. We describe the two versions in next two sections.
GeneSNP-VISTA: Discovery of disease-related mutations in genes.
We use the ABO blood group gene (transferase A, alpha 1-3-N-acetylgalactosaminyltransferase; transferase B, alpha 1.3.galactosyltransferase) from the finished genelists of SeattleSNPs (http://pga.mbt.washington.edu/ [12]) to demonstrate our tool.
|
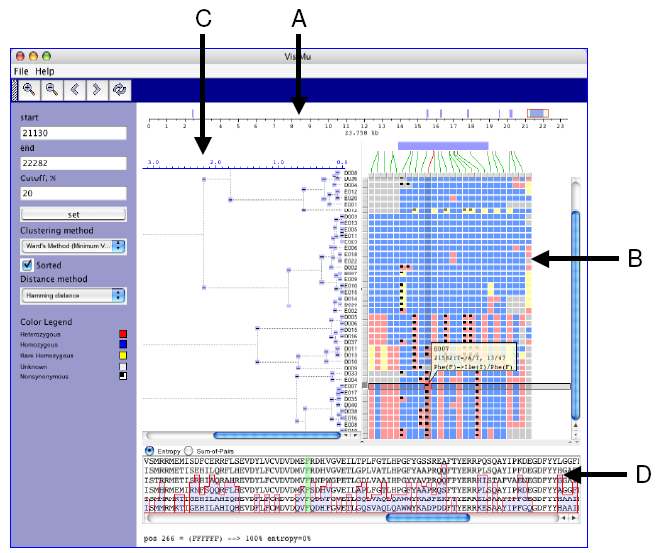
| Figure 1. GeneSNP-VISTA screenshot for ABO blood group gene(transferase A, alpha 1-3-N-acetylgalactosaminyltransferase; transferase B, alpha 1.3.galactosyltransferase.) |
- Coordinate bar showing gene structure. ABO gene consists of 23,758 basepairs. Seven exons are displayed as blue rectangles. The red rectangle is a user-selected region.
- SNPs are represented as an array of samples (rows) x polymorphic sites (columns), where each cell is colored based on the SNP classification. Blue is used for common homozygous SNP, yellow color is used for rare homozygous SNP, red is used for heterozygous SNP, and a black dot is used for non-synonymous SNP.
- Clustering results are shown as a hierarchical tree, where each node can be collapsed or expanded.
- Window displaying protein alignment. The display is linked with the non-synonymous SNP selected by the user.
Our tool requires the following files as input:
- Reference Sequence:.
- This file should contain the DNA sequence of the gene in fasta format (http://www.ebi.ac.uk/help/formats_frame.html [13]).
- Annotation file:
- This file must be a tab-delimited file with annotation for exons and coding sequence (cds) in the following format:
<exon/cds><tab><start><tab><end>
If the coding sequence is not specified explicitly then exons are merged to obtain the coding sequence. - This file must be a tab-delimited file with annotation for exons and coding sequence (cds) in the following format:
- SNPs data:
- This file must be a tab-delimited file with four fields on each line, in the format:
<Site Position><tab><Sample ID><tab><Allele 1><tab><Allele 2>
- This file must be a tab-delimited file with four fields on each line, in the format:
- Protein alignment
- This file should contain the protein alignment in multi-fasta format. The first protein in the file must be the protein corresponding to the gene given in the reference sequence.
Sample input files are available on the website http://genome.lbl.gov/vista/GeneSNP-VISTA/ (see [14]).
SNP-VISTA supports the following applications:
- Mapping of SNPs to gene structure.
- A SNP can be in a UTR, exon, intron or splice site. Such information about the location of SNPs is very valuable to biologists. We map SNPs to the gene structure as shown in Figure 1.A. A coordinate bar represents the ABO blood group gene, which is 23,758 basepairs long and has seven exons that are shown by blue rectangles. The red rectangle is the user-selected subregion of the gene. Green lines show the exact location of each SNP on the gene. On mouse over the connecting line is highlighted in red.
- Classification of SNPs.
- A SNP can be homozygous, heterozygous, synonymous or non-synonymous. We classify SNPs and use different colors for each class of SNPs. The graphical representation is similar to VG2, where selected data is represented as an array of samples (rows) x polymorphic sites (columns), and each cell is colored depending on the classification of SNPs based on their location in the gene, frequency of occurrence in samples and allele composition (Figure 1.B). On mouse over detailed information (sample id, position, frequency, etc.) about the selected SNP is displayed in a semi-transparent callout.
- Clustering.
- Clustering of samples based on the the patterns of SNPs allows a user to navigate through the data. We use Levenshtein software package to perform hierarchical clustering. Clustering can be performed using all the SNPs in the data or a user-selected subset. SNP-VISTA displays the hierarchical tree (Figure 1.C) where each node can be collapsed or expanded. Figure 1 shows the result of clustering samples by applying SNPs to the last exon.
-
Integration of multiple
alignments of homologous proteins in different species
- One of the approaches to assess how significant a SNP changing an amino acid is to investigate the conservation of that amino acid across multiple species. A SNP causing change in a conserved amino acid is more likely to be a causative mutation. Integration of multiple alignments of homologous proteins allow a scientist to determine whether a SNP has caused a conserved amino acid to change. SNP-VISTA displays the protein alignment along with an entropy or sum-of-pairs similarity score in the protein alignment window (Figure 1.D). When a user selects a non-synonymous SNP, the corresponding amino acid is highlighted in green. In Figure 1, the user has selected a heterozygous non-synonymous SNP in the last exon, which changes the amino acid Phenylalanine (F) to Isoleucine (I). The protein alignment window shows the conservation of this amino acid, which is 100% conserved. The SIFT analysis [15] predicts this position as intolerant, and Polyphen [16] deems it as probably damaging (see results at http://pga.gs.washington.edu/data/abo/abobg.pph-sift.txt. [17].)
EcoSNP-VISTA: Discovery of recombination points in microbial populations
We have used the acid mine drainage [4] dataset that is publicly available at http://durian.jgi-psf.org/~eszeto/metag-web/pub/ [18].
|
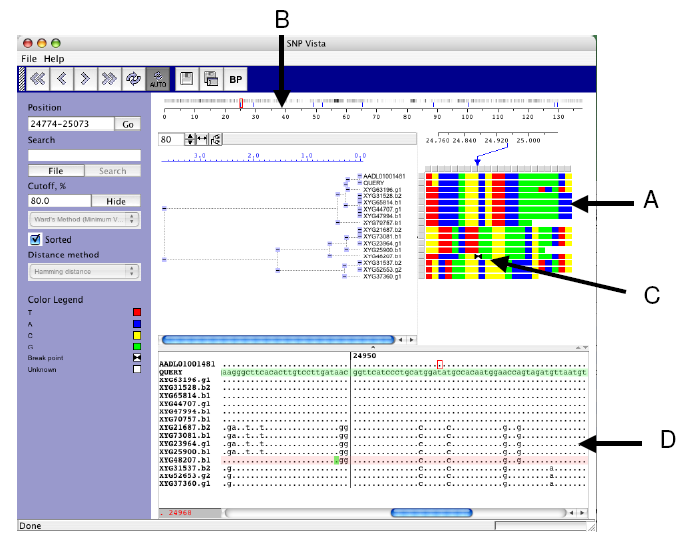
| Figure 2. EcoSNP-VISTA screenshot of scaffold 1 of the microbial genome of ferroplasma II (Tyson et al., 2004.) |
- SNPs are represented as an array of reads (rows) x polymorphic sites (columns), where each cell is colored based on the nucleotide. Red is used for nucleotide T (Thyamine), blue is used for nucleotide A (Adenine), yellow is used for nucleotide C (Cytosine), and green is used for nucleotide G (Guanine).
- Coordinate bar providing global view of recombination points shown with blue lines and frequency of SNPs, where black indicates higher frequency.
- Array representation showing exact position of the recombination point with two black triangles.
- Window displaying the blast alignment for the selected region.
The following files are needed as input:
- Alignment data.
- This file should contain the blast output obtained by blasting the consensus sequence against all reads in the database.
- Annotation file
- This file is similar to the GeneSNP-VISTA annotation file, and it has the following format.
<exon/cds><tab><start><tab><end>
- This file is similar to the GeneSNP-VISTA annotation file, and it has the following format.
- Recombination points (optional)
- This file must be a tab-delimited file with four fields on each line, in the format:
<Read name><tab><Position>
- This file must be a tab-delimited file with four fields on each line, in the format:
Sample input files are available at http://genome.lbl.gov/vista/EcoSNP-VISTA/ [19].
The following modifications are made to GeneSNP-VISTA for to handle ecogenomics data:
- Nucleotide-based color scheme.
- Each cell in the array is colored based on the nucleotide at the SNP position. Once the reads are clustered this representation allows a user to discern various SNP patterns probably corresponding to different strains (Figure 2.A).
- Recombination point
calculation and visualization.
- A user can provide recombination points, obtained from another program or calculate by SNP-VISTA. The recombination point calculation is based on the bellerophon program [20]. Our tool displays recombination points on the coordinate bar using blue lines showing the global view and the frequency of SNPs (Figure 2.B). The array representation also shows the exact position of the recombination point with two black triangles (Figure 2.C). The reads can be examined closely in a window as shown in Figure 2.D. A user can visually verify the recombination points and accept them or reject them. It is also possible to add a recombination point. Automatic recombination point calculation results typically in a large number of false positives, whereas manual detection of recombination points is a very time-consuming job. SNP-VISTA combines both approaches to provide a feasible method for detecting recombination points.
Discussion
The majority of SNPs obtained from re-sequencing of disease-related genes do not have damaging effects on the structure and function of a protein. It is important to filter out such SNPs from causative mutations. GeneSNP-VISTA is an interactive visual tool for highly efficient analysis of large amounts of SNPs data to determine a set of potentially causative mutations. As shown in Figure 1, all the information about a SNP (type, location on genomic structure, frequency of occurrence, amino acid change it causes and conservation of the changed amino acid) allows a scientist to determine whether a SNP is a possible causative mutation. By providing a visually integrated representation of SNPs data with genomic structure and protein conservation, GeneSNP-VISTA facilitates the screening of causative mutations from re-sequencing of a large set of appropriate candidate genes in individuals with a given disease.
Adaptation of existing computational methods and development of new ones for effective SNP analysis of co-occurring and co-evolving microbial populations from ecogenomics data poses new challenges. Manual analysis (Tyson et al., 2004) led to interesting results, but such an analysis is time-intensive and becomes prohibitive for whole genome-scale analysis. Automatic methods are not available yet for such an analysis. As an alternative, EcoSNP-VISTA provides a visual interface for semi-automatic analysis of SNPs data from ecogenomics data. As shown in Figure 2, a compact color-coded representation of SNPs data allows a scientist to manually detect recombination points and visually verify automatically calculated recombination points. EcoSNP-VISTA provides insight into homologous recombination in microbial populations and has the potential to guide in the development of computational methods for such analysis.
Conclusion
We have developed SNP-VISTA, a publicly available interactive visualization tool that assists scientists in the analysis of re-sequence data of disease-related genes for discovery of associated and/or causative alleles and ecogenomics data for studying homologous recombination in microbial populations.
References
1. SNP-VISTA: An Interactive SNPs
Visualization Tool. [http://genome.lbl.gov/vista/snpvista]
2.
Reider M. J., Taylor S. L., Clark A. G. and Nickerson D. A.: Sequence variation in the human angiotensin
converting enzyme. Nature Genetics,
22, 59-62, 1999.
3.
Spratt B. G.,
Zhang Q.,
Jones D. M., Hutchison A., Brannigan J. A., Dowson C. G.:
Recruitment of a
Penicillin-Binding
Protein Gene from Neisseria flavescens during the Emergence of
Penicillin
Resistance in Neisseria meningitidis. PNAS. 86(22), 8988-8992, 1989.
4.
Tyson et al.: Community structure and
metabolism through reconstruction of microbial
genomes from the environment. Nature,
428, 37- 43 2004.
5. Venter et al.:
Environmental
genome shotgun sequencing of the
6. Tringe SG,
von Mering C, Kobayashi A, Salamov AA, Chen K, Chang HW, Podar M, Short
JM,
Mathur EJ, Detter JC, Bork P, Hugenholtz P, Rubin EM.: Comparative metagenomics of microbial
communities. Science. 308, 554-7,
2005.
7.
Nickerson et al.: DNA sequence diversity
in a 9.7-kb region of the human lipoprotein
lipase gene. Nature Genetics.19:233-240,
1998.
8. Kashuk C., SenGupta S.,
Eichler E.,
Chakravarti A.: ViewGene: A graphical
tool for polymorphism visualization and characterization. Genome Research, 12(2), 333-8, 2002.
9. Zhang J., Rowe
W. L., Struewing J. P., Buetow K.H.: HapScope: A software
system for automated
and visual analysis of functionally annotated haplotypes. Nucleic Acids Research, 30(23), 5213-21,
2002.
10. Borland
: JBuilder. [http://www.borland.com/us/products/jbuilder/index.html]
11. RuG/L04 -
dialectometrics & cartography. [http://odur.let.rug.nl/~kleiweg/levenshtein/index.html]
12. SeattleSNPs.
[http://pga.mbt.washington.edu/]
13. EBI
help. [http://www.ebi.ac.uk/help/formats_frame.html]
14. GeneSNP-VISTA.
[http://genome.lbl.gov/vista/GeneSNP-VISTA/]
15. Ng P.C., Henikoff. S.: Accounting for human polymorphisms predicted to affect protein function. Genome Research, 12:436-446, 2002.
16. Ramensky V.,
Bork P., Sunyaev S.: Human
non-synonymous SNPs: server and survey.
Nucleic Acids Research, 30:17:3894-3900,
2002.
17. [http://pga.gs.washington.edu/data/abo/abobg.pph-sift.txt]
18. Metagenomics
Prototype Web
Tools. [http://durian.jgi-psf.org/~eszeto/metag-web/pub/]
19. EcoSNP-VISTA.
[http://genome.lbl.gov/vista/EcoSNP-VISTA/]
20.
Huber T., Faulkner G., Hugenholtz P.: Bellerophon:
A program to detect chimeric sequences in multiple sequence alignments.
Bioinformatics, 20.14, 2317-2319,
2004.