This is an archival copy of the Visualization Group's web page 1998 to 2017. For current information, please vist our group's new web page.
SciDAC: Terascale Computational Atomic Physics for Controlled Fusion Energy
Table of Contents
Introduction
In this article, we show how the NERSC Visualization Group has worked closely with Michael S. Pindzola from the Department of Physics at Auburn University. The self-guided demonstration will walk you through some of the steps taken by the NERSC Visualization Group during the collaborative effort.
This project, part SciDAC: Terascale Computational Atomic Physics for the Edge Region in Controlled Fusion Plasmas, studies a wide range of atomic collision processes present in the edge region of controlled fusion plasmas. The essence of the problem is to describe the correlated quantal dynamics of free electrons moving in the long-range Coulomb field of a fourth body.[1][2][3]
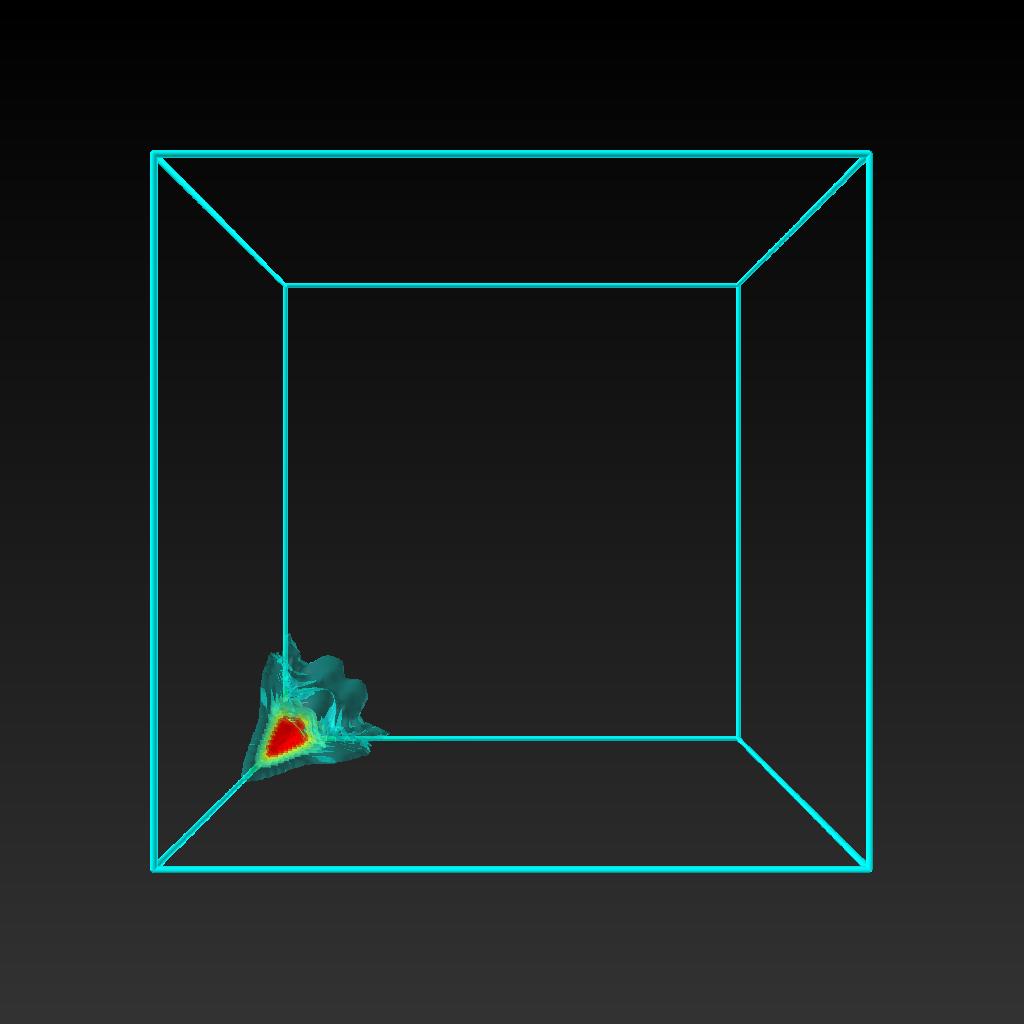
First Light: wavepacket scattering from a Helium atom.
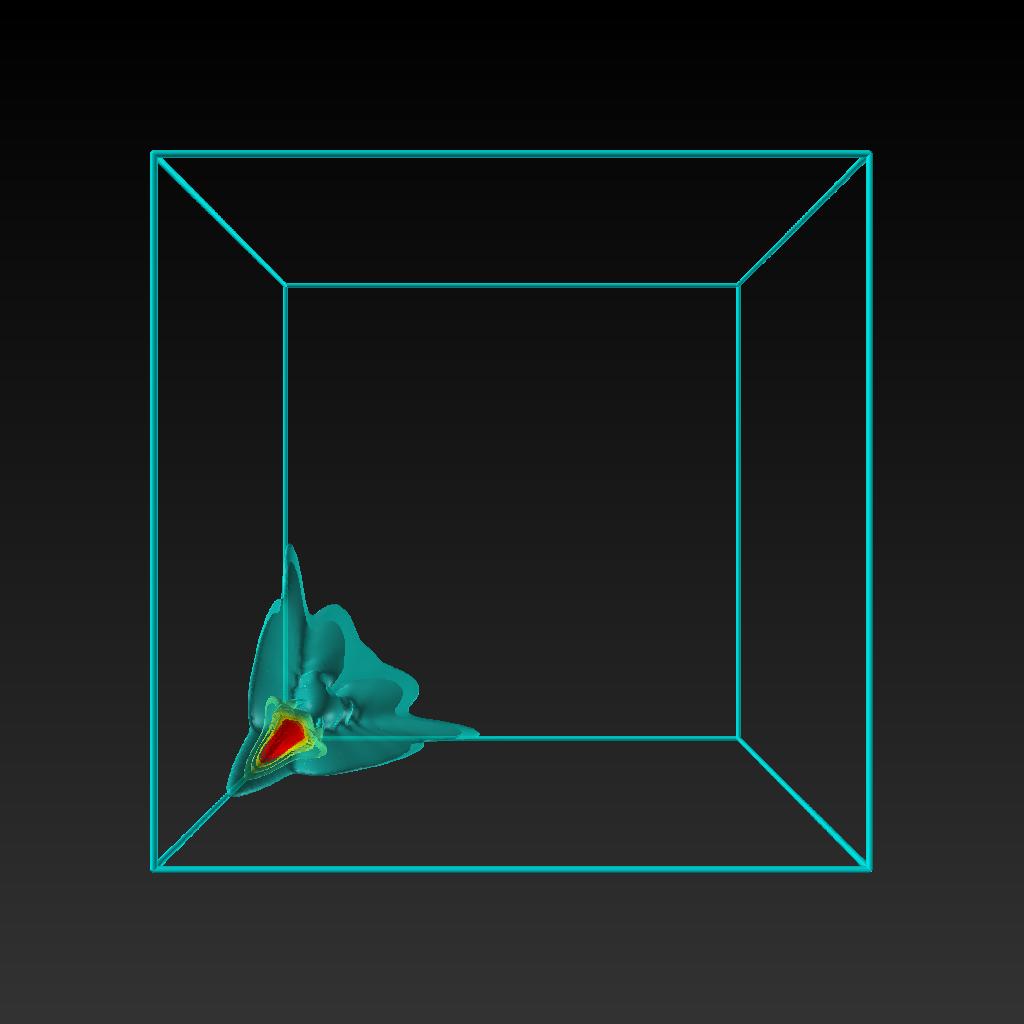
The first step required in the visualization process is to transform data from the form output by the simulation into a form suitable for use by visualization tools. The image below shows our "first light" result, which is used as a "sanity check" to make sure we didn't do anything untoward with the data while reading it in. The data sets that we worked with are simulations of a wavepacket scattering from the Helium atom. The data is given in a uniform grid, each point has the values of the real and the imaginary part of the wave function, Ψ. We visualize the electron probability density, |Ψ|2.
|
|
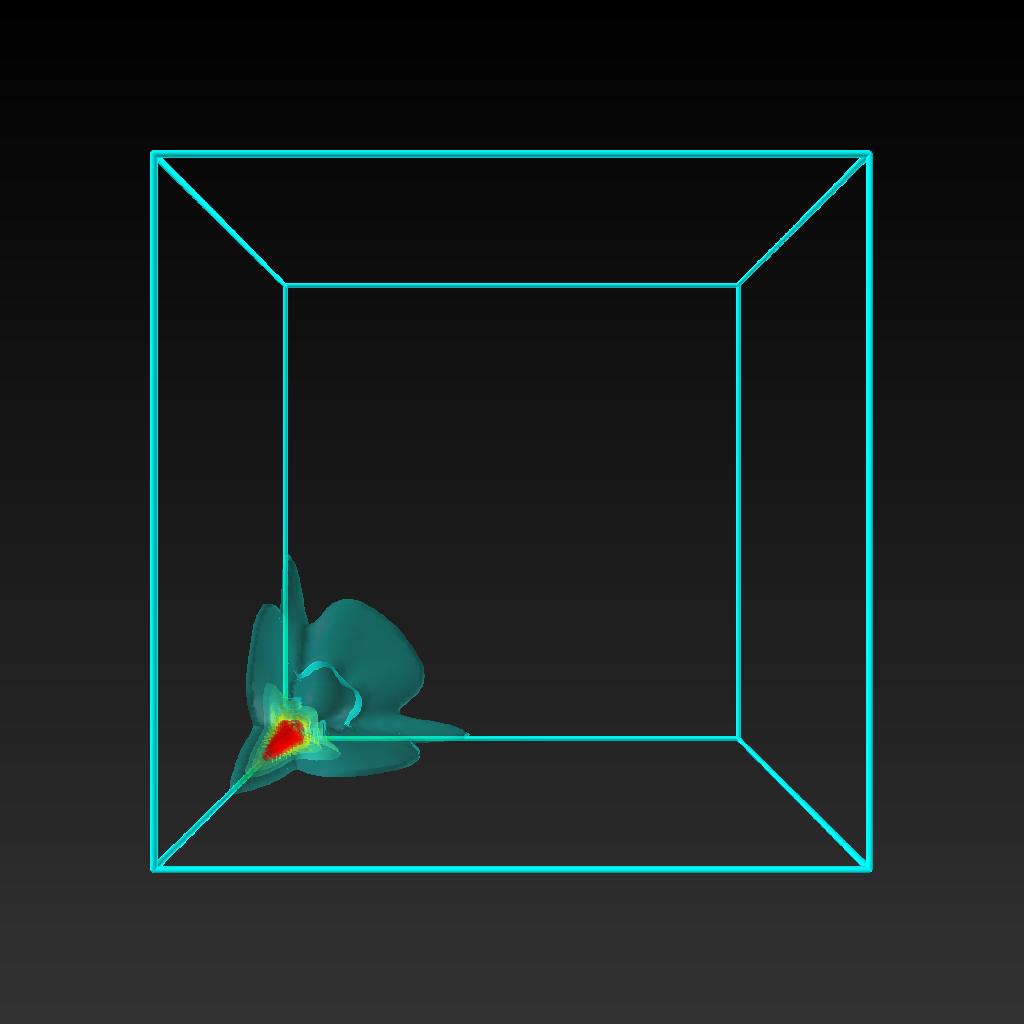
First Light: isosurfaces showing the probability densities for electron scattering.
Time evolution MPEG movie for the 96^3 data set (9M) |
3D Visualization
Once we determined that the representation of the data was correct we rendered the results using different visualization techniques to see which one showed better the physical processes of interest.
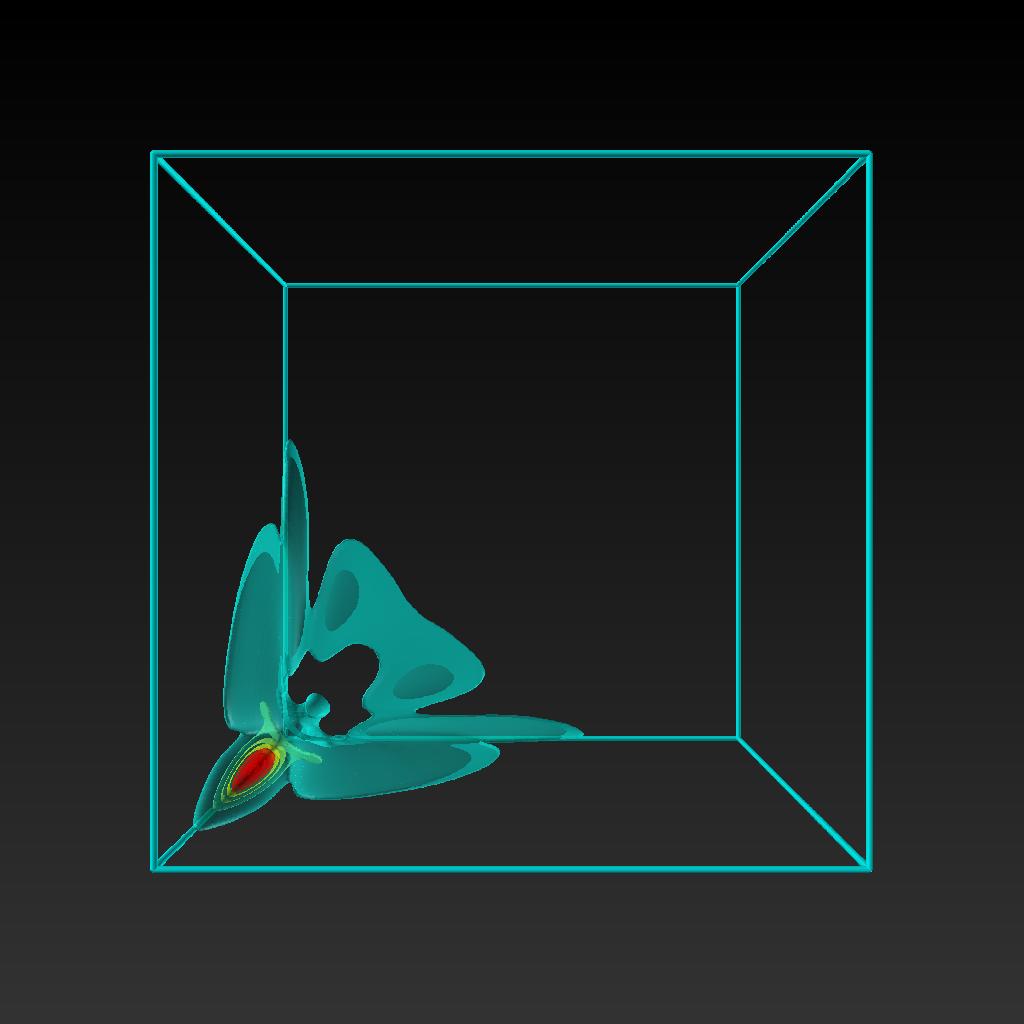
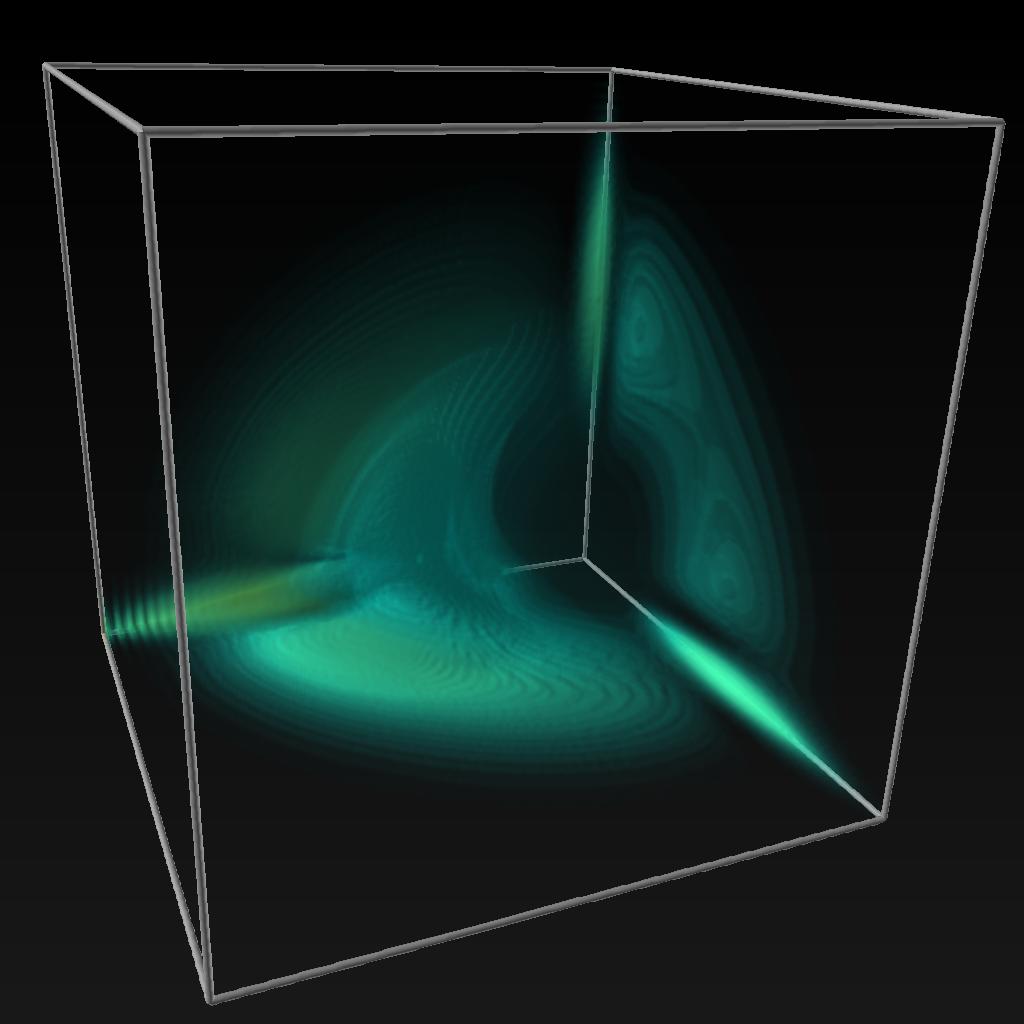
What we needed to visualize are the different scattering processes: a wavepacket moving smoothly toward the origin, then moving away along its original path with slightly reduced intensity (elastic scattering). We also expected to see much smaller wavepackets moving along the two other axis (exchange scattering). Along the three faces next to the origin there are expanding clouds of reduced intensities (single ionization) and finally going away from the origin toward the center of the cube, at greatly reduced intensity there is an expanding mist (double ionization).
|
|
Isosurfaces of probability density for the 192^3 data set. MPEG movie of the time evolution (9M) |
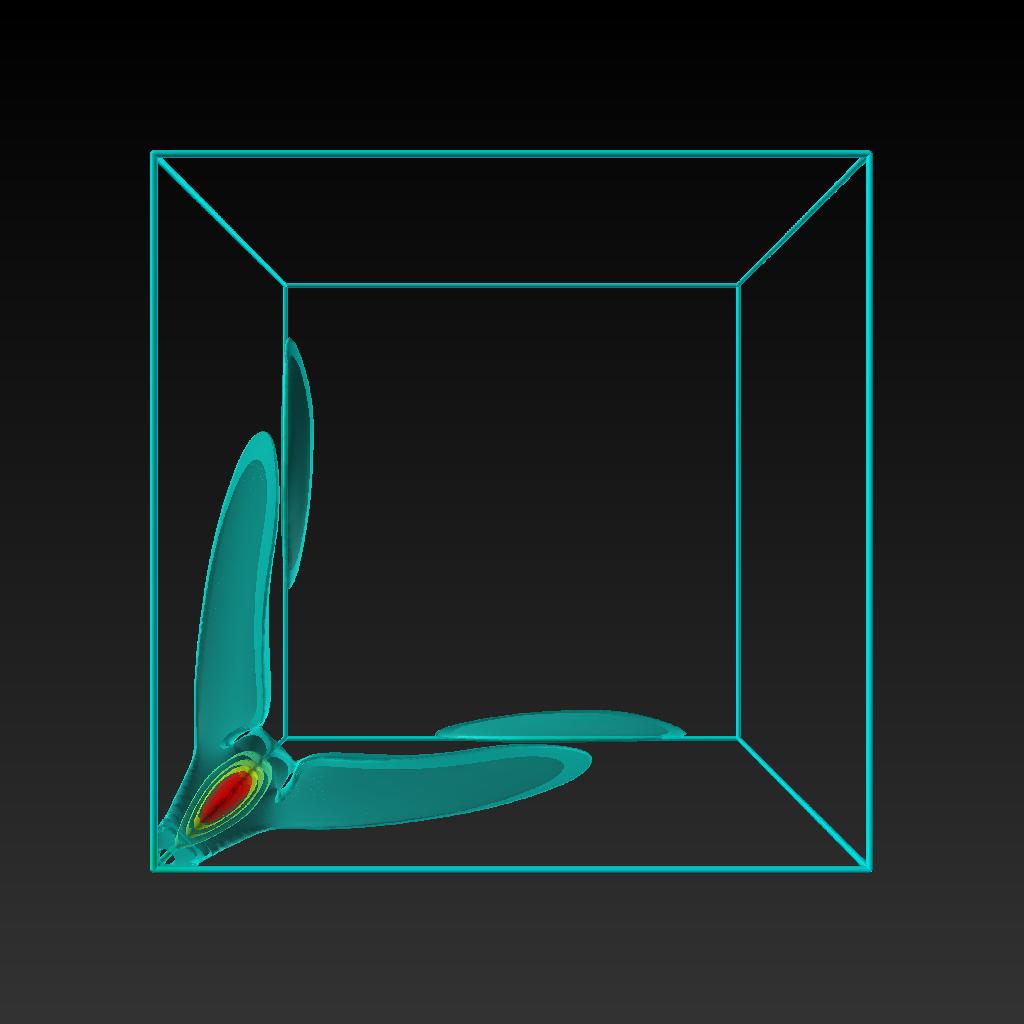
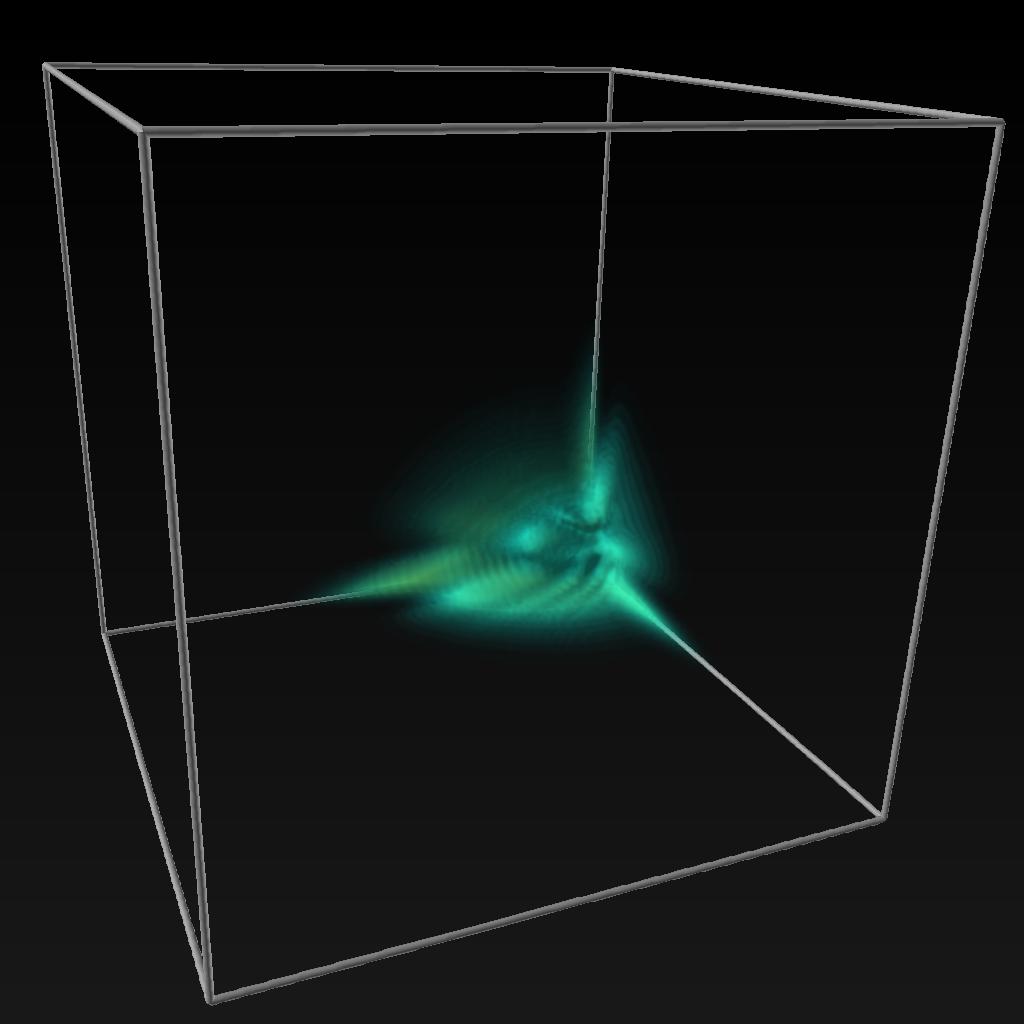
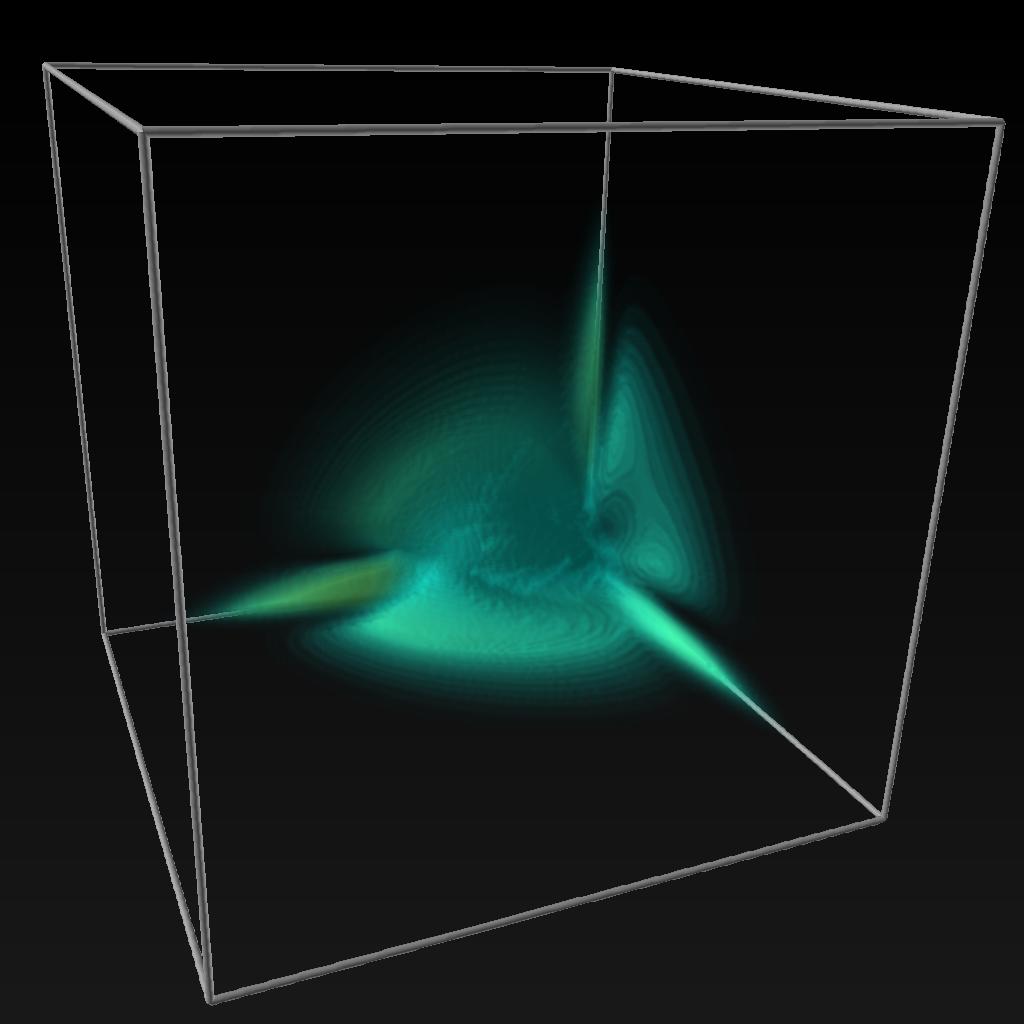
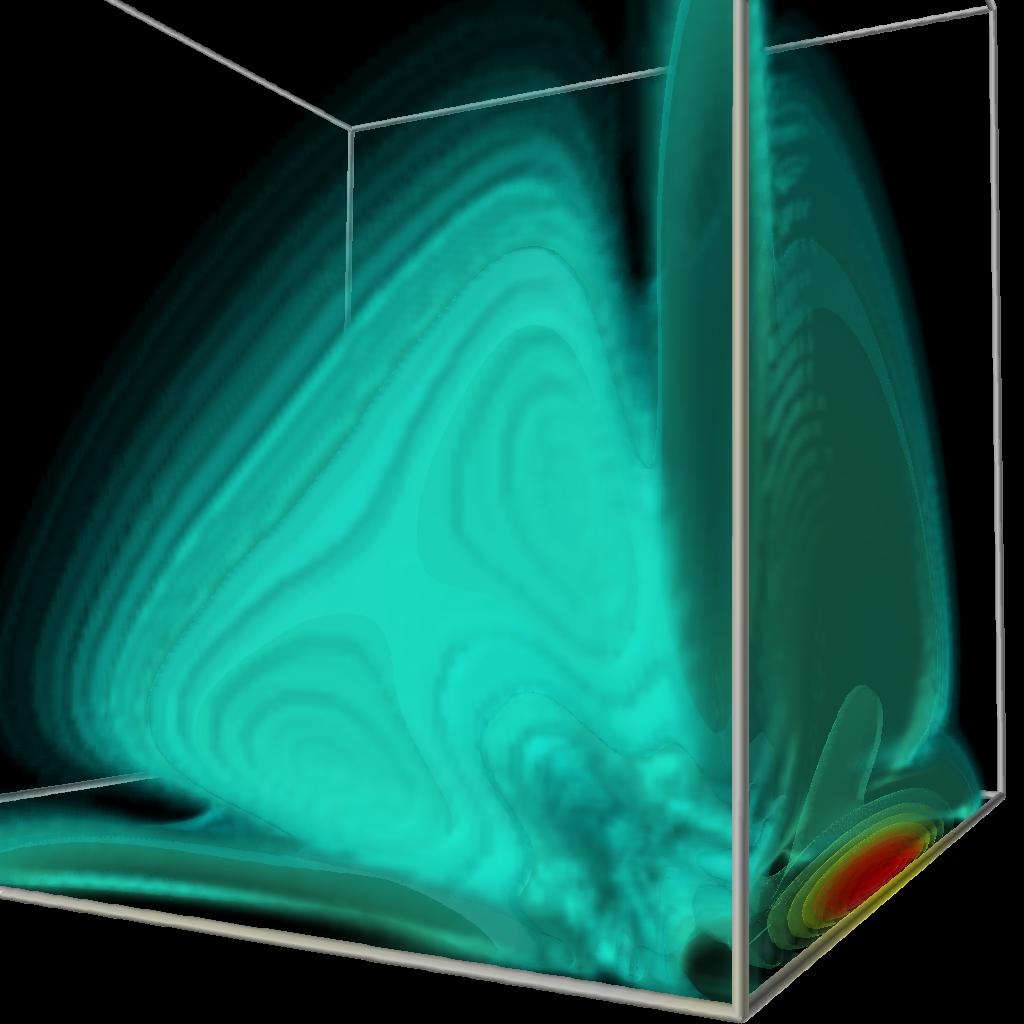
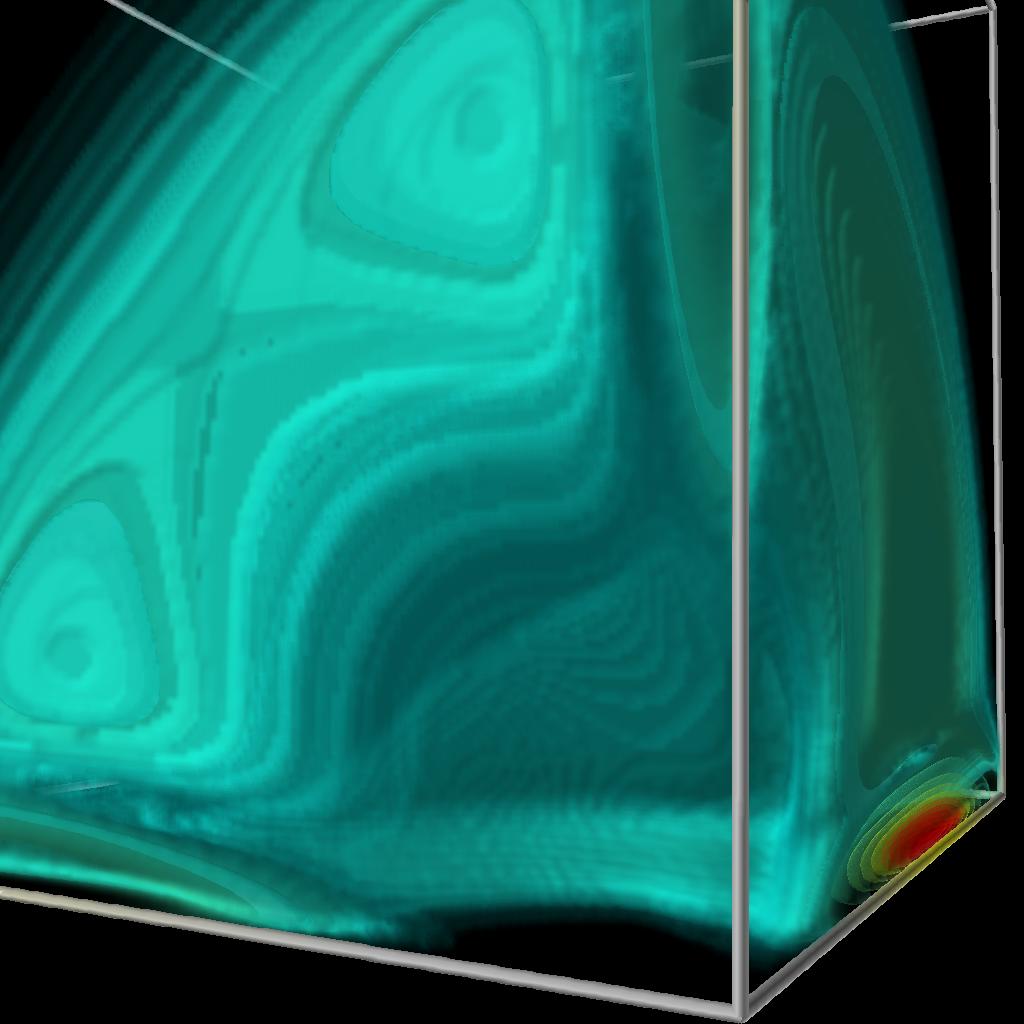
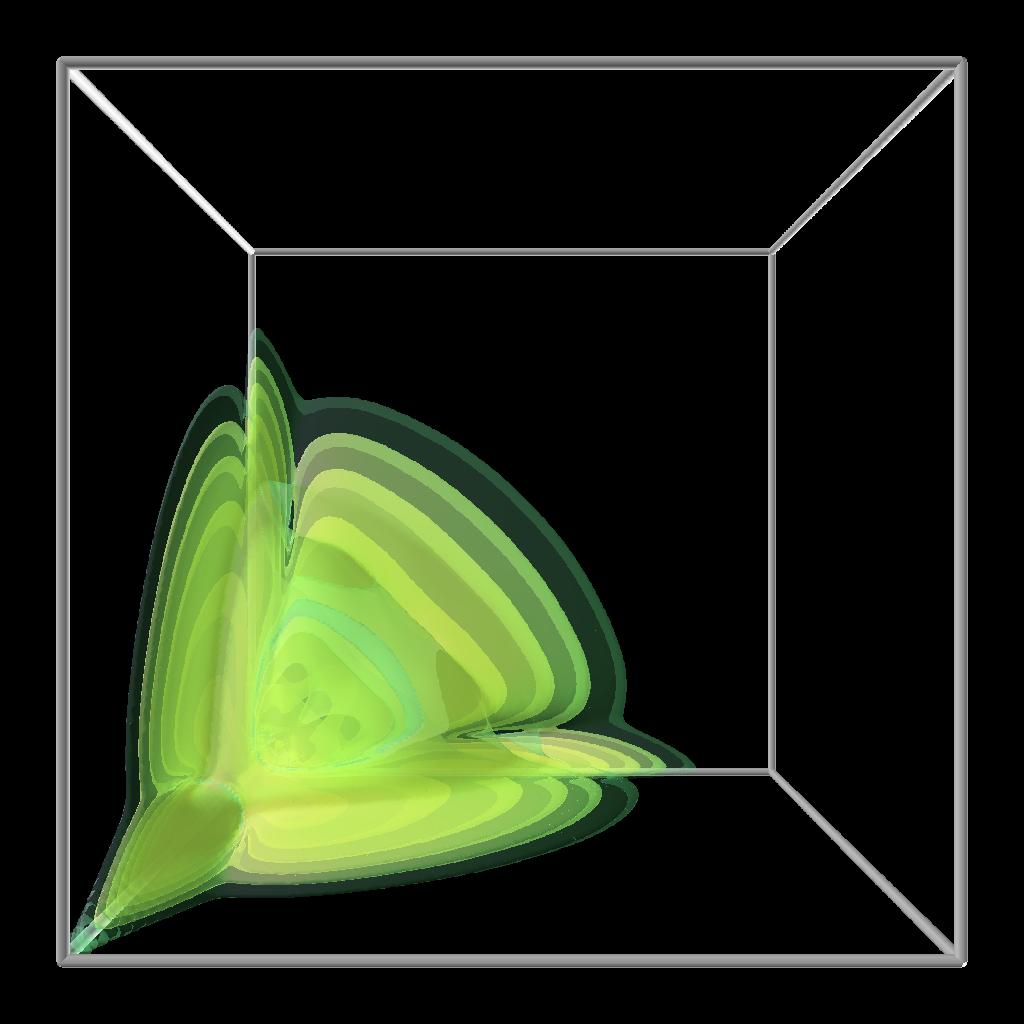
Volume rendering shows a smoother, cloudier view of the process.

|
|
Volume rendering of the probability density for the 192^3 data set. MPEG movie of the time evolution (9M) |
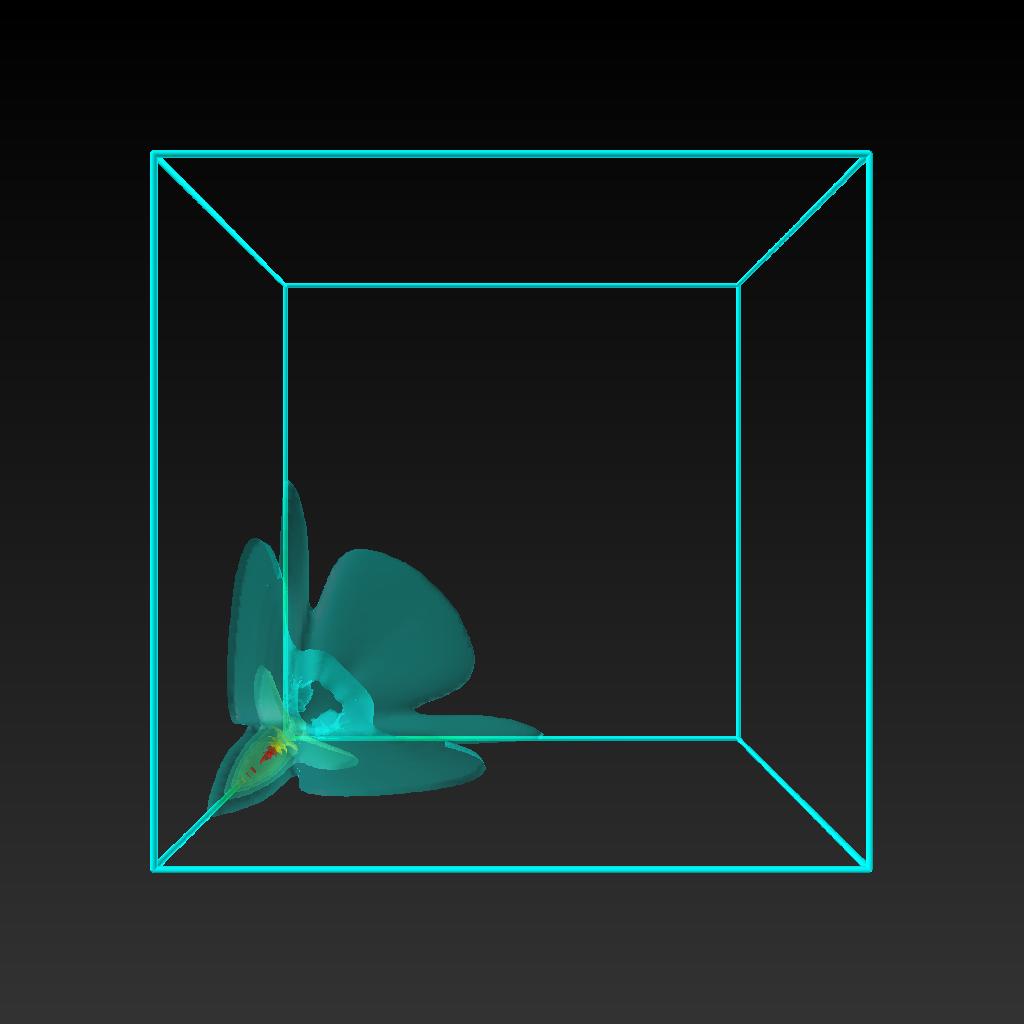
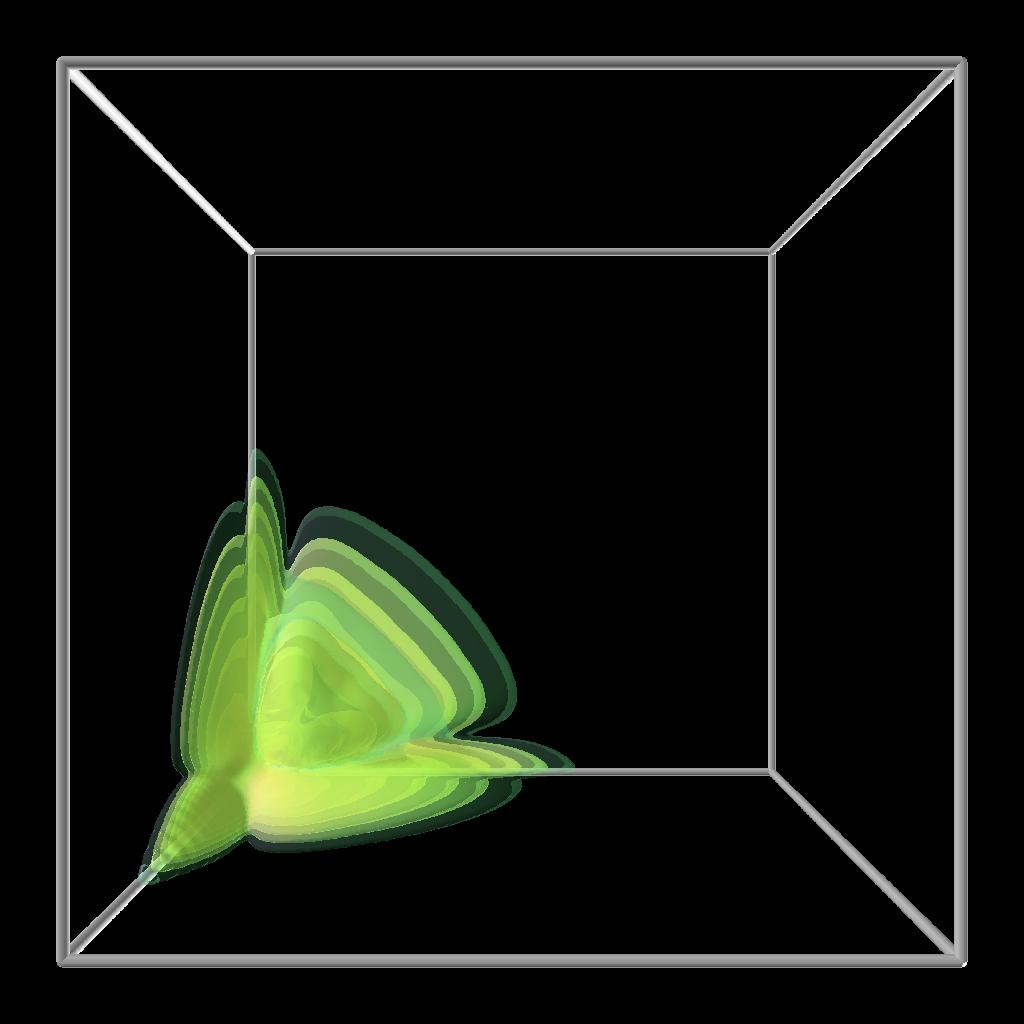
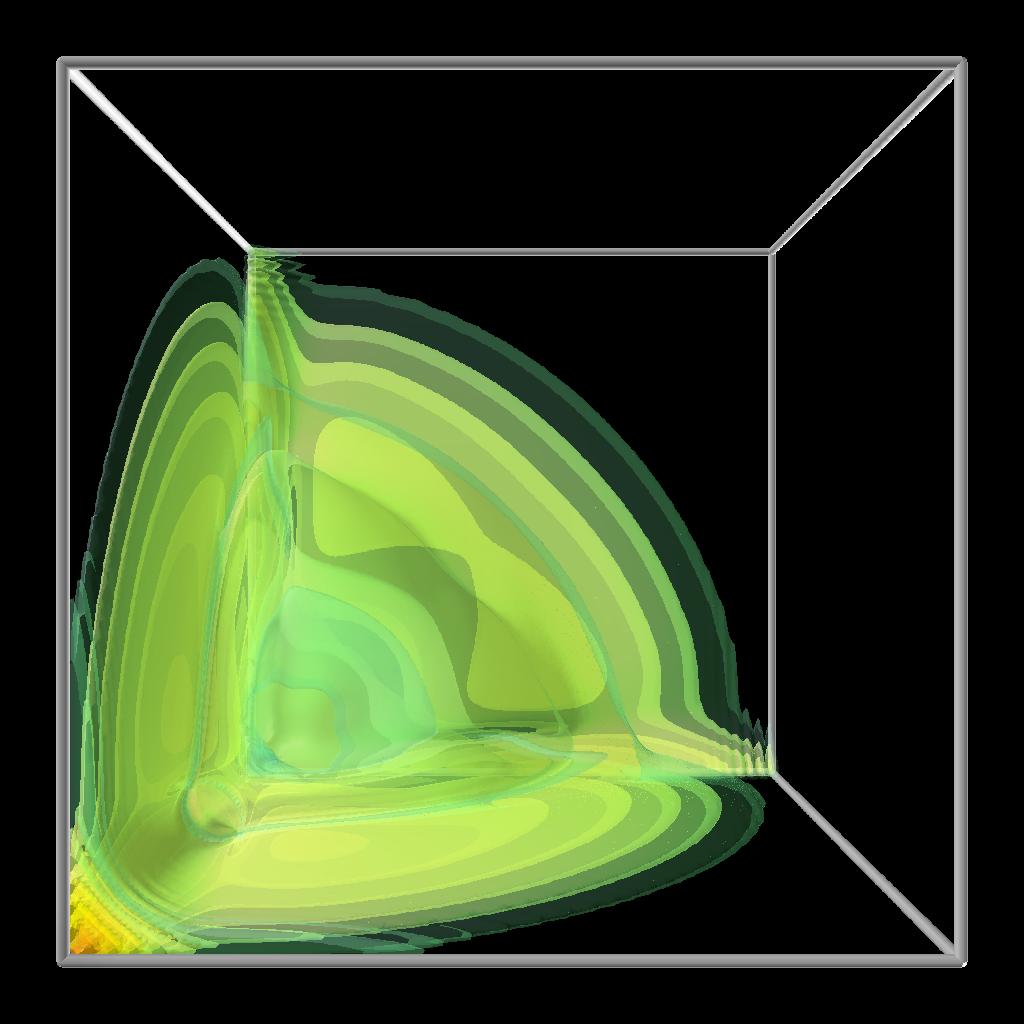
A closer look at some isosurfaces looks really interesting.
|
|
A closer view at the isosurfaces of probability density for the 192^3 data set. MPEG movie of the time evolution (9M) |
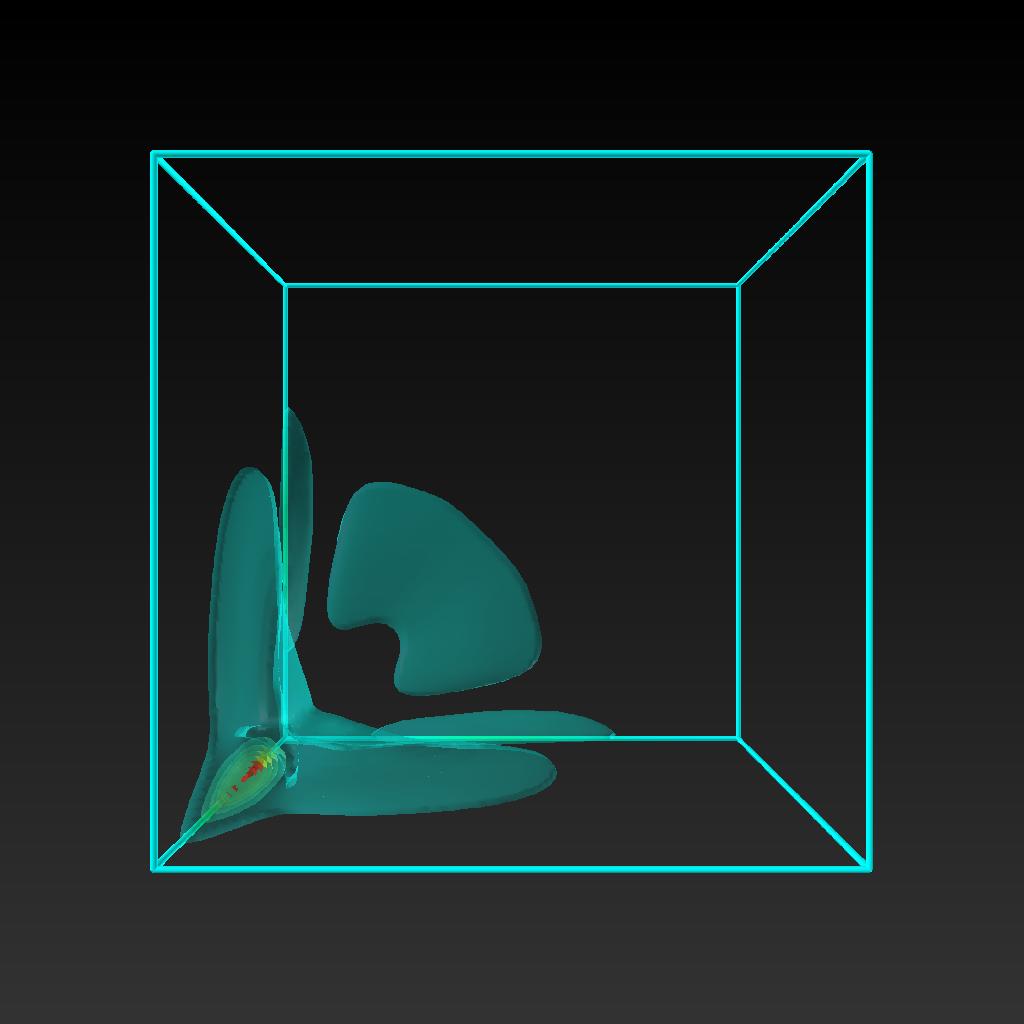
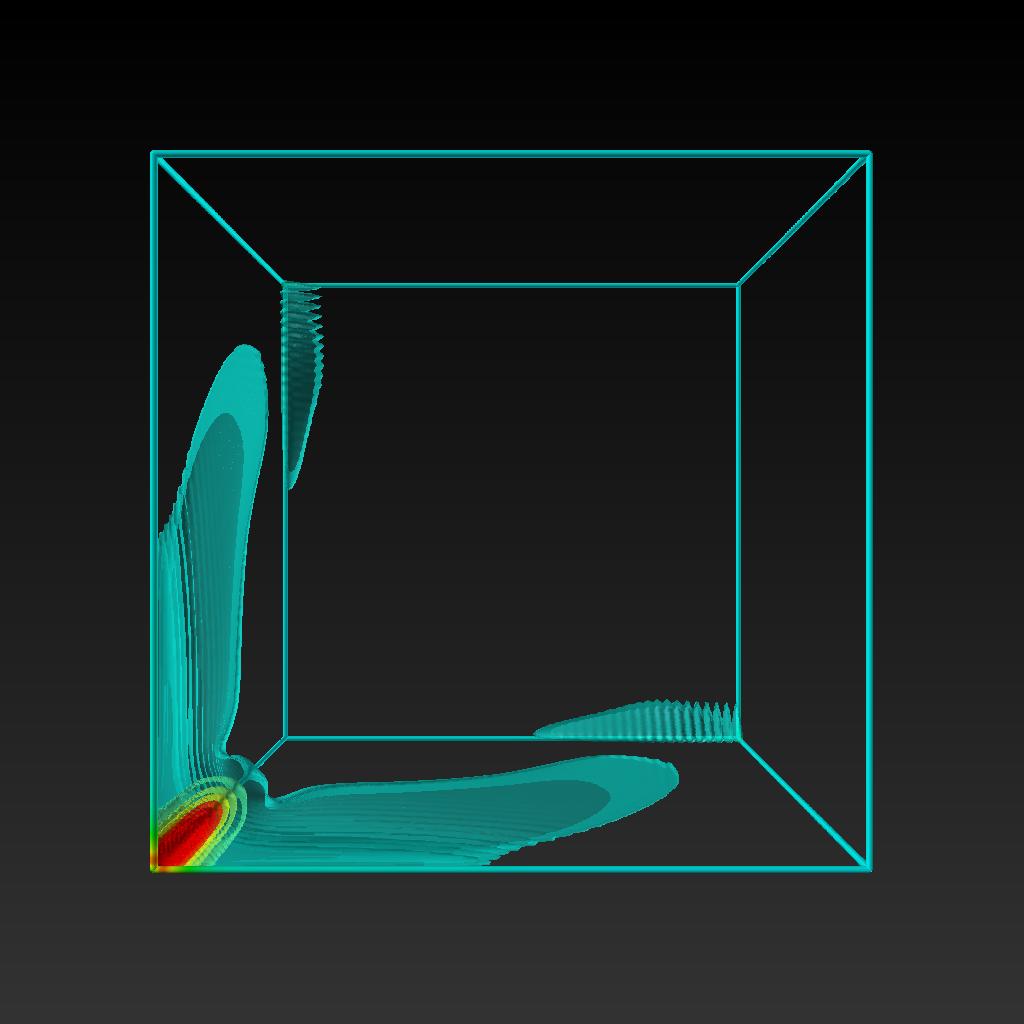
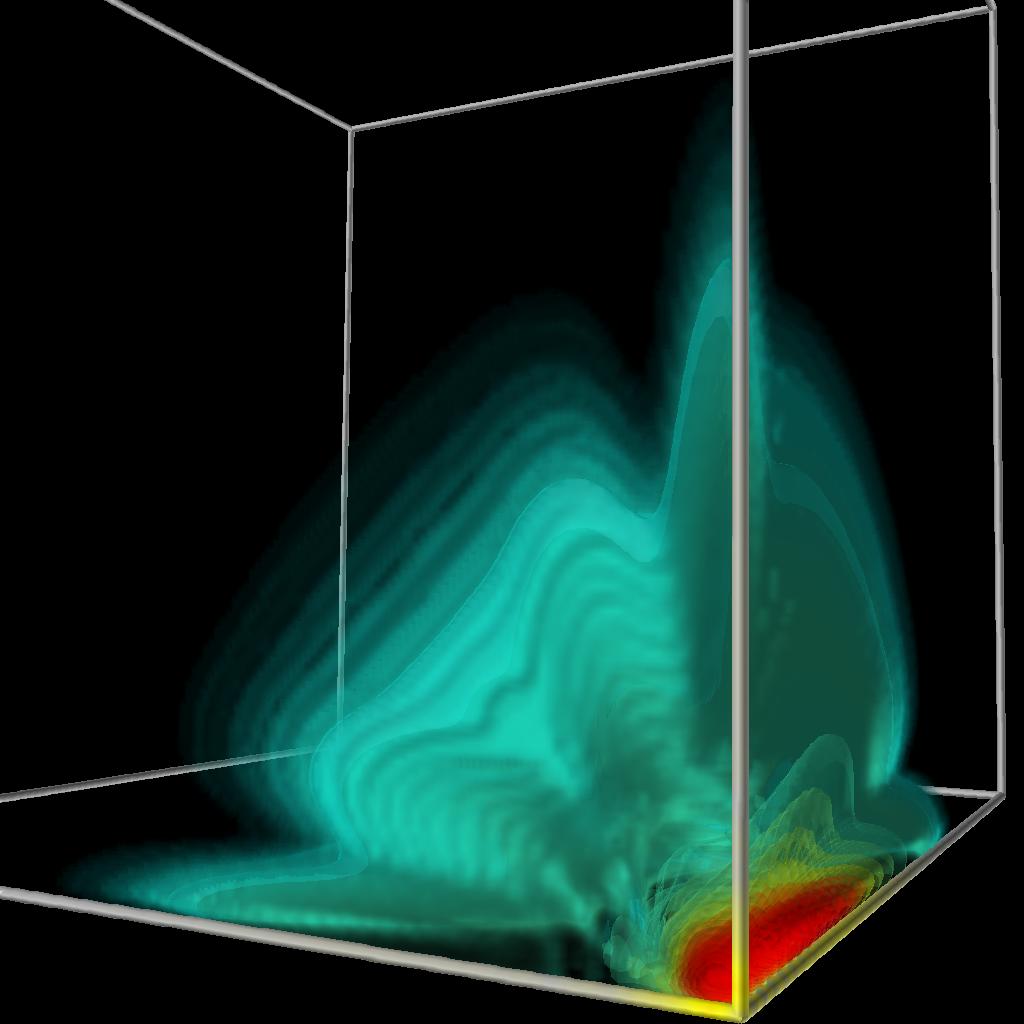
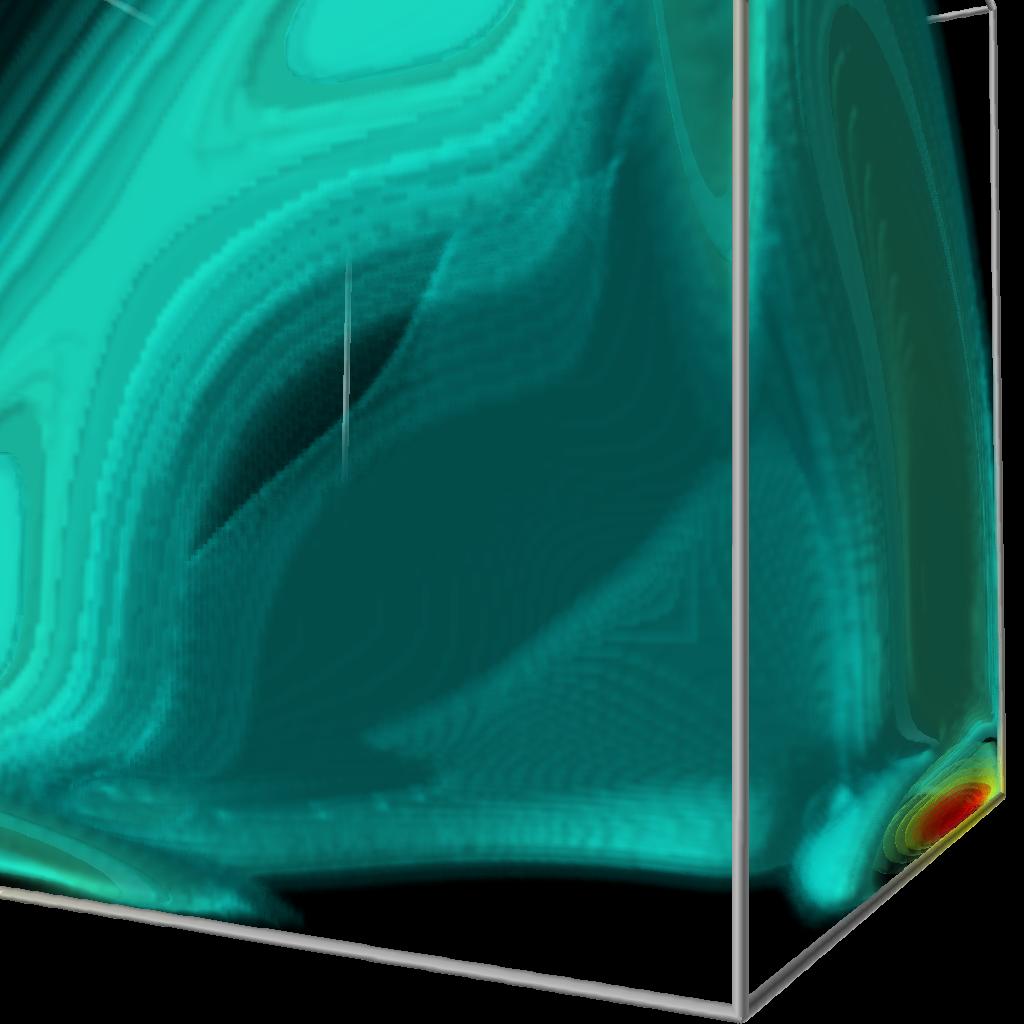
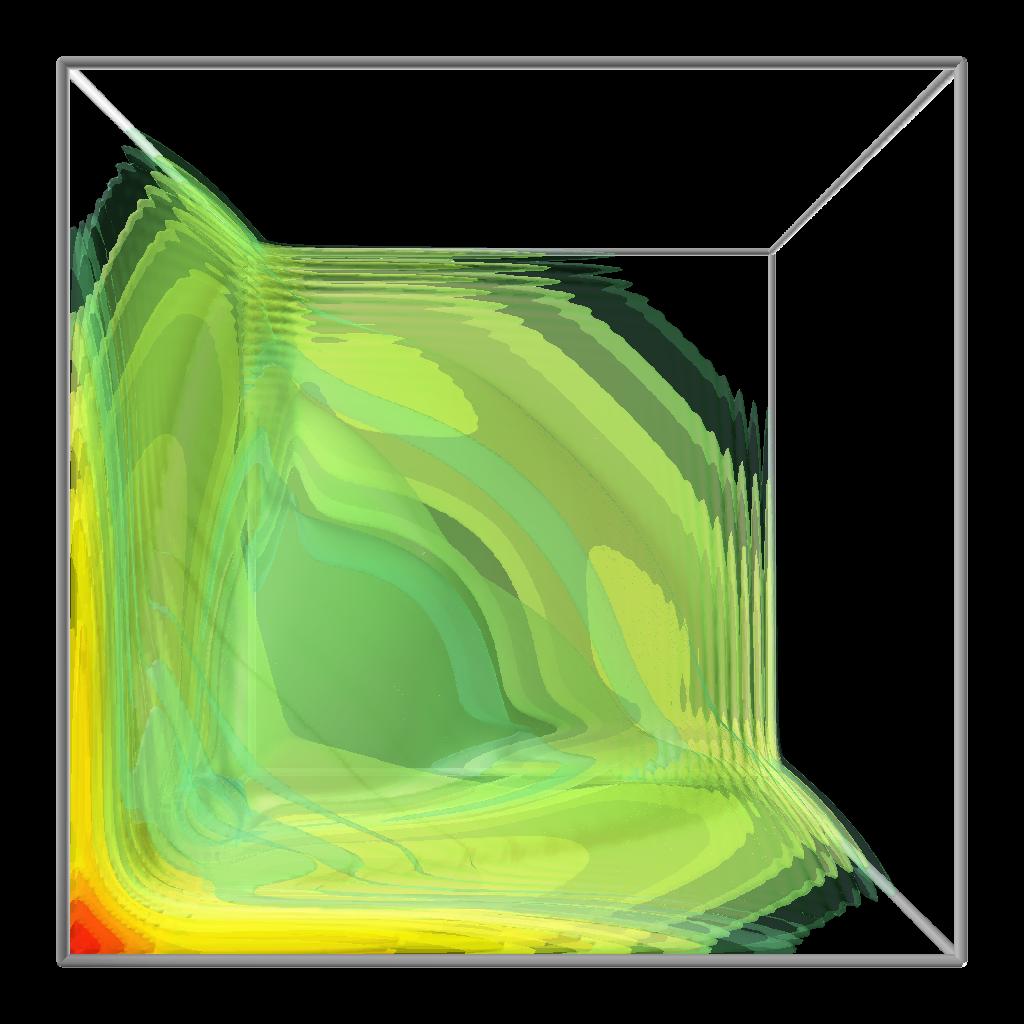
In all of the previous images/movies we were missing some of the scattering processes at lower density values. We used a logarithmic scale and captured all of them.
|
|
Capturing all scattering processes for the scattering of a wavepacek from a Helium atom. MPEG movie of the time evolution (9M) |
References
[1] Triple photoionization of the Lithium atom, J. Colgan, M.S. Pindzola, and F. Robicheaux, Physical Review Letters, 93, 053201 (2004)
[2] Double photoionization of the Hydrogen molecule J. Colgan, M.S. Pindzola, and F. Robicheaux, Journal of Physics B Letters, submitted
[3] Electron impact double ionization of the Helium atom M.S. Pindzola, F. Robicheaux. J. Colgan, M.C. Witthoeft, J.A. Ludlow, Physical Review A 70, 032705 (2004).