This is an archival copy of the Visualization Group's web page 1998 to 2017. For current information, please vist our group's new web page.
Incite 1: Visualization of Electron Walkers Computed by Quantum Monte Carlo Simulation of Energy Pathways in Photosynthesis Reactions
Table of Contents
Introduction
In this article, we show how the NERSC Visualization Group has worked closely with the Quantum Monte Carlo Study of Photoprotection via Carotenoids in Photosynthetic Centers Project at NERSC. The self-guided demonstration will walk you through some of the steps taken by the NERSC Visualization Group during the collaborative effort.
This project, led by William A. Lester, Jr. of LBNL and UC Berkeley, aims to increase understanding of the complex processes which occur during photosynthesis, the process by which plants and bacteria convert the sun's light into energy, taking in carbon dioxide and producing oxygen in the process. This project proposes to investigate the electronic structures behind a defense mechanism within the photosynthetic system that protects plants from absorbing more solar energy than they can immediately utilize, and, as a result, suffering from oxidation damage.
The systems of interest are the light harvesting protein II, LH-II, of Rs. Molischianum, and Photosystem I, PS I, of cyanobacteria. Caroteniods prevent the formation of singlet oxygen molecules by quenching the lowest triplet state of chlorophyll.
3Chl* + 1Car &rarr 1Chl + 3Car*
The main objective of this project is to determine the ground-to triplet-state energy difference of the carotenoids present in LH-II and PS I using Quantum Monte Carlo (QMC) methods. QMC is a stocastic method for solving the Schrödinger equation [1][2].
First Light
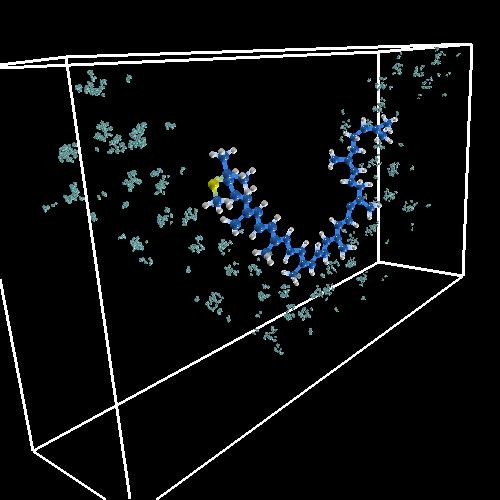
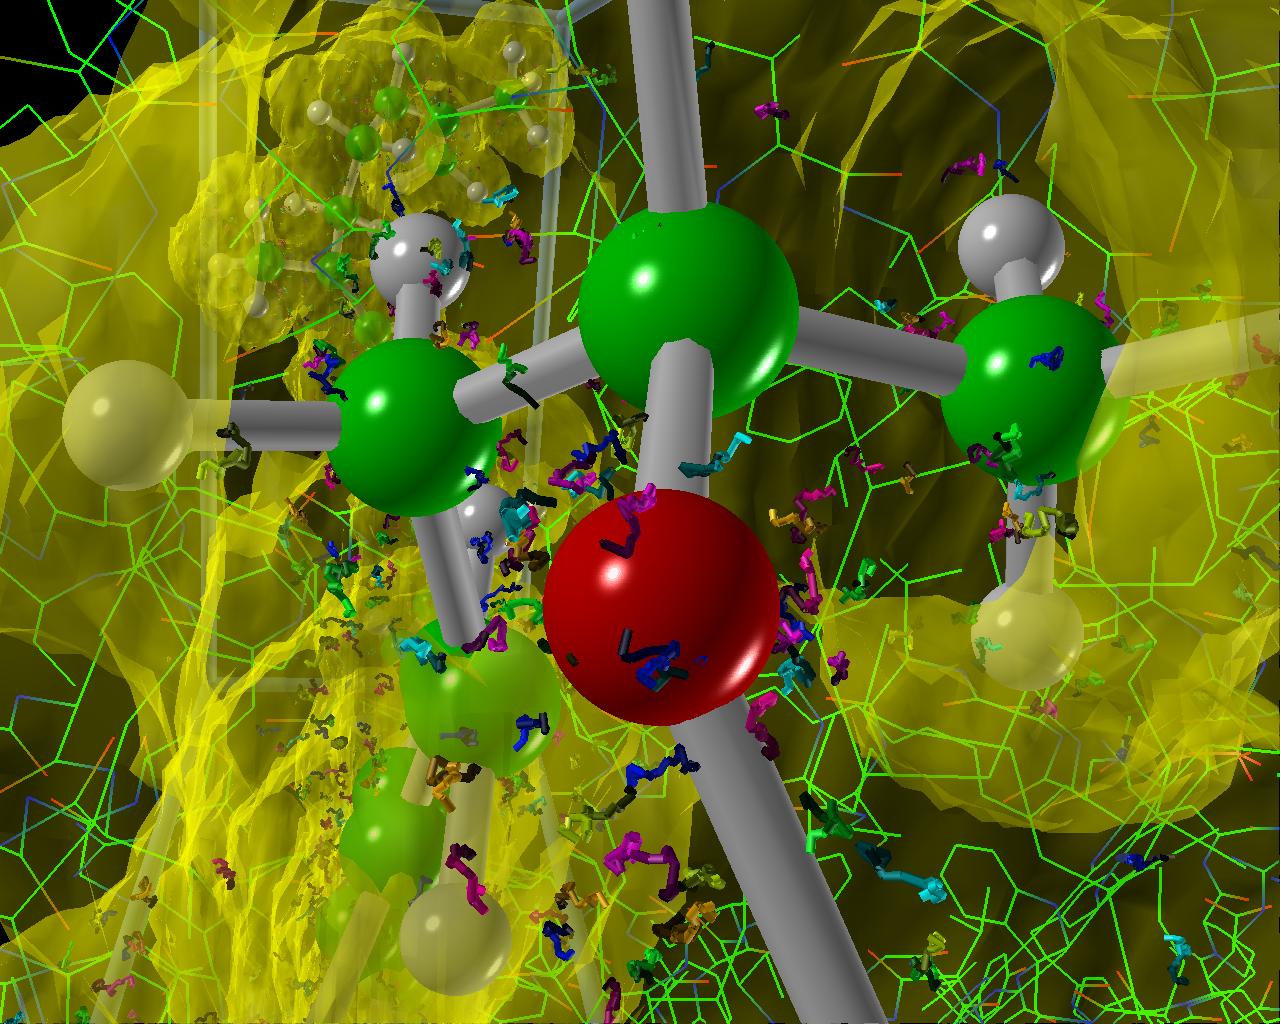
The first step required in the visualization process is to transform data from the form output by the simulation into a form suitable for use by visualization tools. The first data sets that we had were of Variational Monte Carlo walkers for the electron density of Spheroidene (the carotenoid in this case), generated as hdf5 files. Each walker is a snapshot of the configuration of the 3N electronic coordinates (N number of electrons). The idea is to sample electronic density using fictitious kinetics that in the limit of large simulation time yields the density at equilibrium [2]. The random walkers are propagated following a transition probability for a coordinate to move from one position to another. The image below shows our "first light" result, which is used as a "sanity check" to make sure we didn't do anything untoward with the data while reading it in. We obviously had the nuclei and the electrons in different units!
|
| First Light from Incite1: the coordinates are in different units! |
3D Visualization
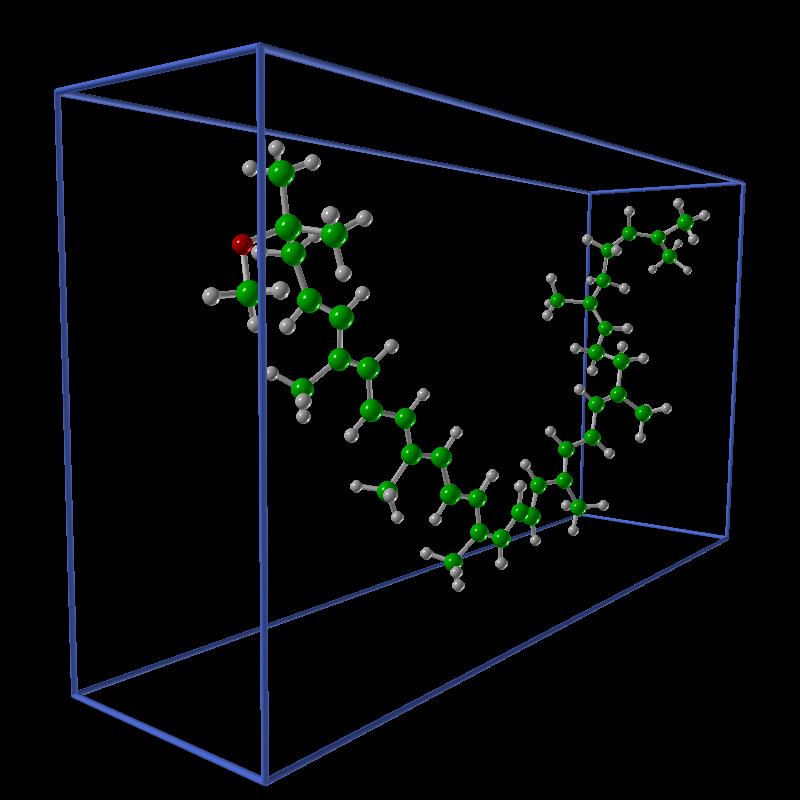
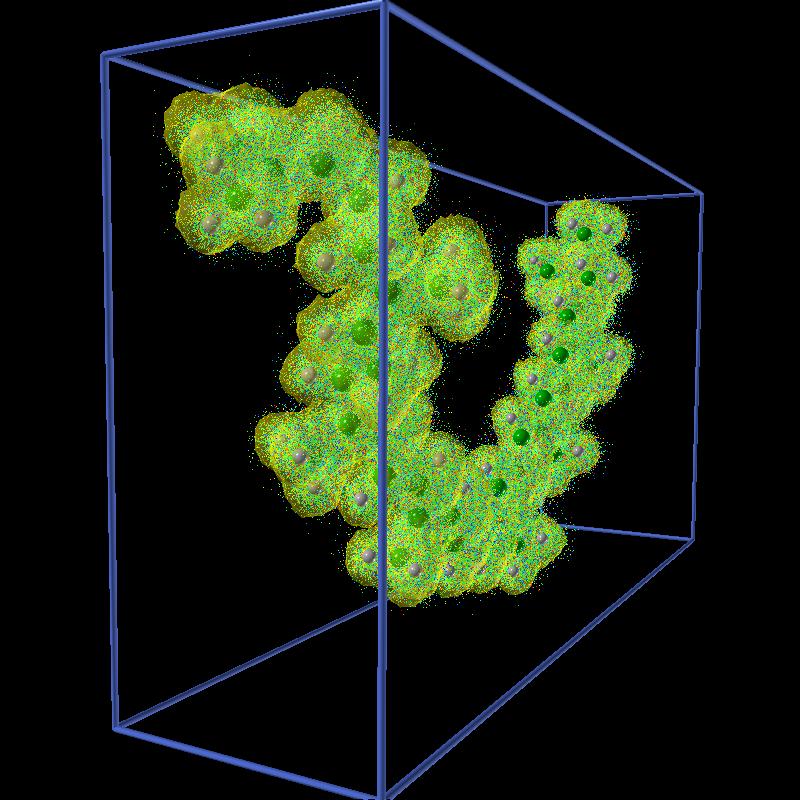
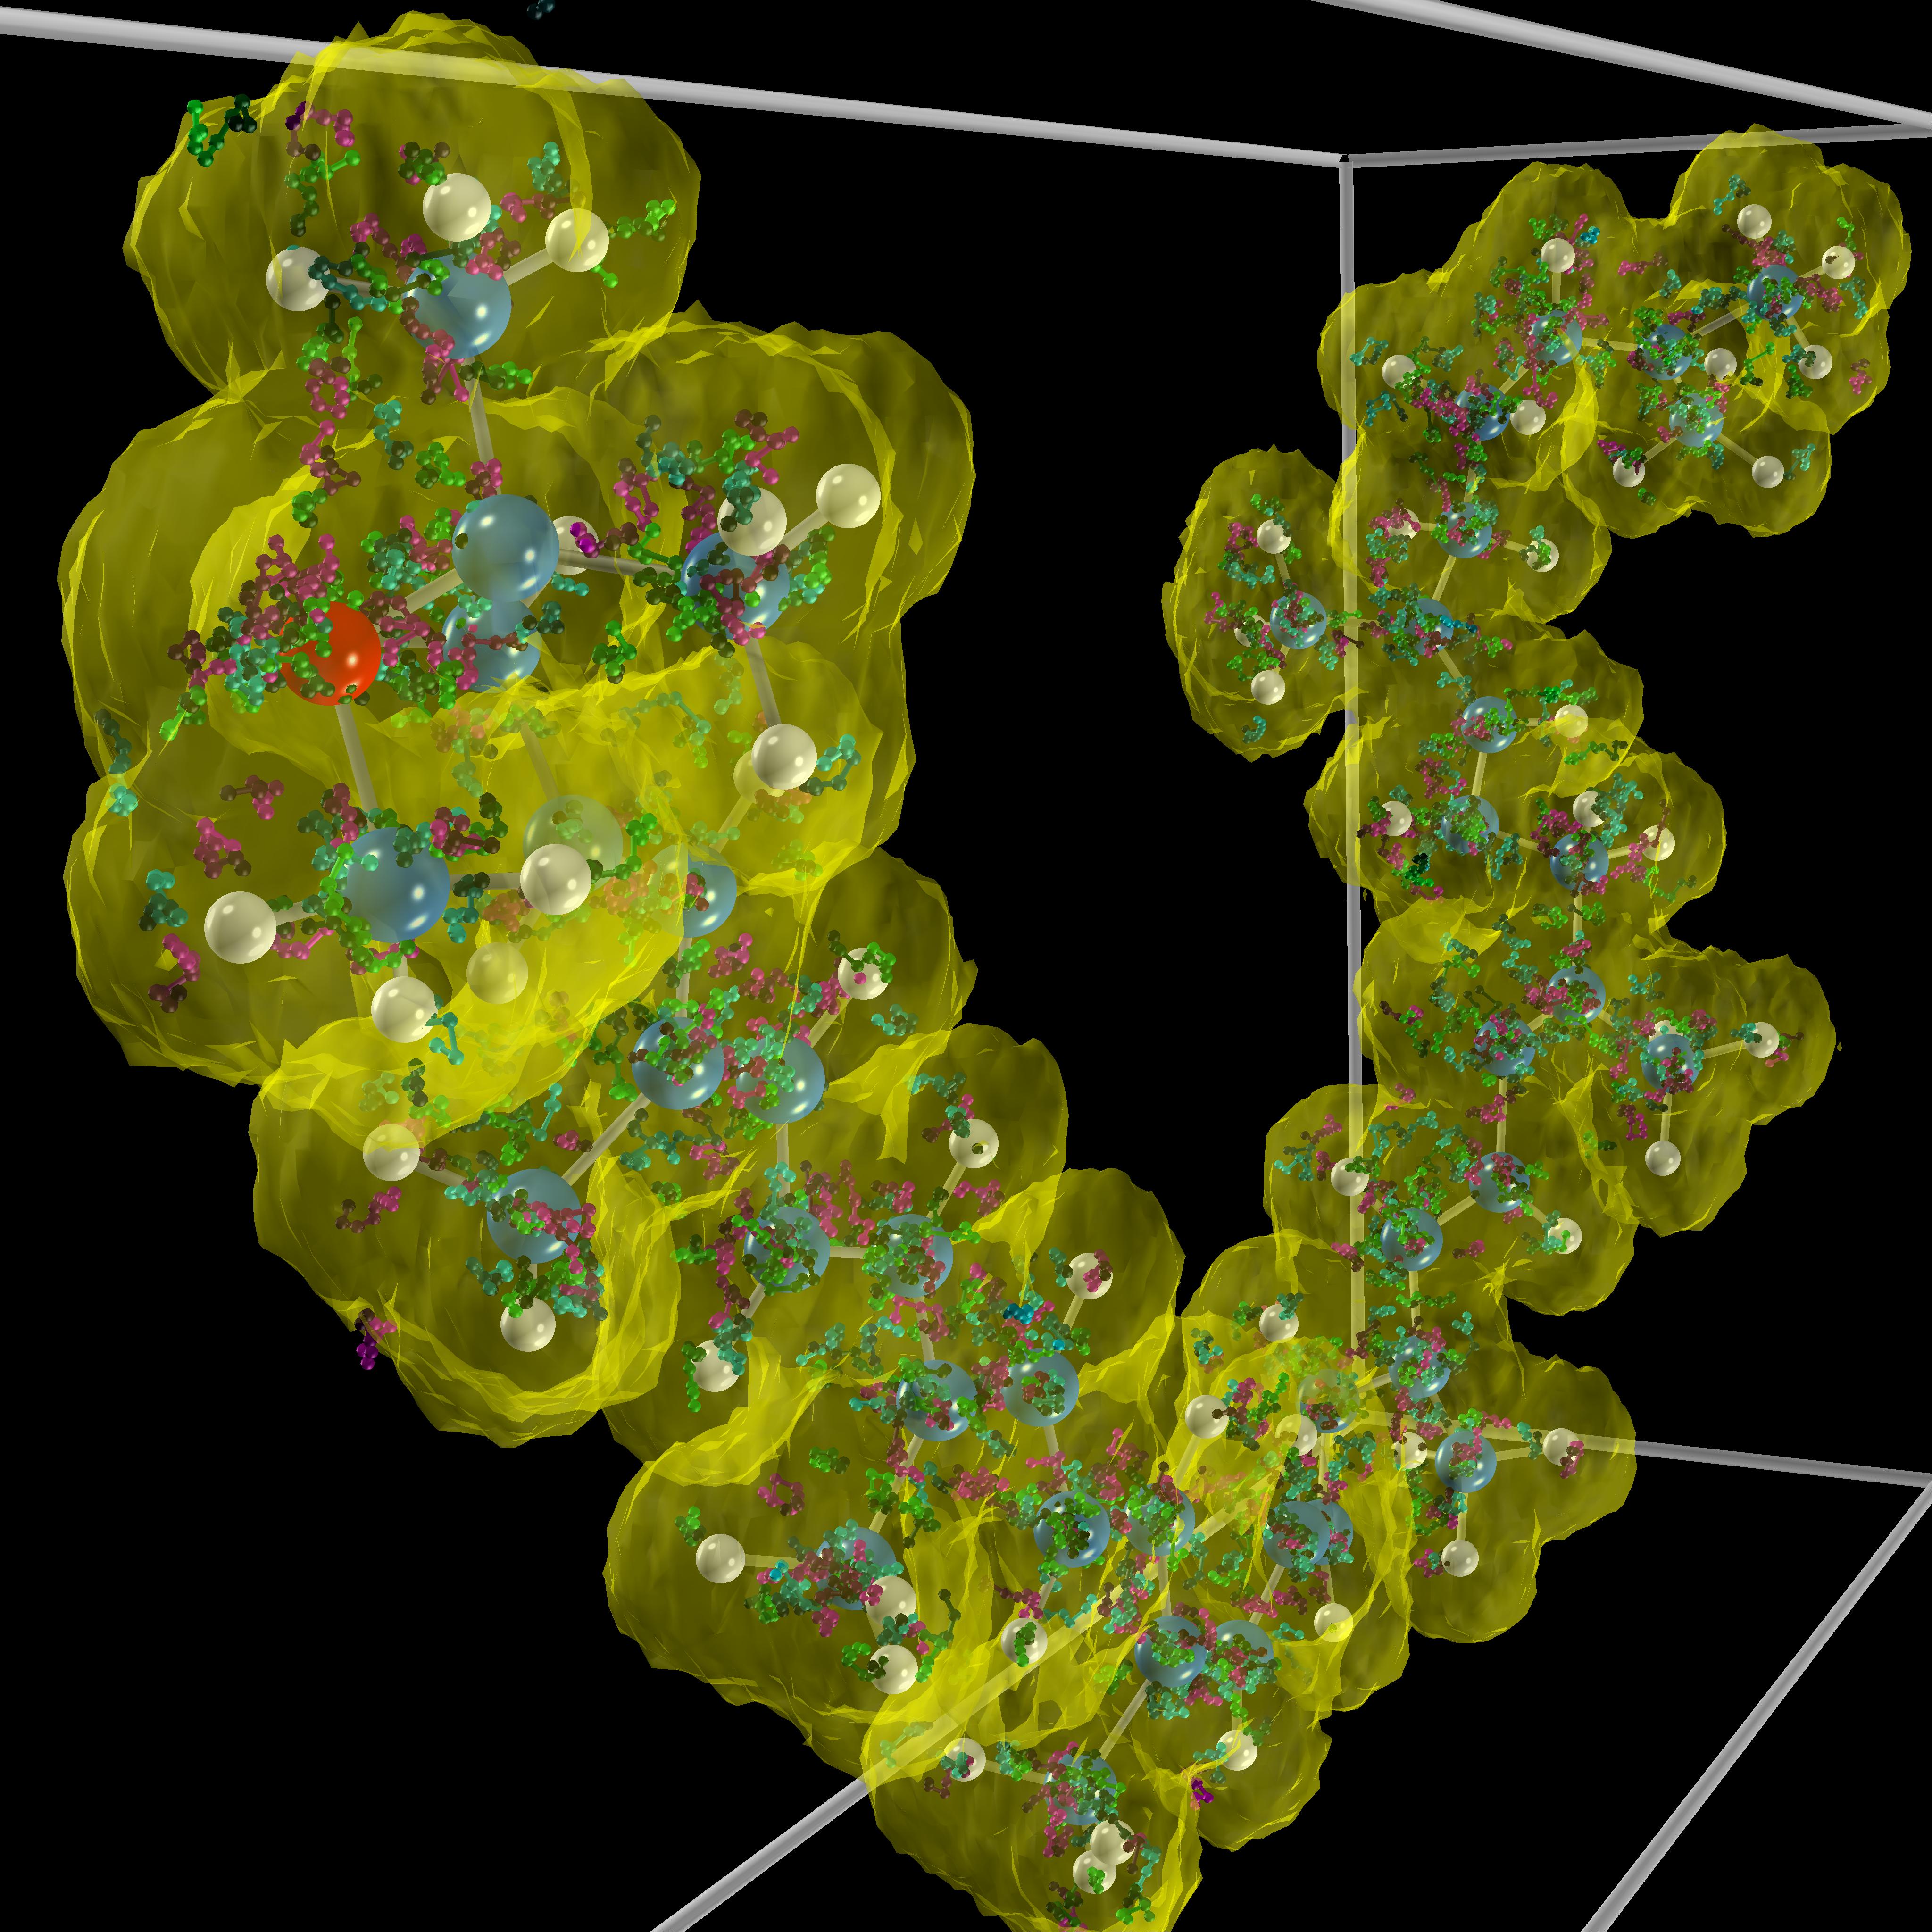
Once we established that we had a correct representation of the system we started to plan more elaborate ways of visualizing the data. The walkers are scattered points in 3D space, we binned them to visualize isosurfaces of electron density as the simulation progresses.
|

|
|
| Spheroidene molecule. | Isosurface of density 1 for the walkers. | All the walkers. |
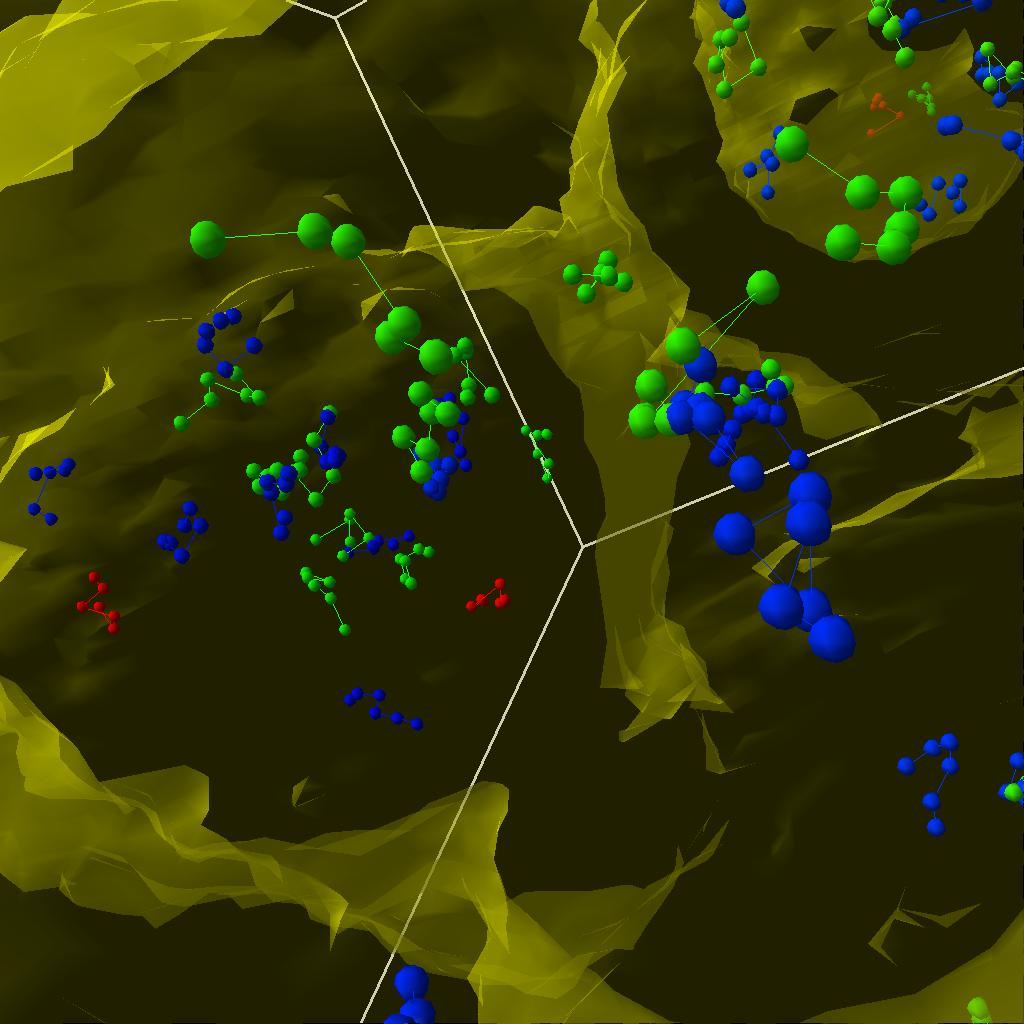
The next step was to follow the walkers along their trajectories. The idea was to make a "tail" that gets darker and more transparent for older positions of the walkers. A tail size of 10 steps seemed like a resonable length.
|
|
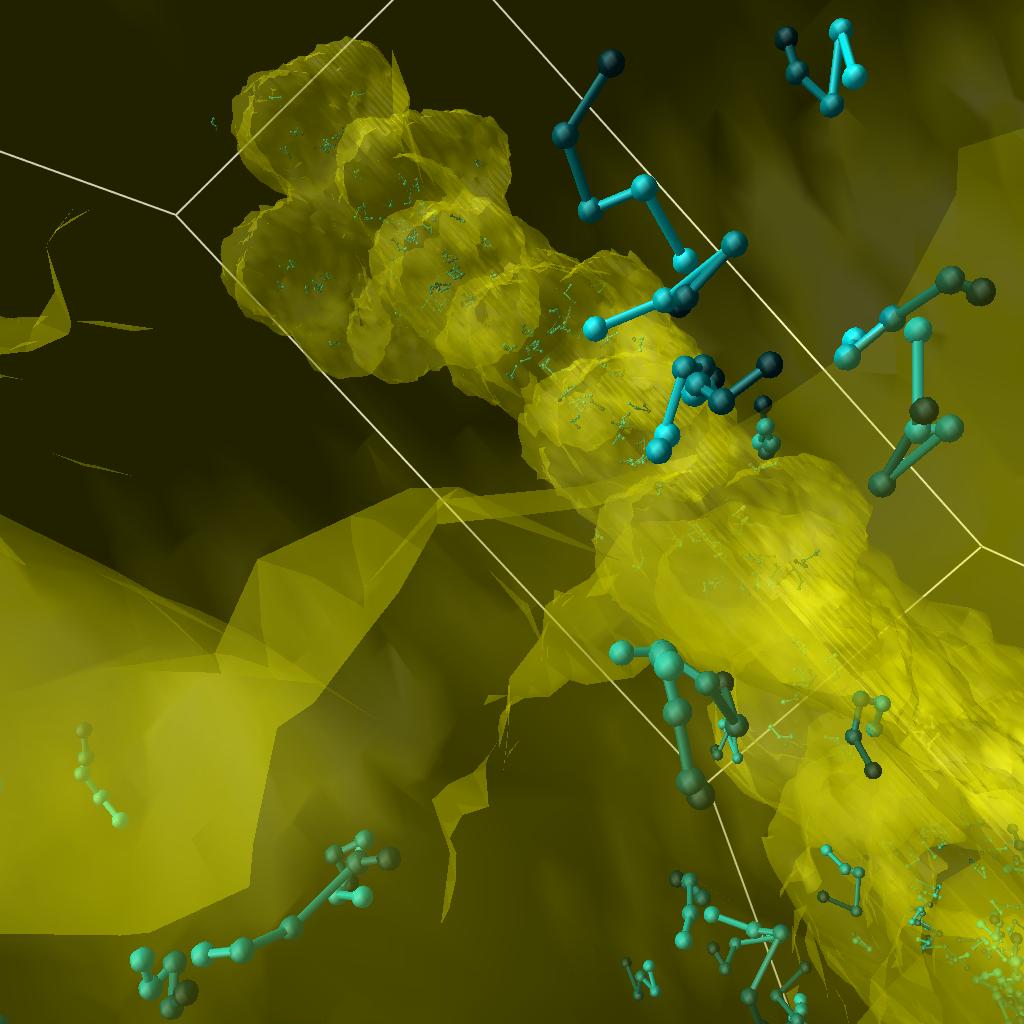
|
| Trajectories, first try. | Fading walkers. | Another view. |
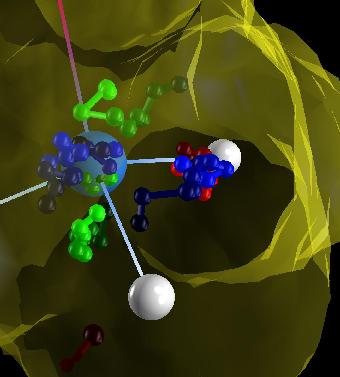
|
| A high resolution view of three walkers colored with different colors. Click on the image to see a 4096x4096 view. |
Adding the chlorophyll molecule completes the picture of the system.
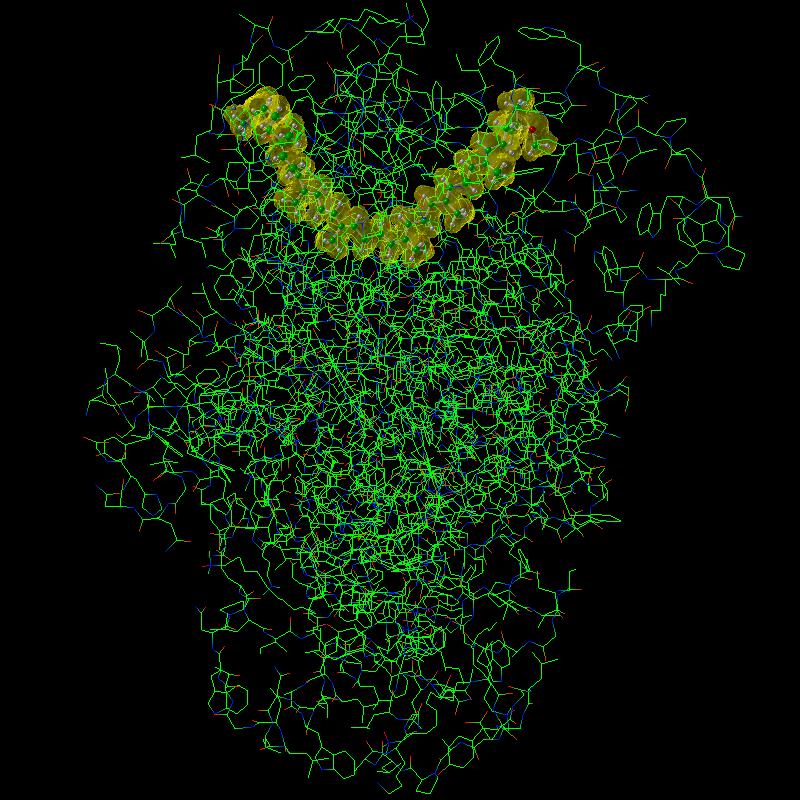
|
| Spheroidene and Chlorophyll system. The Chlorophyll was rendered using a colored stick representation. |
Animations of the evolution of the simulation allow to visualize electron trajectories and analyze their behavior.
|
| Quick Time movie of the walkers moving along their trajectories (54M) |
| MPEG movie of the walkers moving along their trajectories (8.3M) |
Discussion and Next Steps
As we continue working with the Incite 1 group, we will visualize Diffusion Monte Carlo data sets and we will implement an Electron Pair Localization function (EPLF) that describes the pairing of electrons in a molecular system.
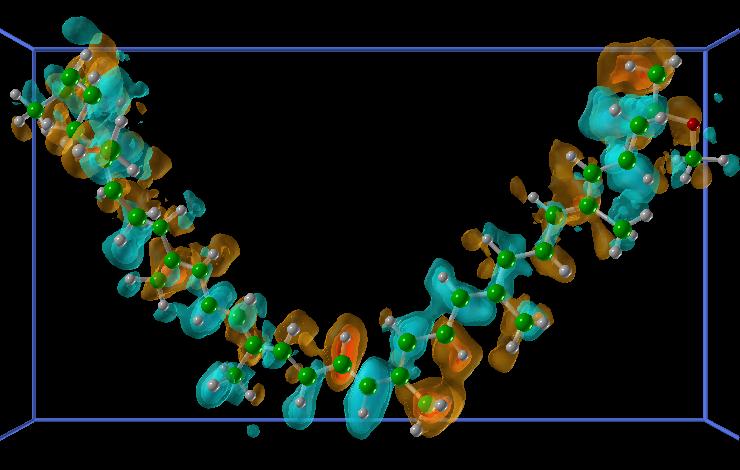
A preliminary visualization of the difference of densities of alpha and beta electrons shows promising results.
|
|
alpha - beta densities, blue is negative, red is positive. MPEG movie of the alpha-beta densities in time (5.4M) |
References
[1] Monte Carlo Methods in Ab Initio Quantum Chemistry, B. L. Hammond, W. A. Lester Jr., and P. J. Reynolds (World Scientific, Singapore, 1994).
[2] A. Aspuru-Guzik and W. A. Lester, Jr. Quantum Monte Carlo methods for
the solution of the Schroedinger equation for molecular systems Handbook
of Numerical Analysis. Handbook of Numerical Analysis, Vol. X. Special
Volume: Computational Chemistry. C. Le Bris, Ed. Elsevier, 2003
, http://www.arxiv.org/abs/cond-mat/0204486