This is an archival copy of the Visualization Group's web page 1998 to 2017. For current information, please vist our group's new web page.
Electron Cloud Visualization
Table of Contents
- Introduction
- 3D Visualization
- Particle Viewer
- Interactive Time Varying, 3D Exploration
- Discussion and Next Steps
- References
Introduction:
The Accelerator modeling SciDAC project works on simulations of particle accelerator beamlines in order to understand beamline behavior and to optimize performance. One area of accelerator modeling focuses on the modeling of proton-electron interactions in the beamline. Electron-cloud-related beam losses and instabilities have been observed in various high-intensity charged-particle storage rings, and have been found to seriously limit their performance. With this effort (code PARSEC) the researcher will be able to self-consistently model this effect by taking into account a realistic (dynamical) beam, and a realistic lattice for the machine. The results are expected to yield more detailed information about the electron-cloud effect, leading to more reliable and effective mitigation mechanisms, and hence to improved operational reliability of the machine.[1]
3D Visualization using AVS/Express
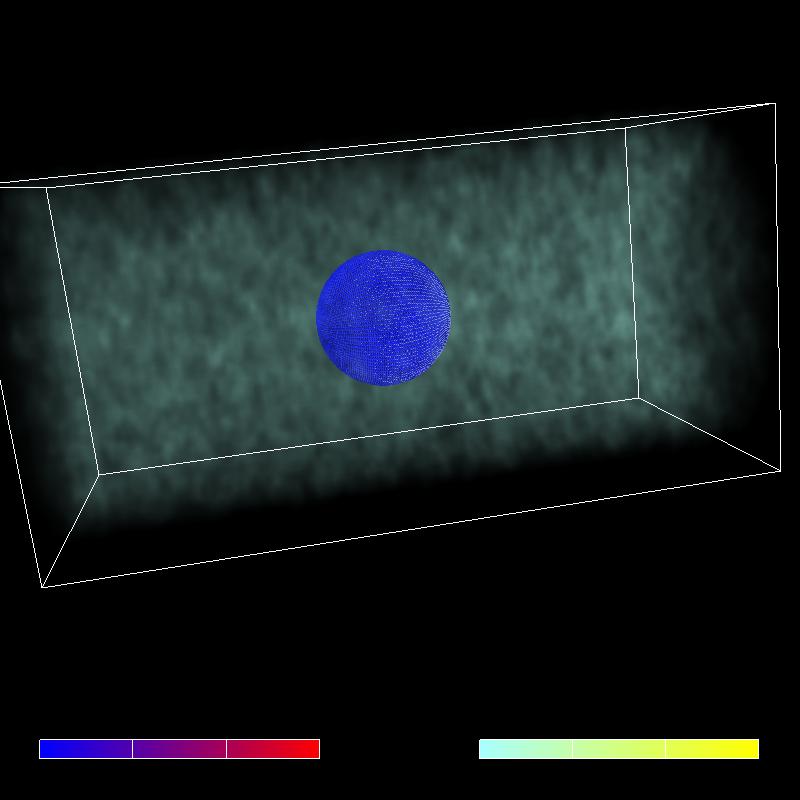
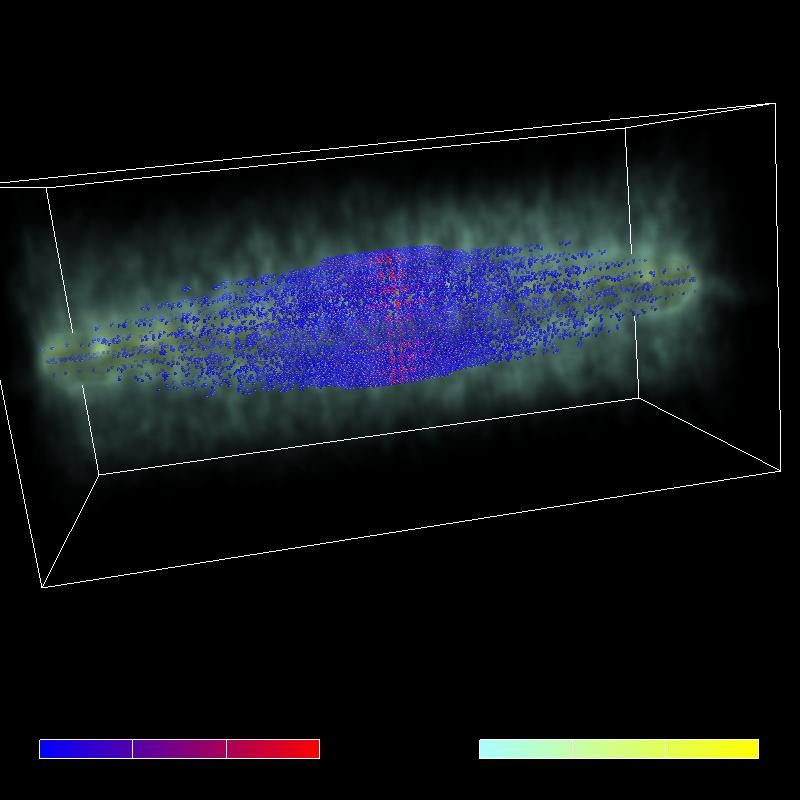
The representation for particles in these beamline simulations is a 6 dimensional dataset composed of 3 spatial dimensions and 3 phase dimensions. The most common method used to inspect the simulation data is to create scatterplots of a subset of these dimensions (eg. plot one of the phase components against the Z-coordinate for each particle in the simulation). The LBNL vis group has worked closely with members of Rob Ryne's team to provide them with advanced 3D methods for understanding their data using AVS/Express. AVS/Express has allowed the group to move beyond simple scatterplots and actually track the movement of groups of particles through the lifetime of the simulation (See Figure1 and Figure 2). However, the scatterplots are still important method for rapid visual inspection of new datasets.
  |
|
Figure 1.Electron cloud visualization: proton beam (rendered as particles) progressing through an electron cloud (volume rendered). MPEG movie (5.8M) |
 i i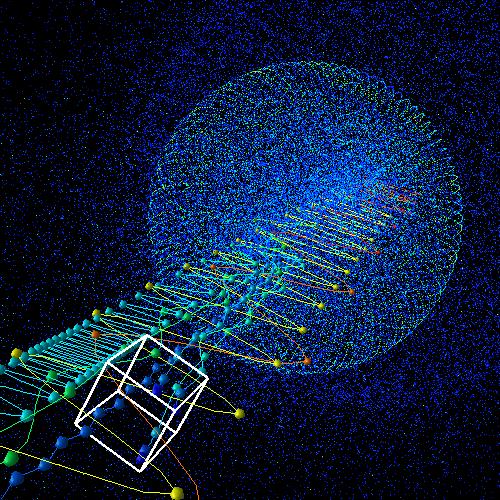 |
| Figure 2. Electron cloud visualization: electron trajectories as the simulation progresses. |
PartView: a particle viewer
AVS/Express offers considerable flexibility for constructing sophisticated visualizations, but often users find the user interface daunting. The PartView tool is designed to provide a straightforward interface that covers the simpler 80% of the kinds of 3D analysis and inspection that the accelerator modeling researchers need in order to understand their dataset. It is consistent with recommendations of the VisGreenbook where scientists indicated a preference for tools that had a user interface that was simpler and customized to their problem over powerful/complex general-purpose user interfaces. The vis group will continue to use more complex tools like Express to provide more sophisticated visualization methods, but the simpler every-day data inspection can be well addressed by a portable, interactive lightweight tool like PartView.
In addition, the particle simulations are scaling up very rapidly and may soon exceed the ability of serial tools like Express to manage the resulting datasets. There is a need for lightweight front-ends application that can tap into remote I/O and rendering services that are located at the site where the datasets are produced. This very same architecture can also be used to connect to running applications for visual inspection of simulations that are in progress. This kind of distributed application approach can offer the interactivity of a desktop tool, but allow users to peruse extremely large remotely located datasets with the same ease as locally downloaded data.
Solution
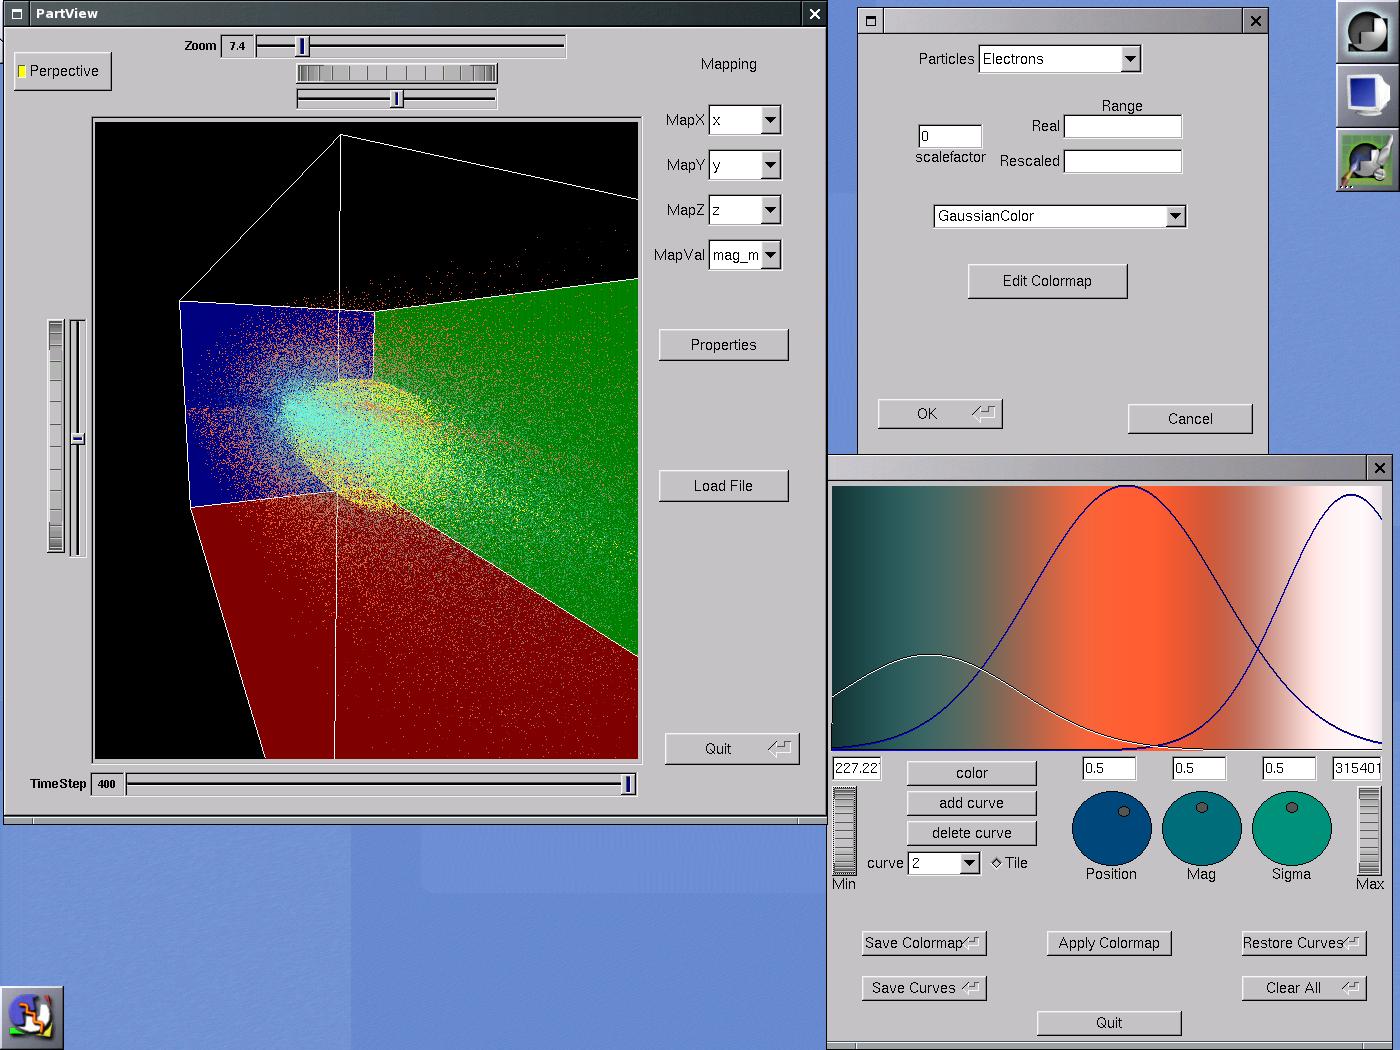
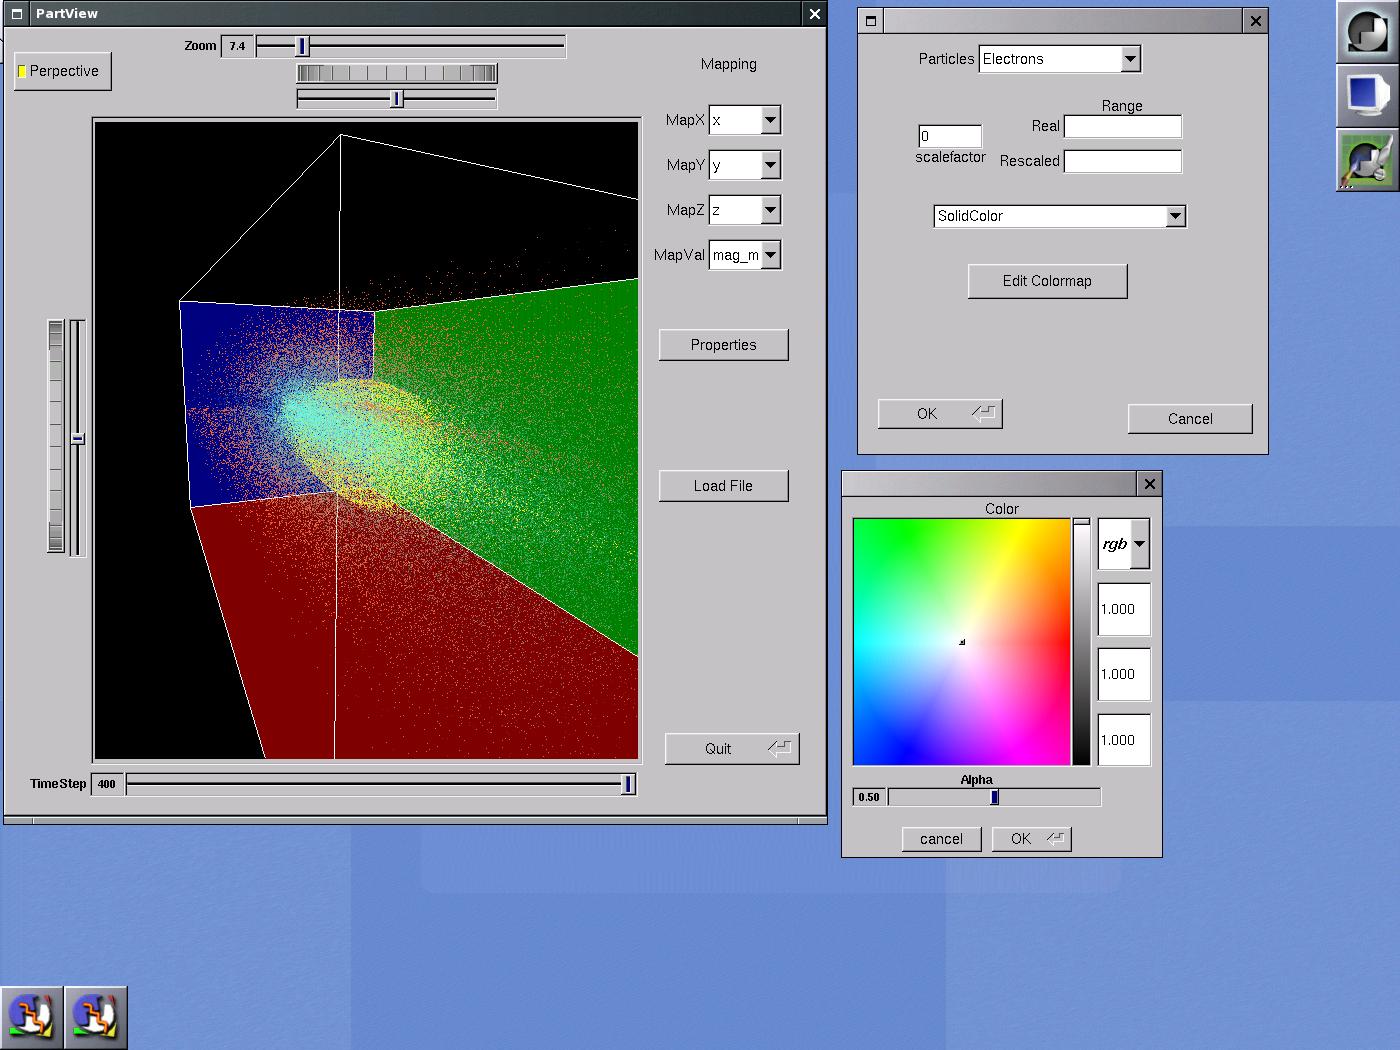
PartView was constructed using FLTK, OpenGL, and HDF5 so that it can easily be compiled on a number of platforms. The tool allows the user to project 6 dimensional data into a 3 dimensional space by selecting which dimensions will be represented spatially and which dimensions are represented as particle attributes (color and transparency currently), and the construction of complex transfer functions for representing the particle attributes. It also allows management of time-series data and two different file formats for storing the particle accelerator data. Figure 3 shows PartView's GUI with the colormap editors (gaussian and solid).
 |
 |
An HDF5-based parallel-I/O library was written in conjunction with this application that allows more than one group in the Accelerator Modeling SciDAC to use this same tool to understand their data. The HDF5 file format will enable the simulations to handle the I/O requirements of simulations that are an order of magnitude larger than is currently reasonable and also support some interoperability between groups with similar needs. The API for the file format has C++, C and Fortran bindings in order to interface with a variety of different codes employed in this area.
PartView has a number of hooks in it that will allow it to connect with a parallel back-end located at NERSC that is able to provide remote file access, progressive streaming of the largest datasets, and even parallel rendering of particle sets in excess of 1Billion particles. This capability is still in development. Currently, the standalone tool is being evaluated by Andreas Adelmann for use with his C++ based modeling/simulation code.
Interactive Time Varying, 3D Exploration
One of our research efforts has been aimed at improving the ability to explore and understand the complex data produced by accelerator modeling simulations. The effort, internally known as "Ppaint," has two main capabilities: (1) it lets the user manually select particles of interest and track them forwards and backwards in time, and (2) it uses a novel visualization technique that aids in understanding features and behavior in the complex data.
Particle Selection
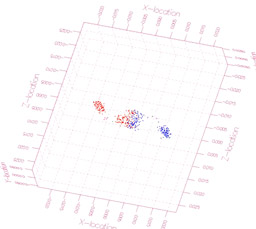
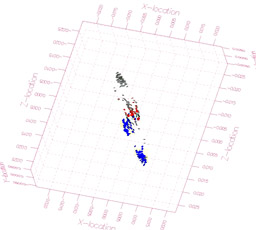
One of the challenges in accelerator modeling is to understand the phonemona that influence beamline behavior. One of the "bad things" that can happen is that the beam becomes "defocused" causing high energy protons to collide with the walls of the accelerator. At best, the beamline becomes less effective, and at worst, the stray particles pose a serious saftey hazard. With PPaint, the researcher is presented with both 2D and 3D projections of time-varying, 6-D data. The 2D views are user-defined: they can choose to plot X against X-phase, X vs. Y, and so forth. In one of the 2D views, a "paintbrush" metaphor is used to "paint" particles of interest. The painting operation is essentially a selection mechanism used to mark a specific set of particles.
The selected particles are color-coded according to a user-selectable hue. The particle colors are then updated in all views. This way, a group of particles that is in a spatially compact region in one projection may appear to be more "spread out" in a different view. New views that may be created will show the same set of particles but in a different projection. The selected particles are tracked by their "social security number," a moniker provided for each particle by the simulation code - all particles have a unique identifier.
|
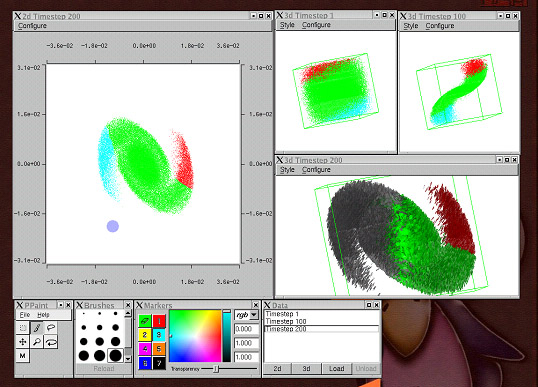
| Ppaint provides the ability to select groups of particles using a "painting metaphor." The research simply "paints" particles that are of interest in one of the 2D projected views. Other views are updated to show the selected particle group in other projections. The selected particles retain their selected status while the researcher browses forwards or backwards in time. This approach helps to facilitate understanding about time-varying particle behavior. |
Domain-specific Visualization
Another of PPaint's features is a novel visualization technique developed especially for the Accelerator Modeling community. The idea is quite simple in concept, yet powerful in effect: each particle consists of a discrete 6D data value - position and orientation. The visualization technique uses an oriented, colored disk glyph for each particle. The position of the center of the disk corresponds to the location of the particle. The orientation of the disk is normal to the 3-component vector of phase space. Different material properties are used for the side of the disk facing towards and away from the phase space direction vector. The result is that particles moving away from the viewer are shown with gray surface colors, while those moving towards the viewer use a color that is one of the paint colors. The particles selected or "painted" in a 2D view are similarly tracked in the disk-based, 3D presentation.
|
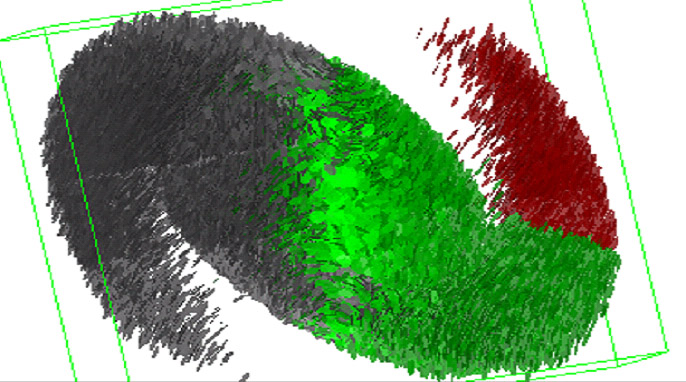
| This image shows a novel visualization technique we created specifically for the Accelerator Modeling community. The technique uses an oriented disk with multiple surface properties to help convey the position, orientation, and motion of particles in a beamline simulation. |
| Click on an image to see the associated MPEG movie. | ||
|---|---|---|
 |
 |
 |
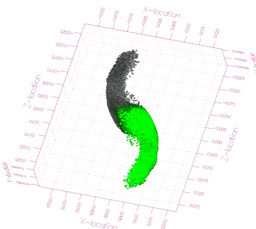
| This movies shows evolution of all particles over time using the disk-glyph method of visualization. | This movie shows evolution of a subset of the particles associated with the halo part of the beamline using point-based glyphs. | Instead of point-based glyphs, this movie shows evolution of the particles in the halo using the glyph-based visualization method. |
Discussion and Next Steps
Over the course of the next year, our primary focus will be on increasing the capability and capacity of these tools. The PartView application is being targeted at simulations that generate 1B particles or more. PPaint is being expanded to include more standard visualization techniques so that it fulfills a broader range of science needs within a single application. These increases in capacity, combined with new visualization capabilities, form a crucial part of the scientific investigation process in DOE's high energy physics science programs.