This is an archival copy of the Visualization Group's web page 1998 to 2017. For current information, please vist our group's new web page.
Table of Contents
- Feature Detection via Integrated Visualization and Analysis
- Visual Presentation of Features Detected via Topological Analysis
- Latency Tolerant Remote Visualization
- Discovering Relationships Between Variables Using Query-Driven Visualization
- Leadership and Project Management
- Production Quality AMR Visualization
- Supernova Spectrum Synthesis Visual Data Analysis
- 3D Line-Integral Convolution Vector Field Visual Data Exploration
- SUNFALL – Production Analytics Pipeline
- Deep Sky Map – Reference Dataset for the Astrophysical Research Community
- Analysis for Climate and Astrophysics
Base
SciDAC/VACET
NERSC Analytics
Base
- Feature Detection via Integrated Visualization and Analysis – The combination
of visualization and analysis with data management, sometimes referred to as
Visual Analytics, holds great potential to accelerate scientific discovery.
Working closely with researchers in life sciences, our team has pioneered a new approach
for visual knowledge discovery that combines traditional visualization, analysis and visual
data mining to aid in discovering the gene regulation relationships in time-varying
gene expression data. Discovering and displaying such relationships is an important
and scientifically valuable form of feature detection. The research
prototype software, PointCloudXplore, is presently in use by Berkeley Lab Life
Sciences researchers and is being adapted for use in other scientific
domains, e.g., Accelerator and Fusion.
Publications:- G. H. Weber, O. Rübel, M.-Y. Huang, A. H. DePace, C. C. Fowlkes, S. V. E. Kerdnen, C. L. Luengo Hendriks, H. Hagen, D. W. Knowles, J. Malik, M. D. Biggin, and B. Hamann, "Visual Exploration of Three-Dimensional Gene Expression Using Physical Views and Linked Abstract Aiews," Accepted for Publication in IEEE Transactions on Computational Biology and Bioinformatics, 2007. (LBNL publication number pending.)
- O. Rübel, G. H. Weber, S. V. E. Kerdnen, C. C. Fowlkes, C. L. Luengo Hendriks, L. Simirenko, N. Y. Shah, M. B. Eisen, M. D. Biggin, H. Hagen, J. D. Sudar, J. Malik, D. W. Knowles, and B. Hamann, "PointCloudXplore: Visual Analysis of 3D Gene Expression Data Using Physical Views and Parallel Coordinates," in Data Visualization 2006 (Proceedings of EuroVis 2006), B. S. Santos, T. Ertl, and K. Joy, Eds., Aire-la-Ville, Switzerland, 2006, pp. 203-210. LBNL-60005.
- O. Rübel, G. H. Weber, M.-Y. Huang, E. W. Bethel, M. D. Biggin, C. C. Fowlkes, C. L. Luengo Hendriks, Member, IEEE, S. V. E. Kerdnen, M. B. Eisen, D. W. Knowles, J. Malik, H. Hagen, and Bernd Hamann, "Integrating Data Clustering and Visualization for the Analysis of 3D Gene Expression Data ," Submitted to IEEE Transactions on Computational Biology and Bioinformatics, 2007.
- M.-Y. Huang, O. Rübel, G.H. Weber, C.L. Luengo Hendriks, M.D. Biggin, H. Hagen, B. Hamann. "Segmenting Gene Expression Patterns of Early-stage Drosophila Embryos.", In: L. Linsen, H. Hagen, B. Hamann, eds., Mathematical Methods for Visualization in Medicine and Life Sciences. Springer-Verlag, Heidelberg, Germany. 2007. LBNL-62450.
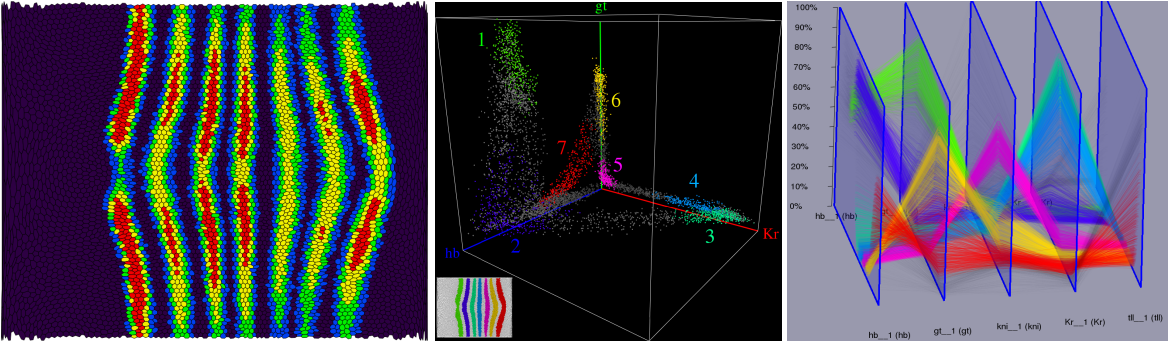
(Left) Classification of the expression pattern of even skipped (eve). Clustering detects the seven stripes of the eve pattern and also reveals variations that occur within a single stripe. (Middle) Each stripe of the eve pattern is marked by one cluster (bottom left). The clusters are then highlighted in a scatter-plot of the genes Krüppel (Kr), hunchback (hb), and giant (Gt). Large differences between the stripes can be seen. The available data has implicated gt, hb, and Kr in controlling some stripes, but the scatter-plot suggests that these factors have the potential to each regulate all stripes by their unique combinations of expression levels. (Right) 3D parallel coordinates – with lines sorted according to physical cell positions – allow analysis of expression characteristics of the stripes in many gene dimensions. 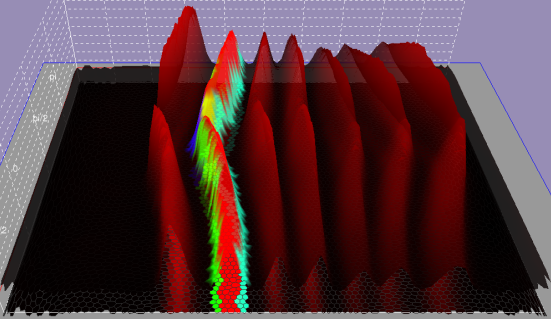
Surface plot of eve. By using the regulators gt, hb, and Kr of eve as input to data clustering, we see in the second stripe that different portions of this stripe are regulated by different genes. - Visual Presentation of Features Detected via Topological Analysis –
In response to the desire to increase scientific understanding through visual data
analysis of very large and complex datasets, our team has developed a novel technique
for effectively presenting the results of features detected through topological analysis.
Unlike traditional visualization techniques, which are not capable
of presenting a complete view of a function or field, topological analysis
provides a complete study of the variation of a function or field and describes all
its features and their location in space either in terms of critical points or interms
of entire regions. The breakthrough of this new work is a novel presentation technique
that makes abstract topological analysis more visually accessible by using
a familiar landscape presentation metaphor.
Publications:- G. H. Weber, P.-T. Bremer, and V. Pascucci. "Topological Landscapes: A Terrain Metaphor for Scientific Data," Accepted for Publication in IEEE Visualization 2007, Transactions on Visualization and Computer Graphics, 2007. (LBNL publication number pending.)
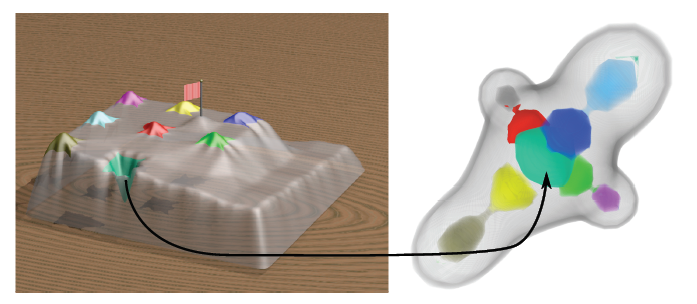
Methane dataset.
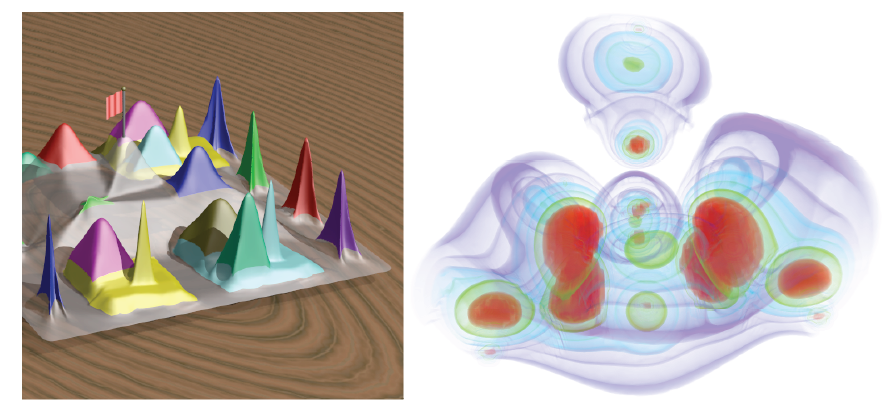
Electron density dataset.These images show traditional volume rendering of electron density in methane (top) and a protein molecule (bottom) along with the landscape presentation of topological analysis data. In the methane dataset, each region containing a critical point is colored according to region membership in both the volume rendering and the topological landscape presentation. In the volume rendering of the protein molecule electron density, colors indicate scalar magnitude while color in the topological landscape indicates region membership. The topological landscape presentation offers better visual presentation capabilities that aid in understanding relationships between topologically based features than previous approaches, thereby increasing the potential for scientific insight in large and complex datasets. - Latency Tolerant Remote Visualization –
One of the fundamental problems in remote visualization - where I/O and data intensive visualization activities take place at a centrally located supercomputer center and resulting imagery is delivered to a remotely located user - is reduced interactivity resulting from the combination of high network latency and relatively low network bandwidth. This research project has produced a novel approach for latency-tolerant delivery of visualization and rendering results where client-side frame rate display performance is independent of source dataset size, image size, visualization technique or rendering complexity. As such, it is a suitable solution for remote visualization image delivery for any visualization or rendering application that can generate image frames in an ordered fashion. This new capability is suitable for use in addressing many of ASCR's remote visualization needs, particularly deployment at open computing facilities to provide remote visualization capabilities to teams of scientific researchers.
Publications:- J. Chen, I. Yoon and E. W. Bethel. "Interactive, Internet Delivery of Visualization via Structured, Prerendered Multiresolution Imagery." Accepted for publication, to appear in IEEE Transactions on Visualization and Computer Graphics (2008). LBNL-62252.
- J. Chen, I. Yoon, E. W. Bethel. "Interactive, Internet Delivery of Scientific Visualization via Structured, Prerendered Imagery." In Proceedings of the 2006 SPIE/IS&T Conference on Electronic Imaging, Volume 6061, A 1-10, 2006. LBNL-57528.

An end-to-end view of our image delivery implementation. First, a visualization application creates an ordered set images corresponding to prescribed changes in viewpoint, time, or other attribute suitable for remote client browsing. Next, a preprocessing step - shown here as "Encoder" - creates a "map file" and tiled versions of the images. A remote custom client contacts a normal web server, downloads the map file, then begins navigation through the ordered sequence of images. The client requests images through the web server as needed to satisfy a particular viewpoint, time step or other browsable attribute. This implementation is suitable for use with any visualization or rendering application that can of generate images in an ordered fashion. - Discovering Relationships Between Variables Using Query-Driven Visualization – One fundamental element of scientific inquiry is discovering relationships, particularly the interactions between different variables in observed or simulated phenomena. Building upon our prior work in the field of Query-Driven Visualization, where visual data analysis processing is focused on subsets of large data deemed to be "scientifically interesting," this new work focuses on a novel knowledge discovery capability suitable for use with petascale class datasets. It enables visual presentation of the presence or absence of relationships (correlations) between variables in data subsets produced by Query-Driven methodologies. This technique is particularly useful for gaining knowledge from datasets currently emerging from SciDAC and INCITE projects. It is sufficiently generally to be applicable to any time of complex, time-varying, multivariate data from structured, unstructured or adaptive grids.
- L. Gosink, J. Anderson, E. W. Bethel, K. Joy. "Variable Interactions in Query-Driven Visualization." IEEE Visualization 2007, Transactions on Visualization and Computer Graphics. (Accepted for publication) LBNL-63254.
Publications:
|
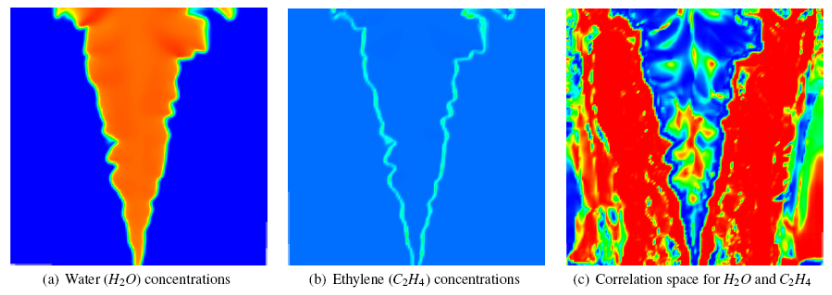
| Water and ethylene concentrations from a methane combustion dataset are shown in (a) and (b), respectively. The derived correlation field for these two compounds is shown in (c). The switch from strong positive correlation to strong negative correlation in the reaction region corresponds to the area in which ethylene is both produced and consumed, and water is produced, in the process of combustion. The strong correlation (both positive and negative) in the center of the flame, as well as the atmospheric region, demonstrates the correlation field's ability to show fine-scale interactions. |
|
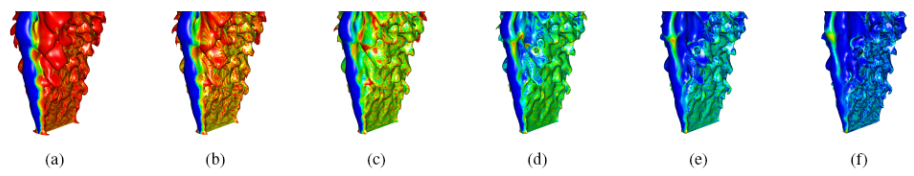
| These images depict increase ((a) through (f)) isosurface values of temperature (isotherms) colored by values of the correlation field derived from water and ethylene. As temperature values increase, the predominant correlation between water and ethylene along the isotherms shifts away from strongly positive (red in (a)) to strongly negative (blue in (f)). This shift suggests that temperature is itself negatively correlated with the water-ethylene correlation. |
VACET
- Publications: approximately 20 journal articles in the visualzation and graphics field's premier forums.
- VACET's parallel-capable software infrastructure, which includes features desired by science stakeholders, deployed at NERSC/LBNL and CCS/ORNL for use by a broader science community.
- Active outreach, including a strong presence at the SciDAC 2007 meeting in Boston, contributions to the SciDAC Review magazine and ASCR Discovery website.
- Project website (www.vacet.org) for public consumption and wiki (http://www.sci.utah.edu/vacetwiki/) for internal use.
- Activities coordinated with other SciDAC Centers, Institutes and Science Applications have produced meaningful contributions and measureable positive impact for the SciDAC program as a whole: top quality publications, production-quality visual analysis software infrastructure deployed at DOE's Open Computing facilities, leadership of meaningful and impactful visual data analysis activities in DOE.
Publications:
- G.H. Weber, V. Beckner, H. Childs, T. Ligocki, M. Miller, B. van Straalen, E.W. Bethel. "Visualization Tools for Adaptive Mesh Refinement Data." In: W. Benger, R. Heinzel, W. Kapferer, W. Schoor, M. Tyagi, S. Venkataraman, G.H. Weber, eds., Proceedings of the 4th High End Visualization Workshop (Tyrol Austria, June 18-22, 2007). ISBN 978-3-86541-216-4, Lehmanns Media, pp. 12-25, 2007. LBNL-62954.
|
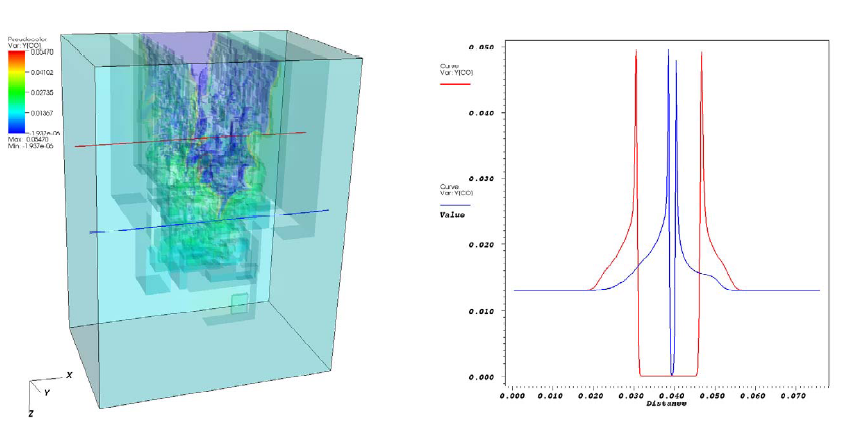
| VisIt is a production quality, parallel capable AMR visualization tool that runs on all modern computational platforms, including IBM's BG/L, Cray XT3/4, and Linux clusters. This example shows direct volume rendering of AMR data, with an x/y plot comparing two subsets taken from the 3D data. This full-featured software is in use by multiple DOE science projects that use AMR-based solvers. |
|
|
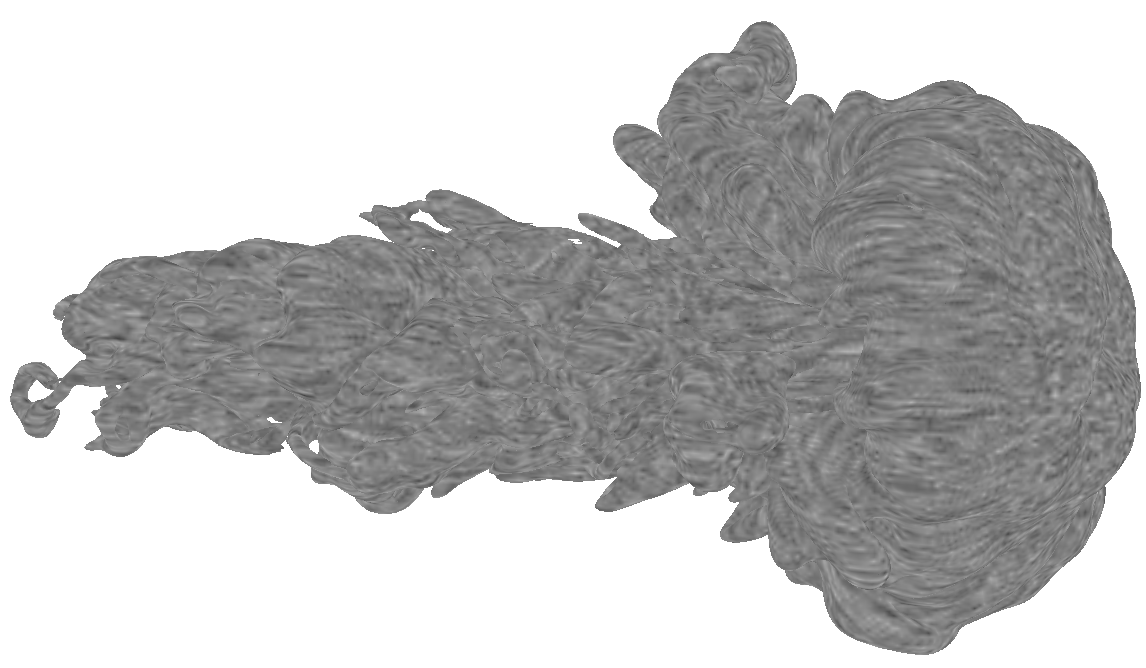
Here, a 3D line-integral convolution field is first computed from a
velocity field from a CFD simulation, then mapped onto an isosurface
manifold. This novel implementation uses hardware acceleration for rendering,
so is very fast and is applicable to all geometry-based visualization
techniques (slices, manifolds, glyphs, and some forms of direct volume
rendering).
Note: this image is under embargo for "public showing" because it is unpublished work. |
NERSC Analytics
- SUNFALL – Production Analytics Pipeline – C. Aragon led a team of scientists in
the design, implementation, and deployment of a production data analytics pipeline for the
Nearby Supernova Factory project. The project, dubbed SUNFALL (SuperNova Factory Assembly
Line), incorporates sophisticated astrophysics image processing algorithms, machine
learning capabilities including boosted trees and support vector machines, and astronomical
data analysis with a usable, highly interactive visual interface designed to facilitate
collaborative decision making. The new software system has resulted in a dramatic
improvement in scientific productivity with an estimated 85-90% savings in effort spent
analyzing supernova target images and a 75% reduction in time spent classifying the
target images due to an improved visual data mining interface. In addition, SUNFALL has
automated the data migration and management tasks that were formerly performed manually
through an automatic and fault-tolerant transfer and archival of data between remote
locations, NERSC HPSS, and local user workstations.
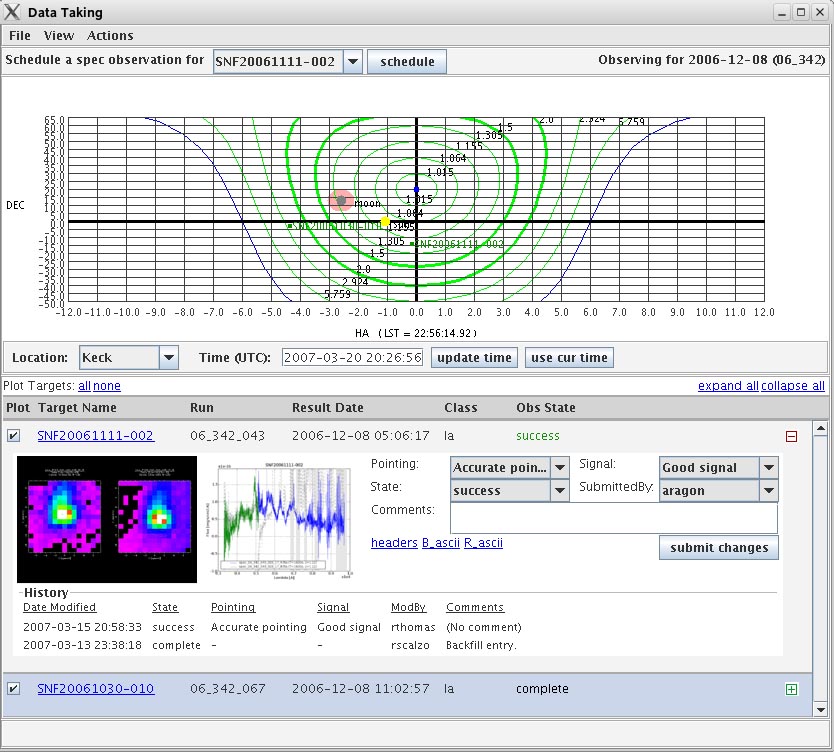
Supernova Warehouse "Data Taking" view from SUNFALL.
"We now regularly rely on the [SUNFALL] tool and underlying automation; we are flush with SNe right now, it has helped tremendously in keeping track of these to make sure our science return is close to optimal." – G. Aldering, PI, The Nearby Supernova Factory. - Deep Sky Map – Reference Dataset for the Astrophysical Research Community. One of the team members, having extensive experience in astrophysics imaging, linear algebra and parallel processing created a ``Deep Sky Map'' from observations taken via the Palomar-QUEST Consortium, the Nearby Supernova Factory and the Near Earth Asteroid team. The resulting map that covers 20,000 square degrees of sky, is about 60TB in size, and provides a temporal and static catalog of astrophysical objects. This work has attracted the attention of several groups and promises to be a useful reference dataset for the entire astropysical community. This test dataset has allowed some NERSC users to improve their processing by a measureable amount by consolidating data I/O and search operations. More information.
- Analysis for Climate and Astrophysics – the Team designed, implemented and where appropriate, put
into production new data analysis capabilities targeting specific science
applications. These include: tools for tropical storm formation and path
tracking; tools for spectrum synthesis analysis using support vector
machines for the purpose of classification; tools using several different
techiques for supernovae target recogniction in a large, multidimensional
data space consisting primarily of optical images. These works resulted in
many publications:
- S. Bailey, C. Aragon, R. Romano, R. C. Thomas, B. A. Weaver and D. Wong. "How to Find More Supernovae with Less Work: Object Classification Techniques for Difference Imaging." Astrophysical Journal (accepted for publication 2007). LBNL-62659.
- C. Aragon and D. Aragon. "A Fast Contour Descriptor Algorithm for Supernova Image Classification." In Proceedings of the SPIE/IS&T Conference on Electronic Imaging, Volume 6469-07, Nasser Kehtarnavaz, Matthias F. Carlsohn, eds. January 2007. LBNL-61182
- Bailey, S.; Aldering, G.; Aragon, C.; Bongard, S.; Childress, M.; Loken, S.; Nugent, P.; Perlmutter, S.; Runge, K.; Scalzo, R.; Romano, R.; Thomas, R.; Weaver, B.; Baltay, C.; Bauer, A.; Herrera, D.; Rabinowitz, D.; Pecontal, E.; Rigaudier, G.; Antilogus, P.; Gilles, S.; Pain, R.; Pereira, R.; Buton, C.; Copin, Y. "How to Find More Supernovae with Less Work: Object Classification Techniques for Difference Imaging." Poster at 2007 AAS/AAPT Joint Meeting, American Astronomical Society Meeting 209, #78.09. December 2006 (Poster)
- R. Romano, C. Aragon and C. Ding. "Supernova Recognition Using Support Vector Machines." Proceedings of the 5th International Conference on Machine Learning and Applications (ICMLA'06), Orlando, FL, December 2006. LBNL-61192. (Best Paper Award!)
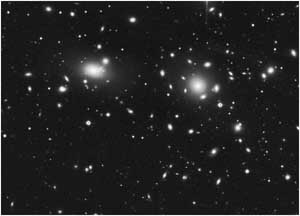
|
| This image is a subset of the complete Deep Sky map showing the Coma cluster. To create this subset, over 500 images collected during the period 2001-2007 were combined. |
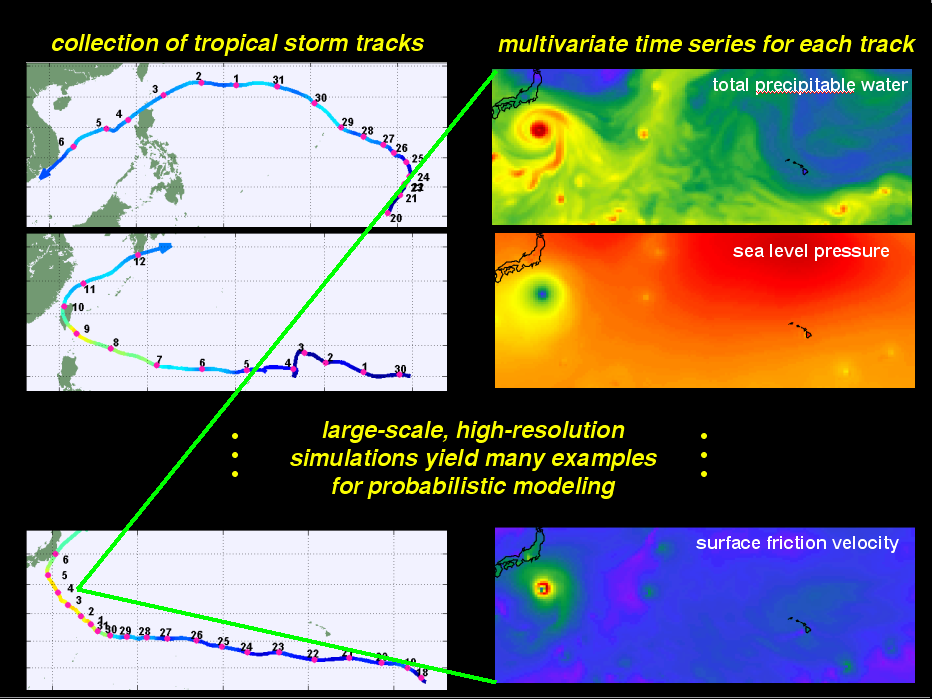
|
| Statistical modeling of high-dimensional, time-varying, non-stationary time series enables the discovery of temporal, spatial, and multivariate statistical dependencies in large-scale climate simulations. Using latent variable models of tropical storm trajectories, we can infer the statistical relationships between space-time-varying atmospheric variables along a storm trajectory and the likelihood of the storm evolving into an intense hurricane. Hierarchical, stochastic models can predict the influence of global-scale, long-term climate patterns on such short-term, local events. |

|
| Statistical machine learning techniques enable automatic spectra classification. This capability helps eliminate manual classification steps and increases scientific insight. |