SNAZ Project Support - I
NOTE: click on an image to see a higher resolution one
Contents
First Step: 2D conversion to VTK
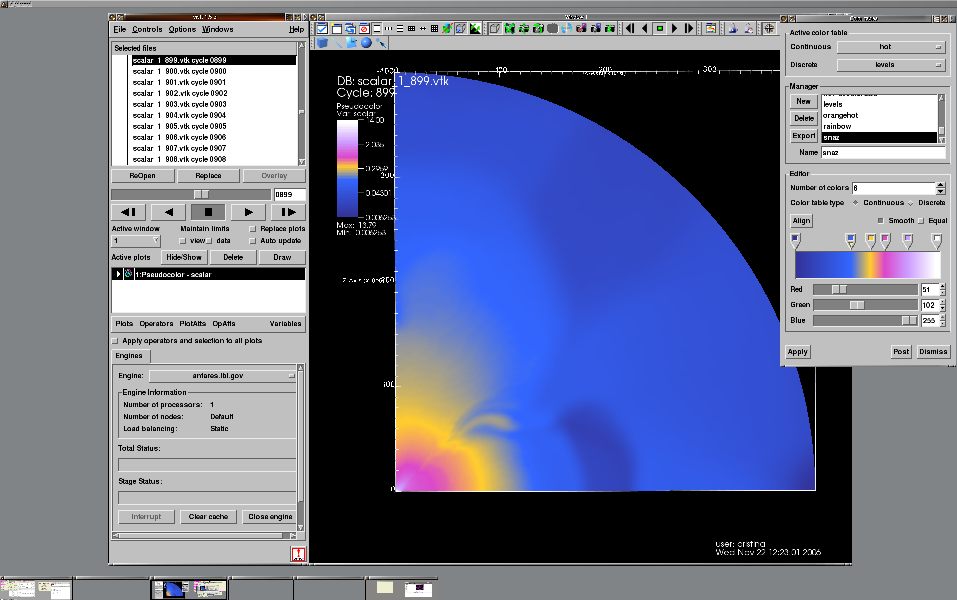
As a first step I converted these files to vtk format using Hank's VisIt vtk writer (visit_writer.c and visit_writer.h). I used an openDX reader for the Vulcan data as an example, see importvulcandata3D.c. However some of the variables need type "double" and Hank's writer only handles floats. I converted his writer to all doubles, visit_writer.c and visit_writer.h, and used snaz2vtk.c to convert the files. Some of the vector variables still give and "inf" or a "nan" in VisIt so I divided the values by the max-min value that I got from the PARAM.aic_M1pt92_90d_16_3 file (Some of the values in this file were missing the E of the exponent and I added them by hand).
These converted files and the conversion programs are in: /d/visusers/cristina/SNAZ/VTKDataNormalized and are readable by the graphics group. A set of time steps with the original doubles is here /d/visusers/cristina/SNAZ/VTKData. I also copied the same directories to the /project/projectdirs/mpccc/cristina/snaz of NERSC with read permissions for the group snaz.
Figure 1. Snapshot of the VisIt GUI showing a Pseudocolor plot of temperature.
|
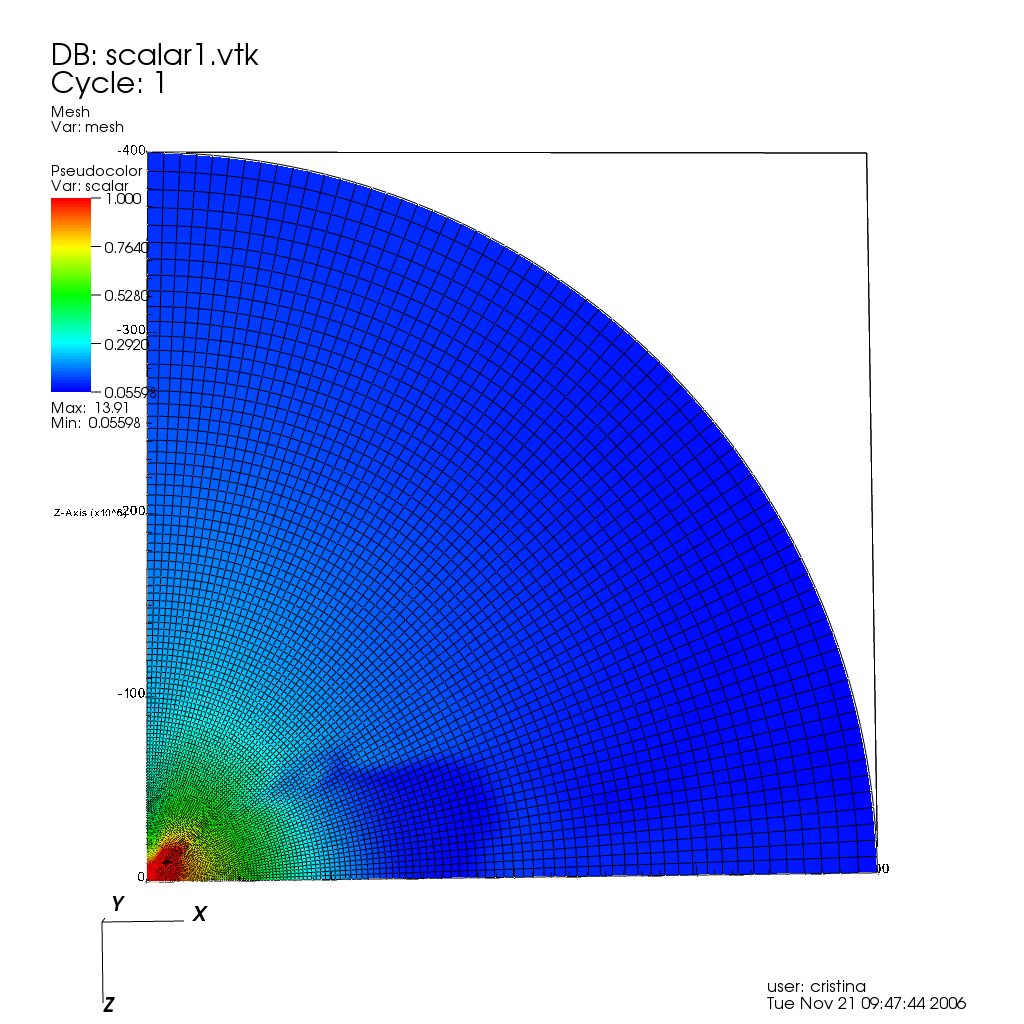
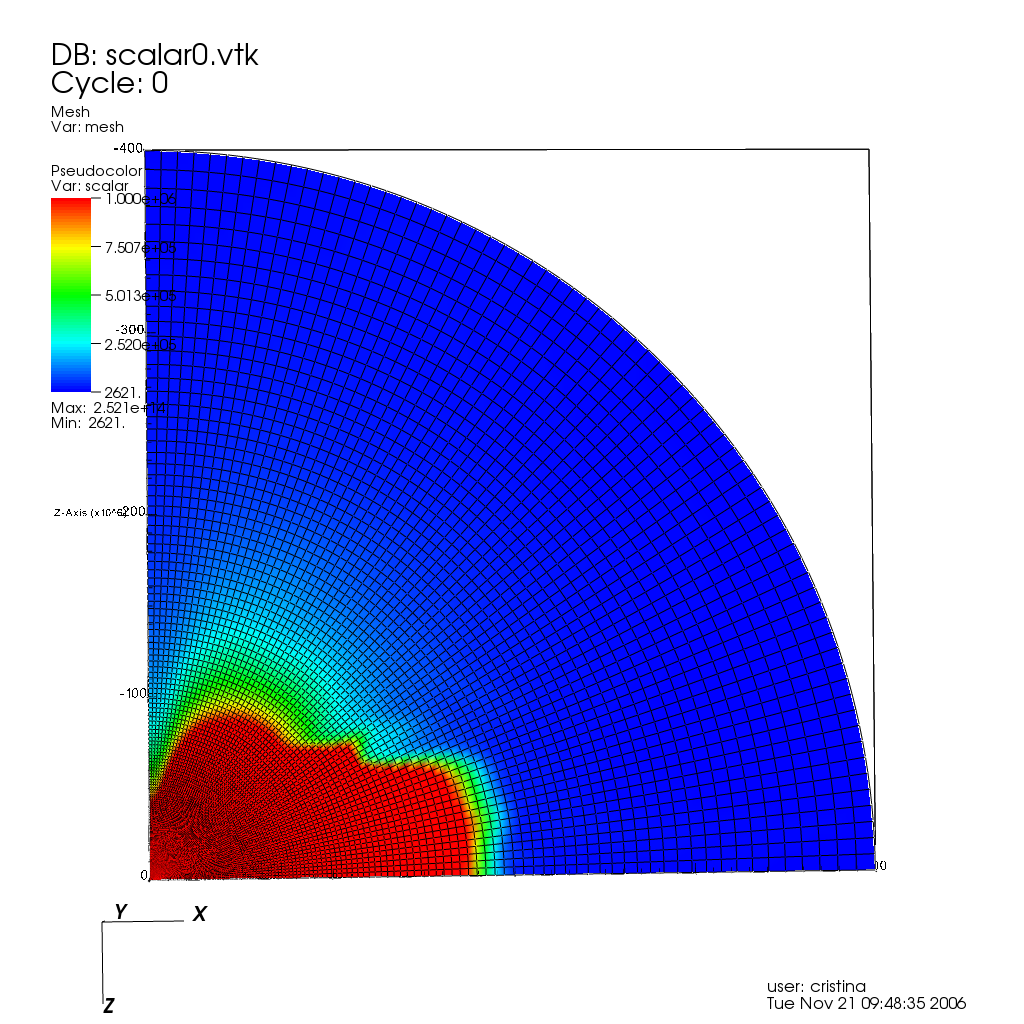
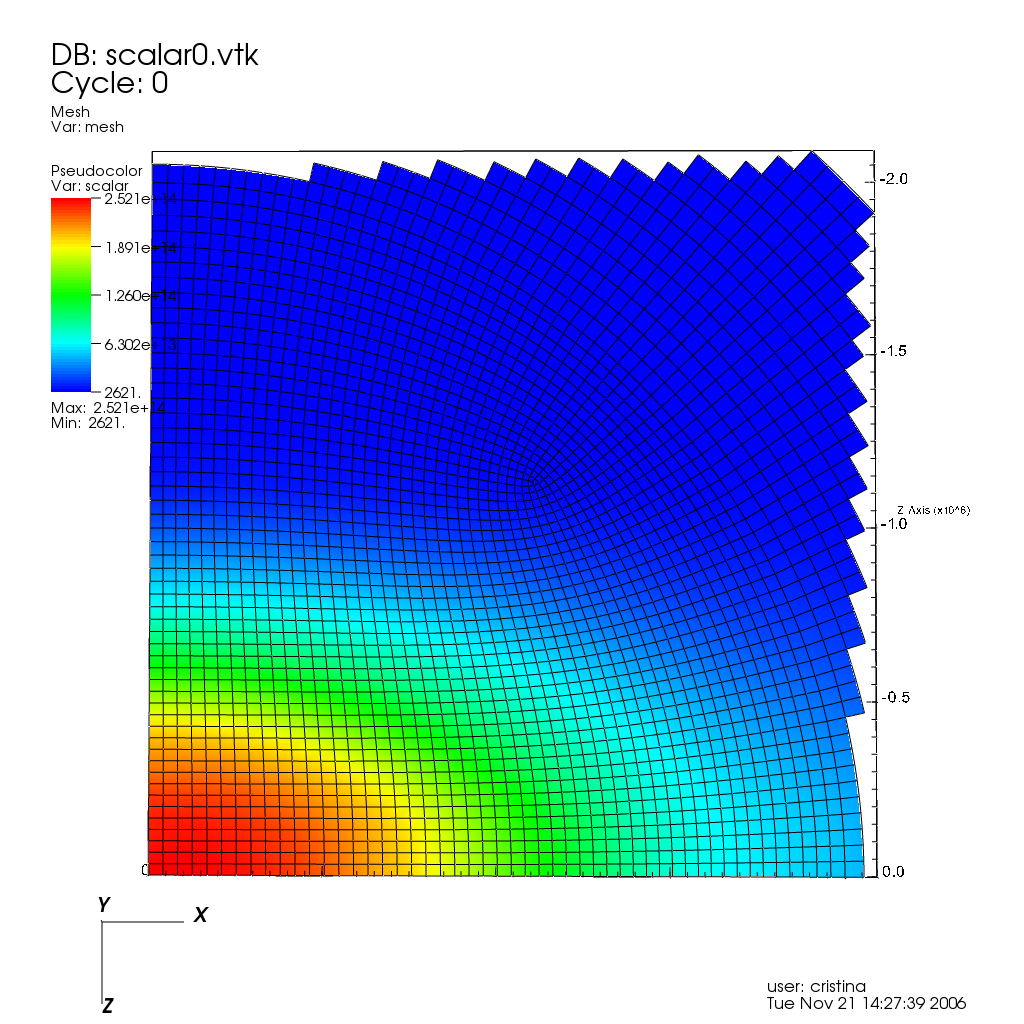
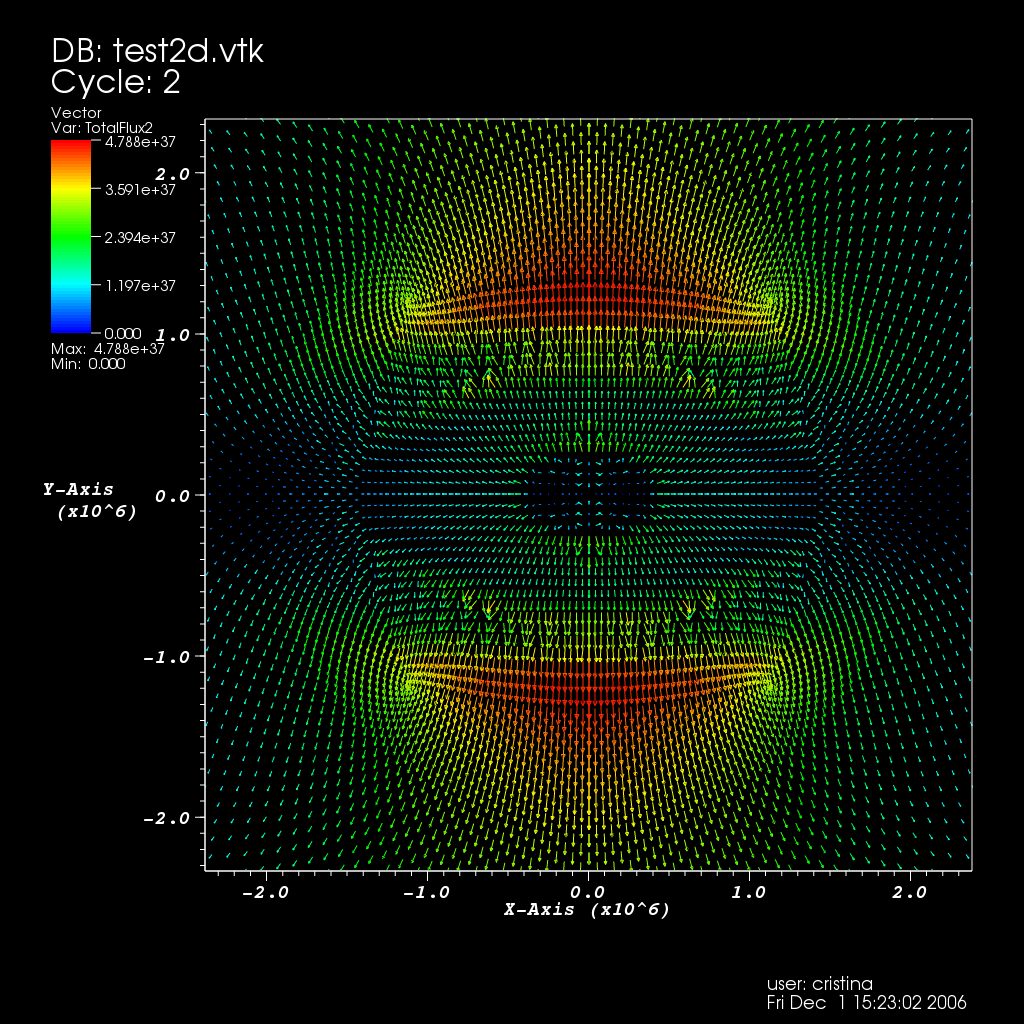
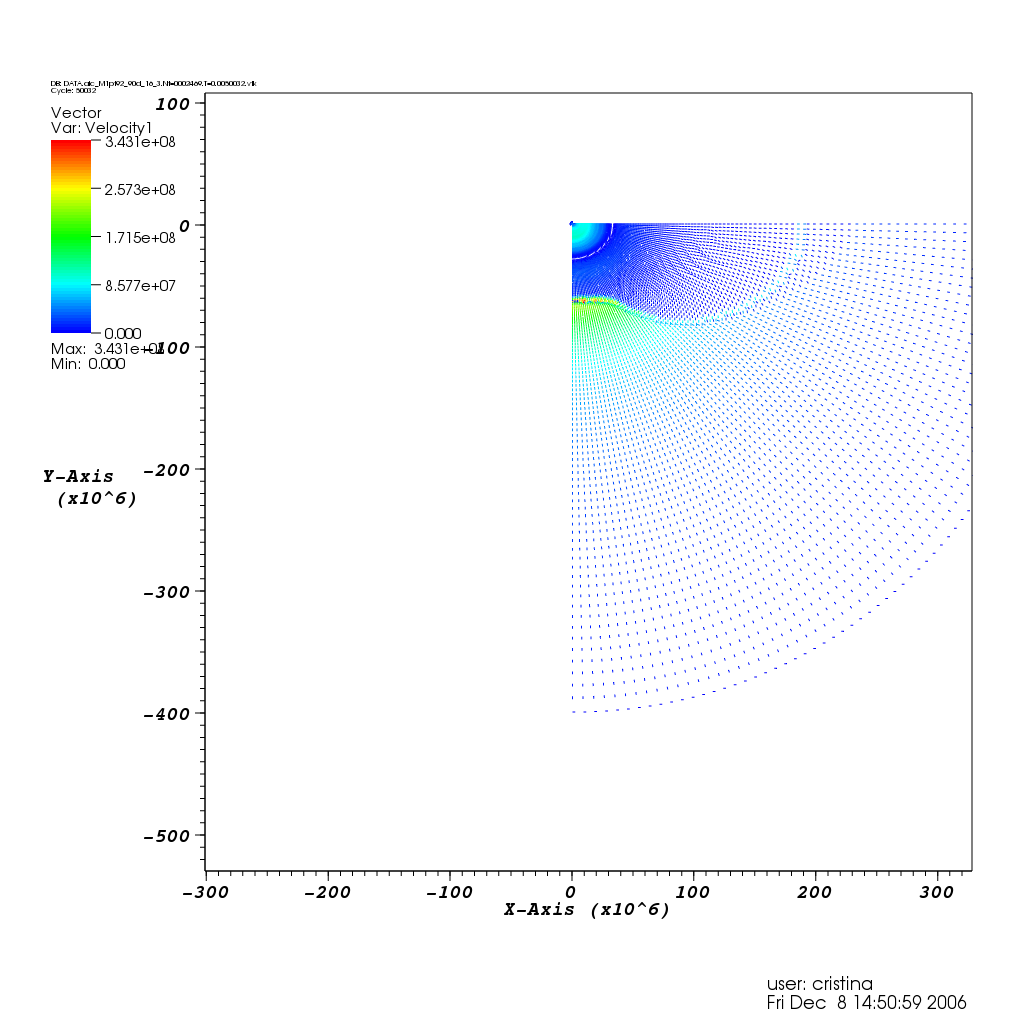
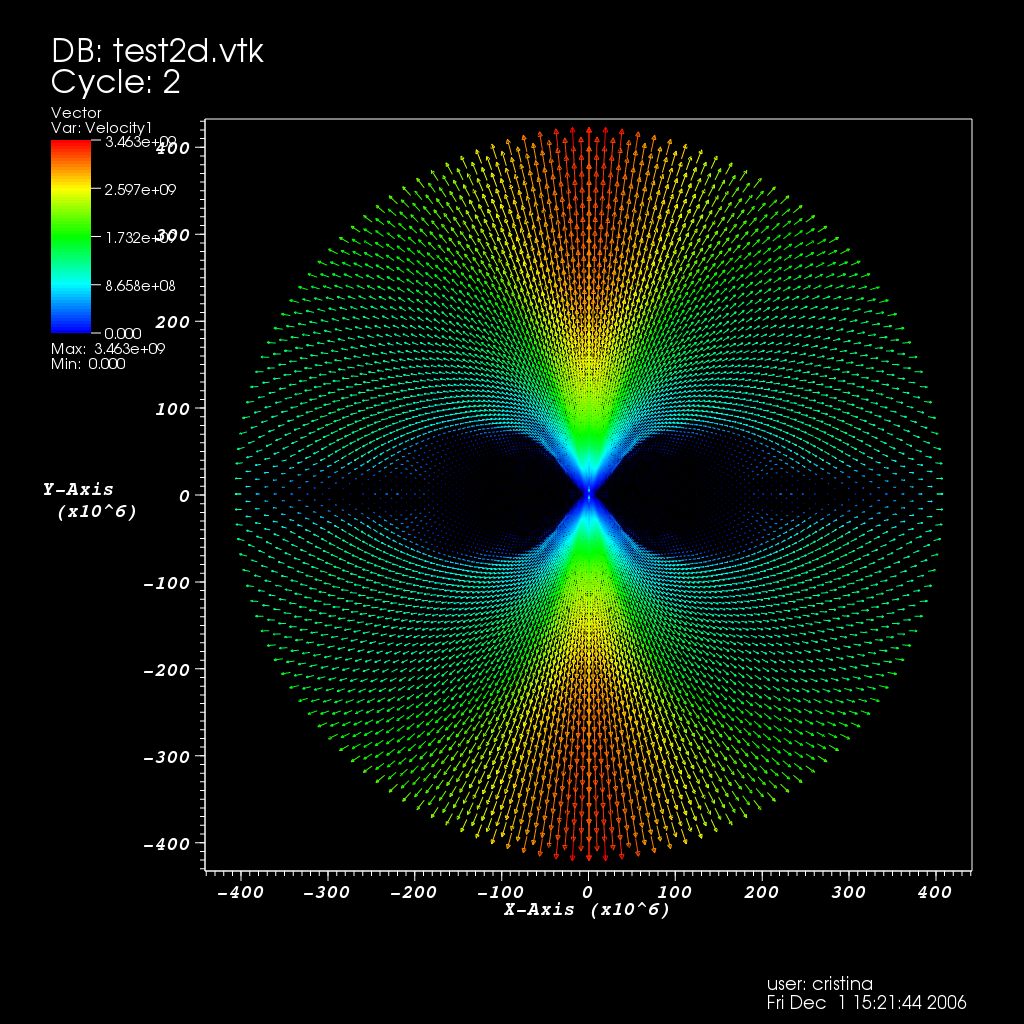
Figure 2. First images of the 2D data.
|
|
|
|
Second Step: 3D conversion to VTK
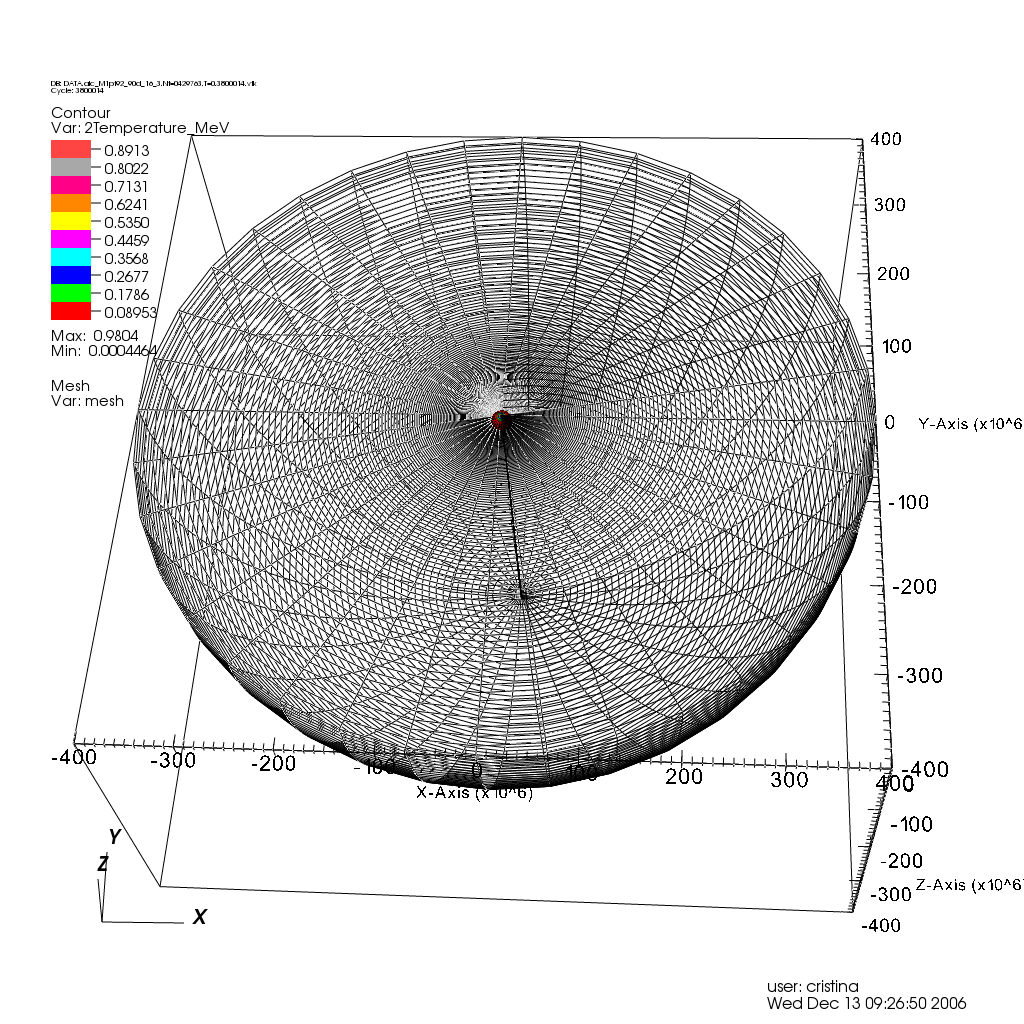
The next step was to convert the data to 3D by replicating the 2D mesh around 360 degress and making the connectivity for hexahedral cells. I modified snaz2vtk.c to make the 3D cells using the original importvulcandata3d.c example.
Figure 3. 3D hexahedral mesh.
|
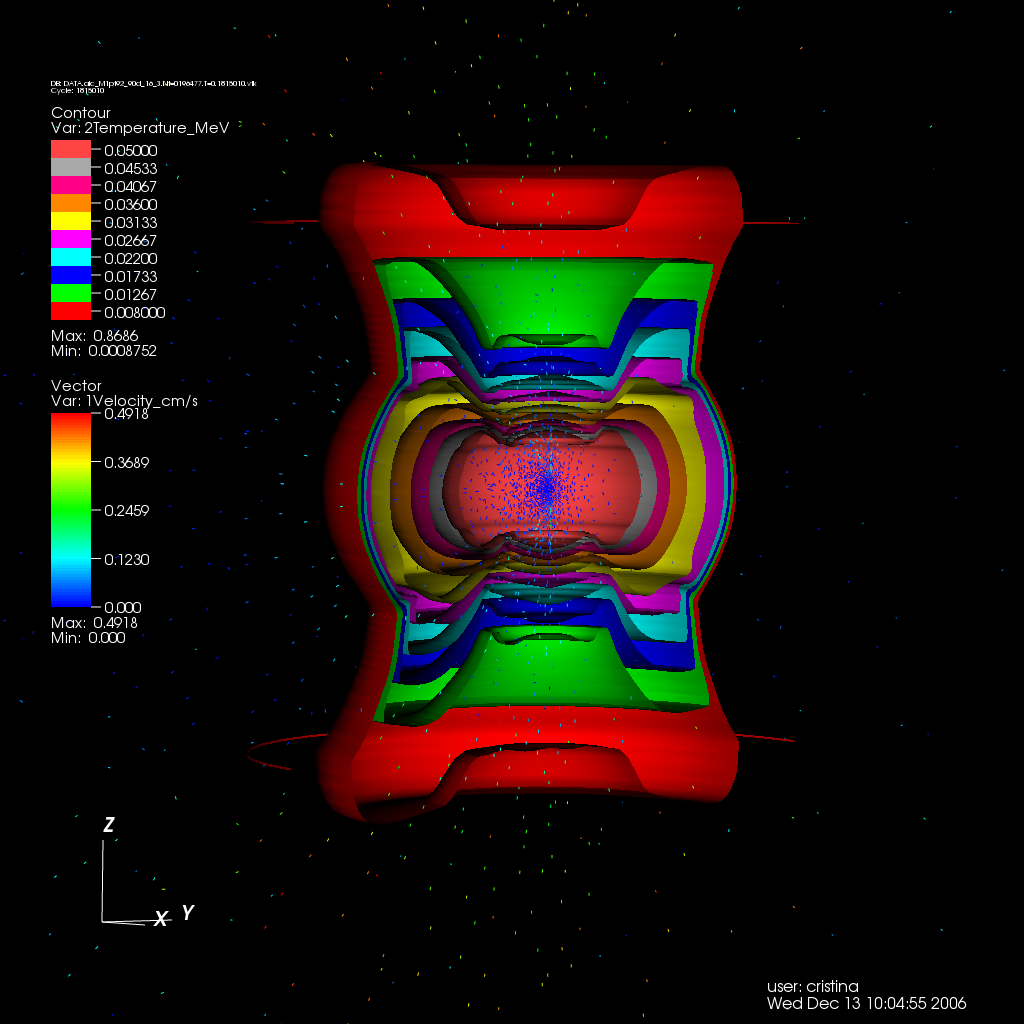
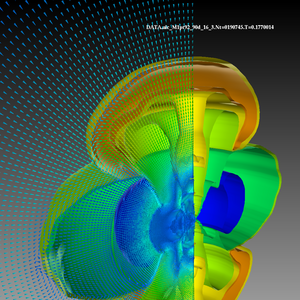
Figure 3. 3D hexahedral mesh reflected using VisIt Reflection operator, isosurfaces and vectors.

|
|
|
2D Entropy Evolution using VisIt
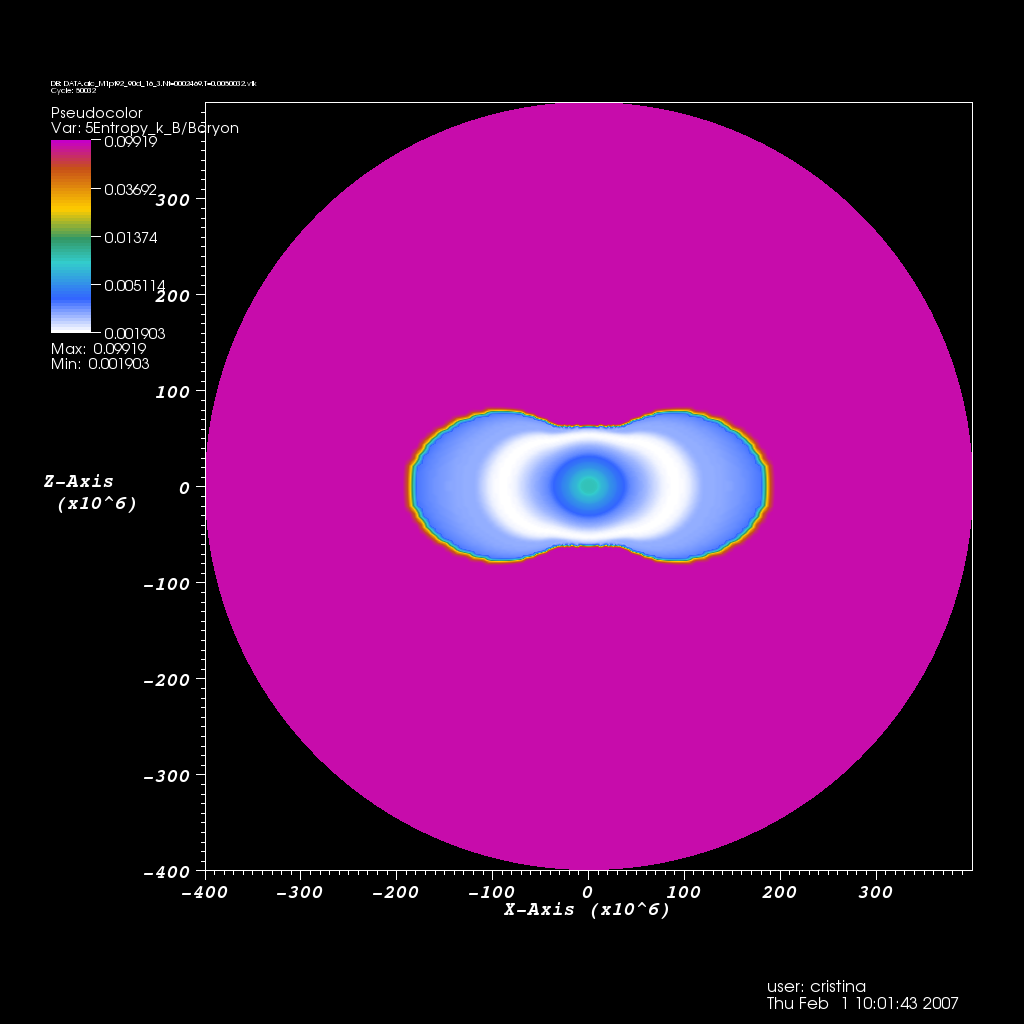
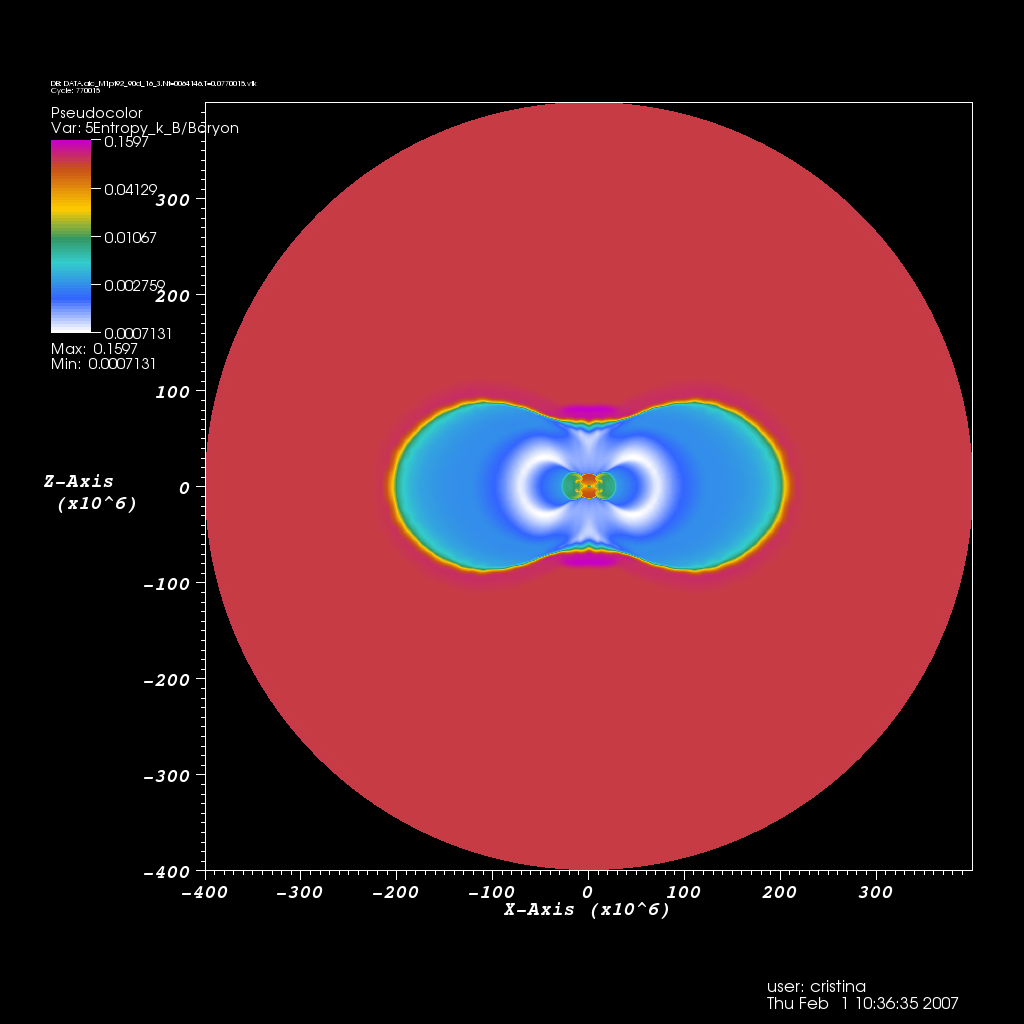
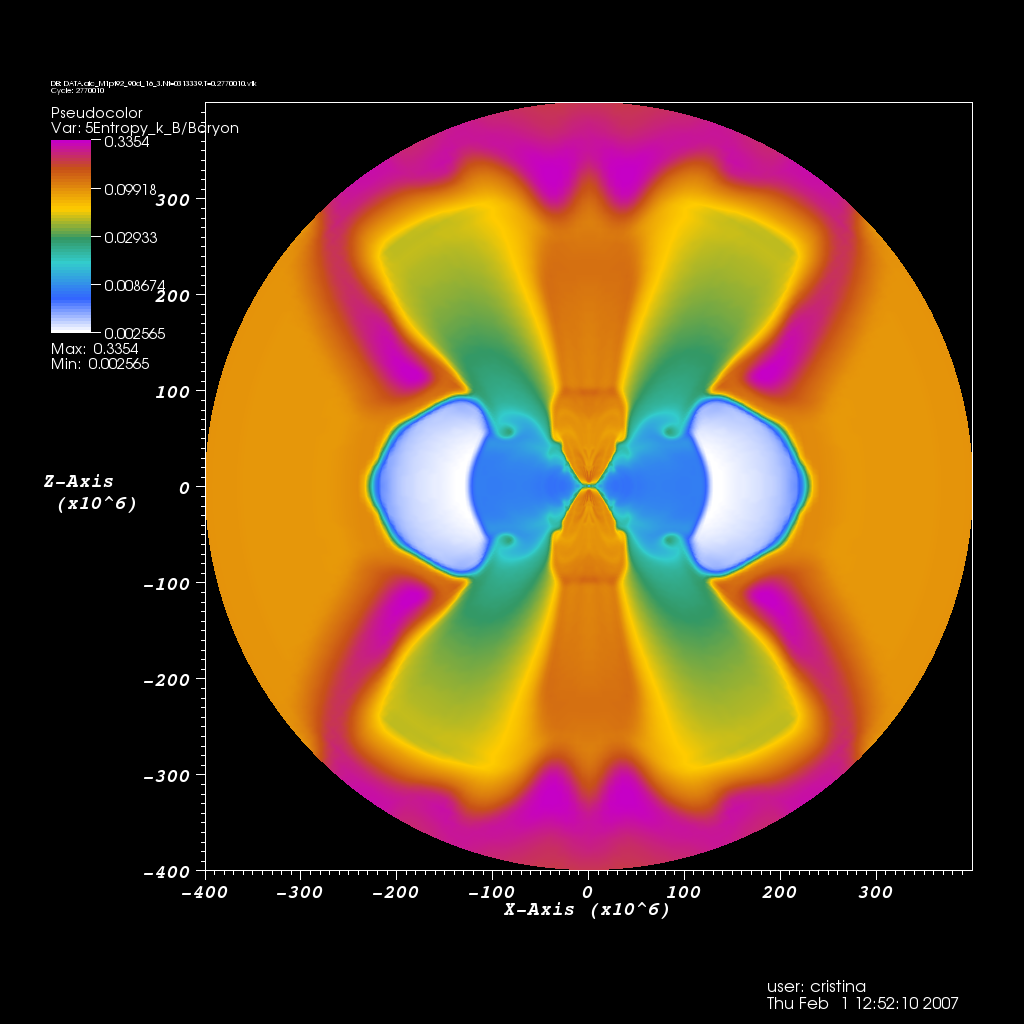
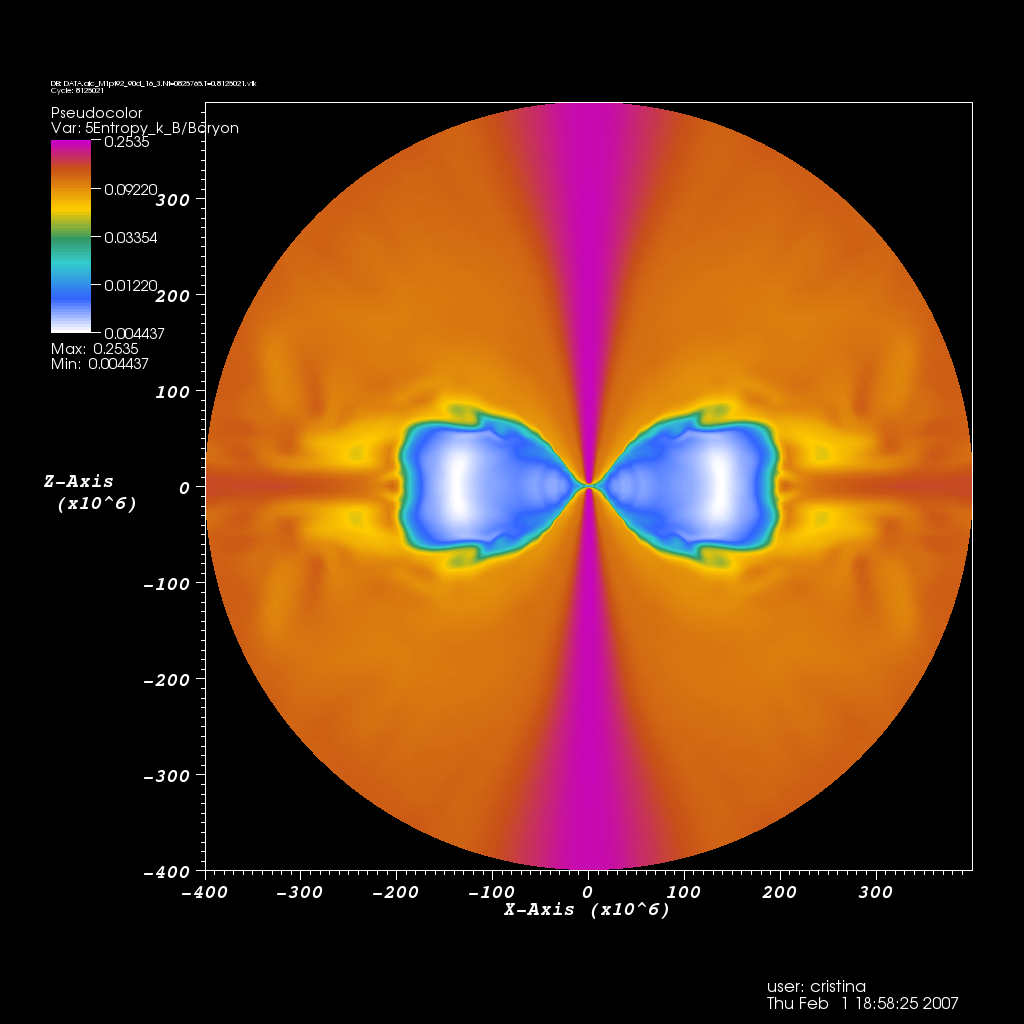
Figure 4. Entropy Evolution in 2D (logarithmic colormap)
|
|
|
|
MOVIE: Click here to see the time evolution
First images of the 3D Entropy using AVS/Express
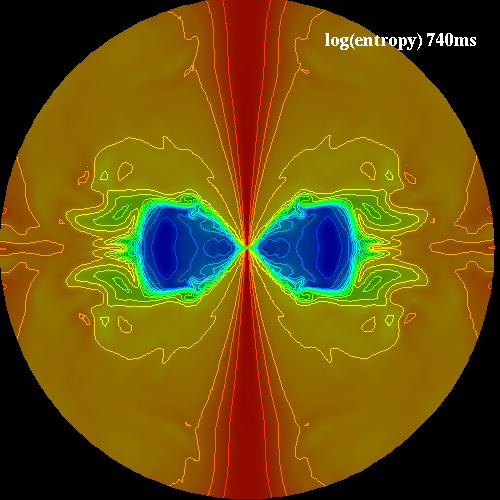
Figure 5. 2D Entropy for T=740.50ms (logarithmic colormap).

|
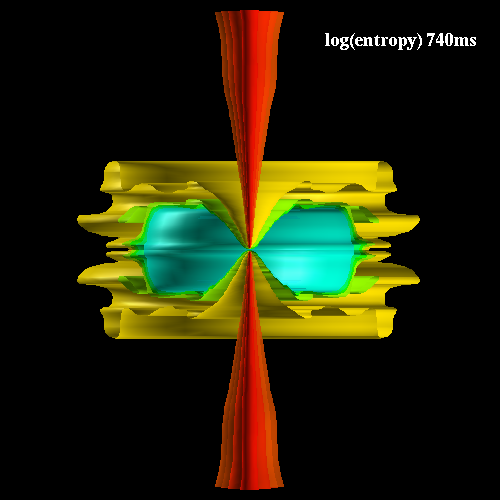
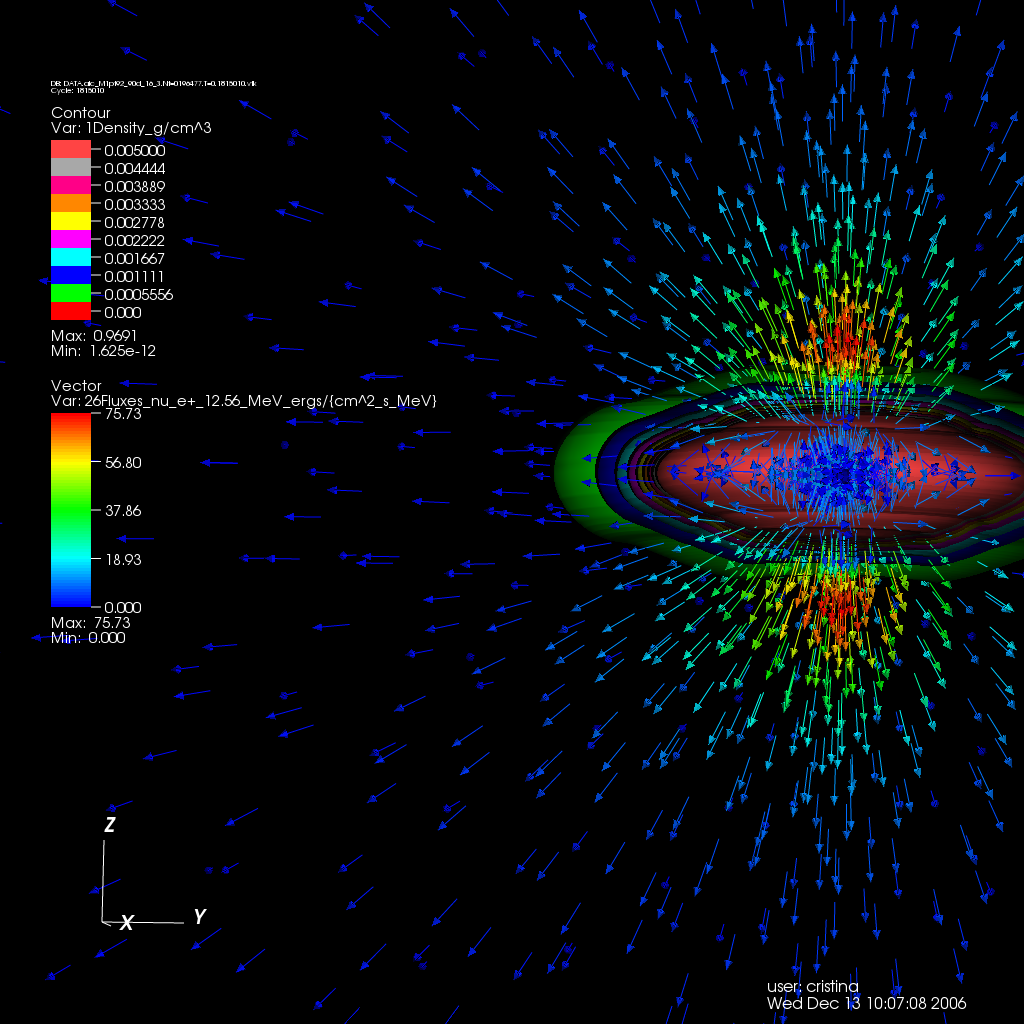
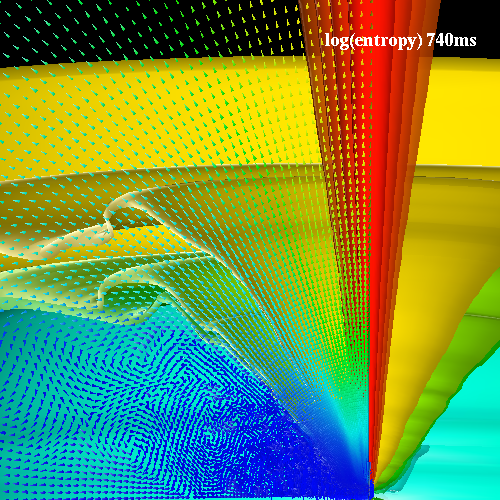
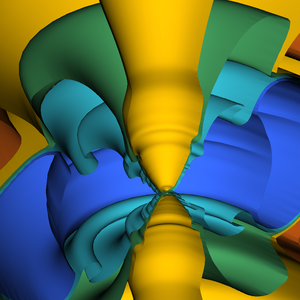
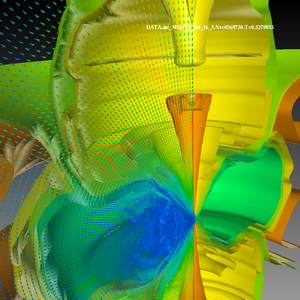
Figure 6. Entropy (log scale) isosurfaces and velocity vectors for t=740.50ms.

|
|
Volume Rendering of the 3D Entropy using VisIt
One transfer function
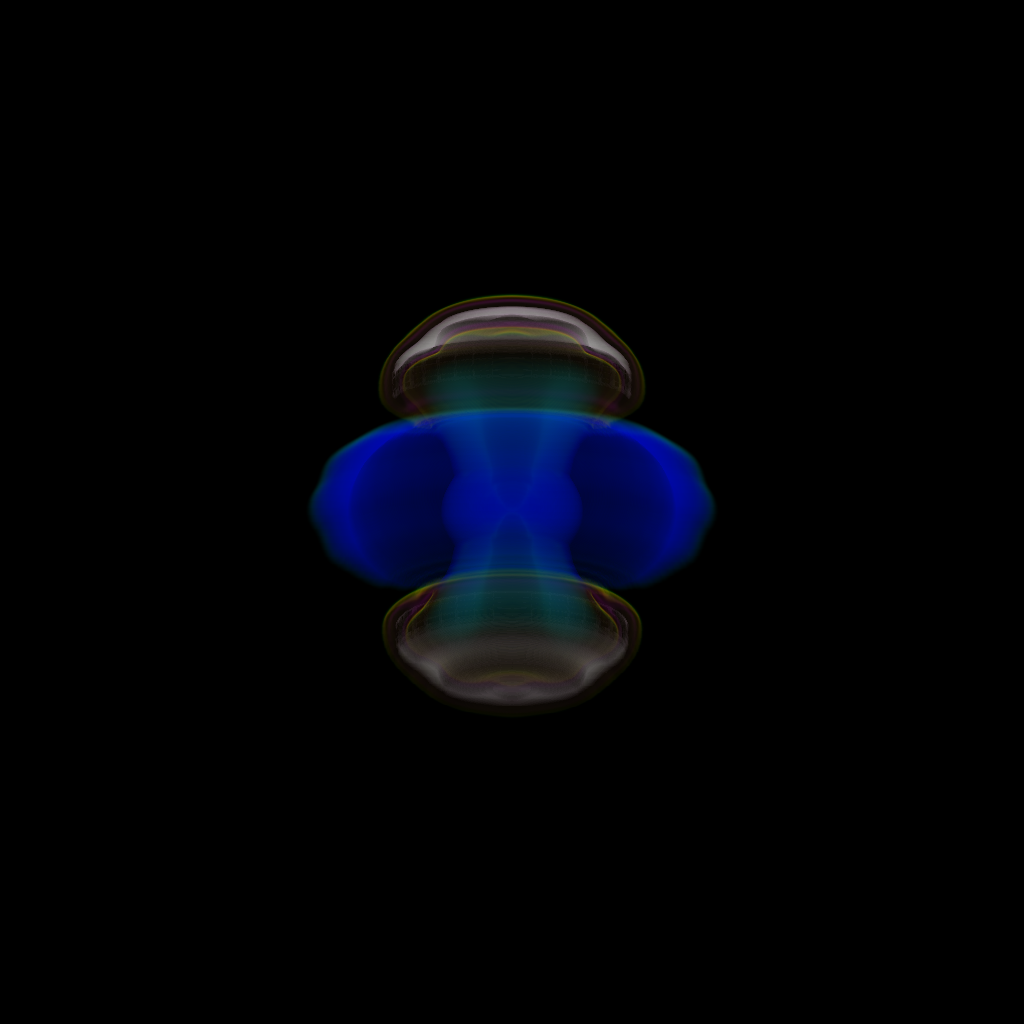
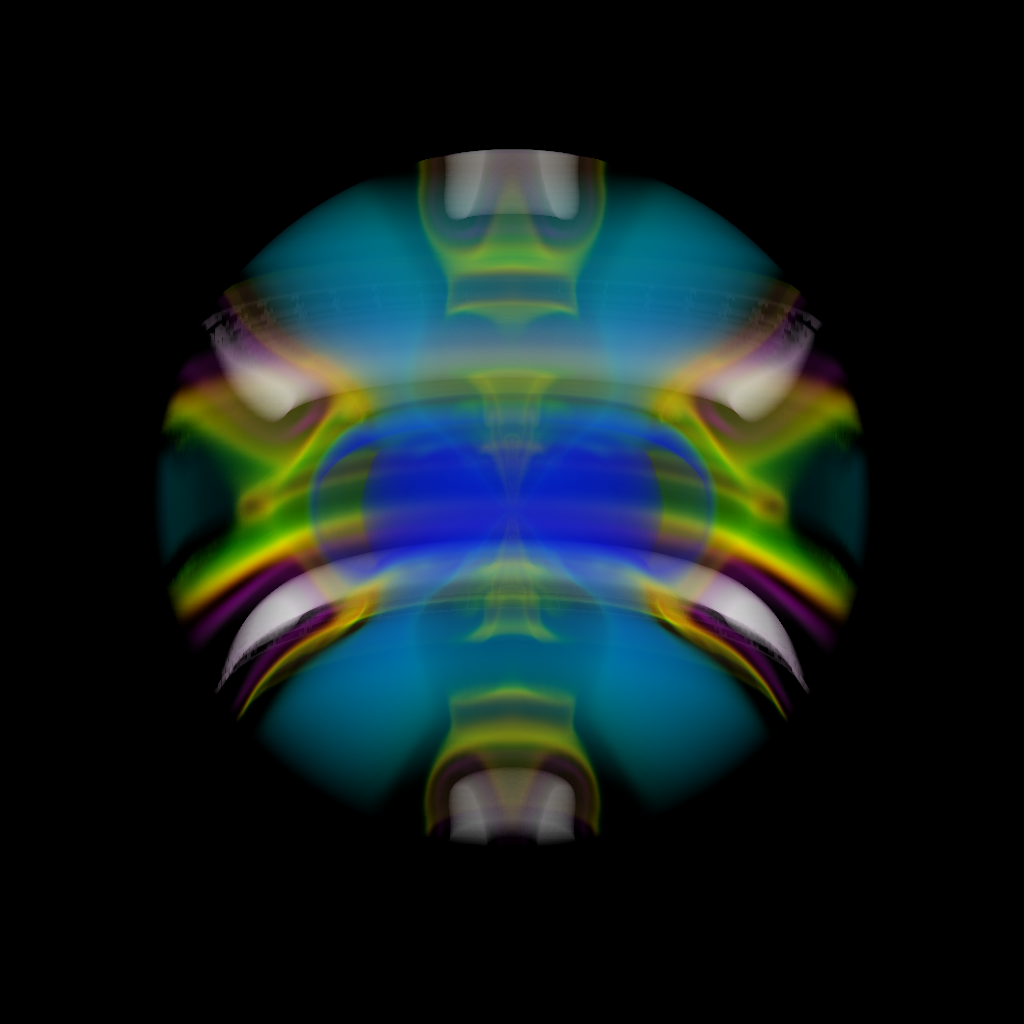
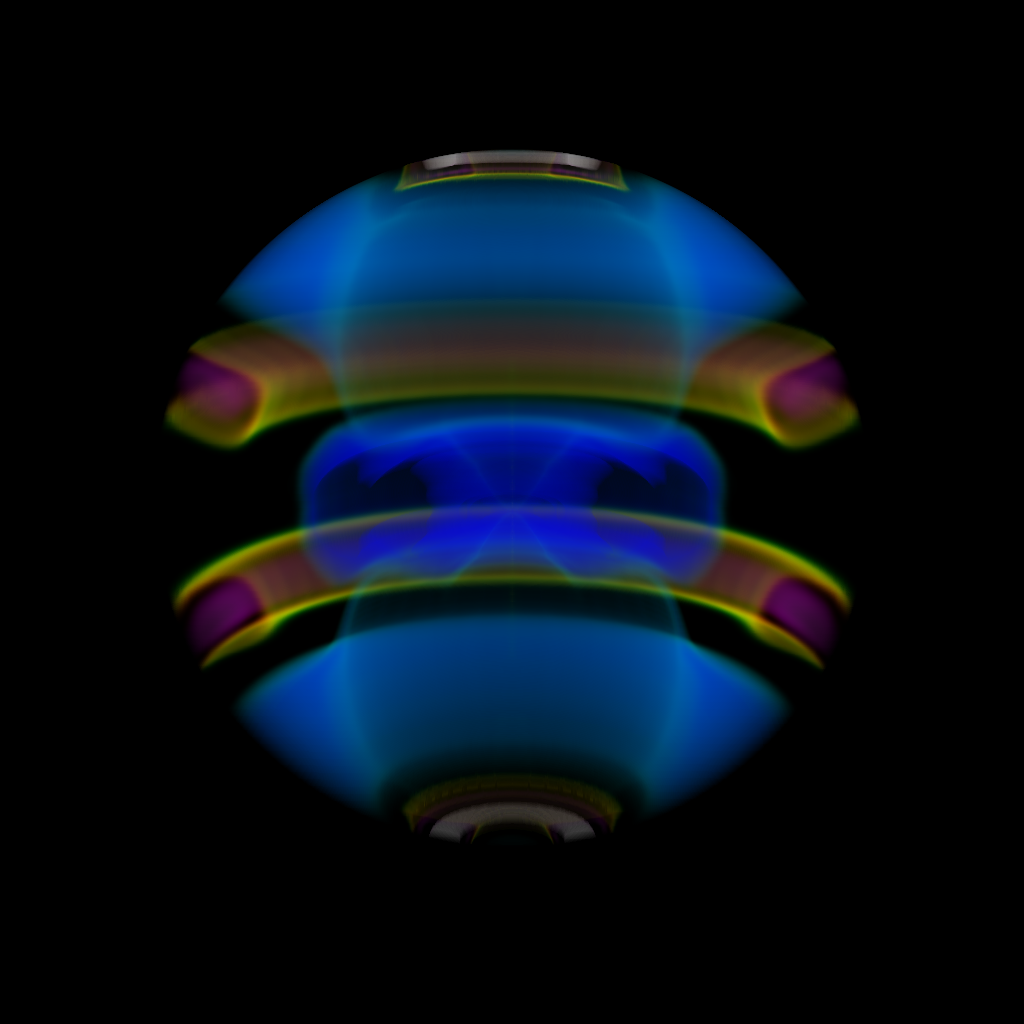
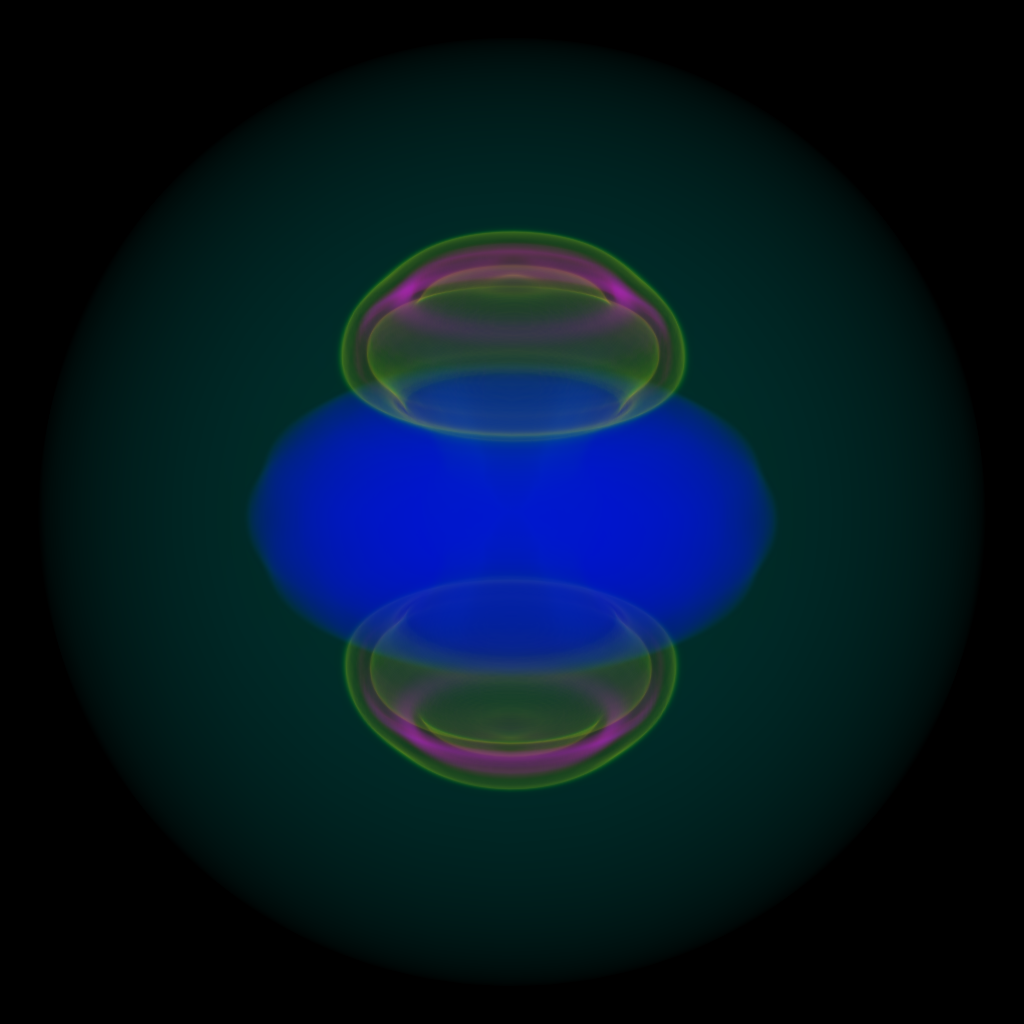
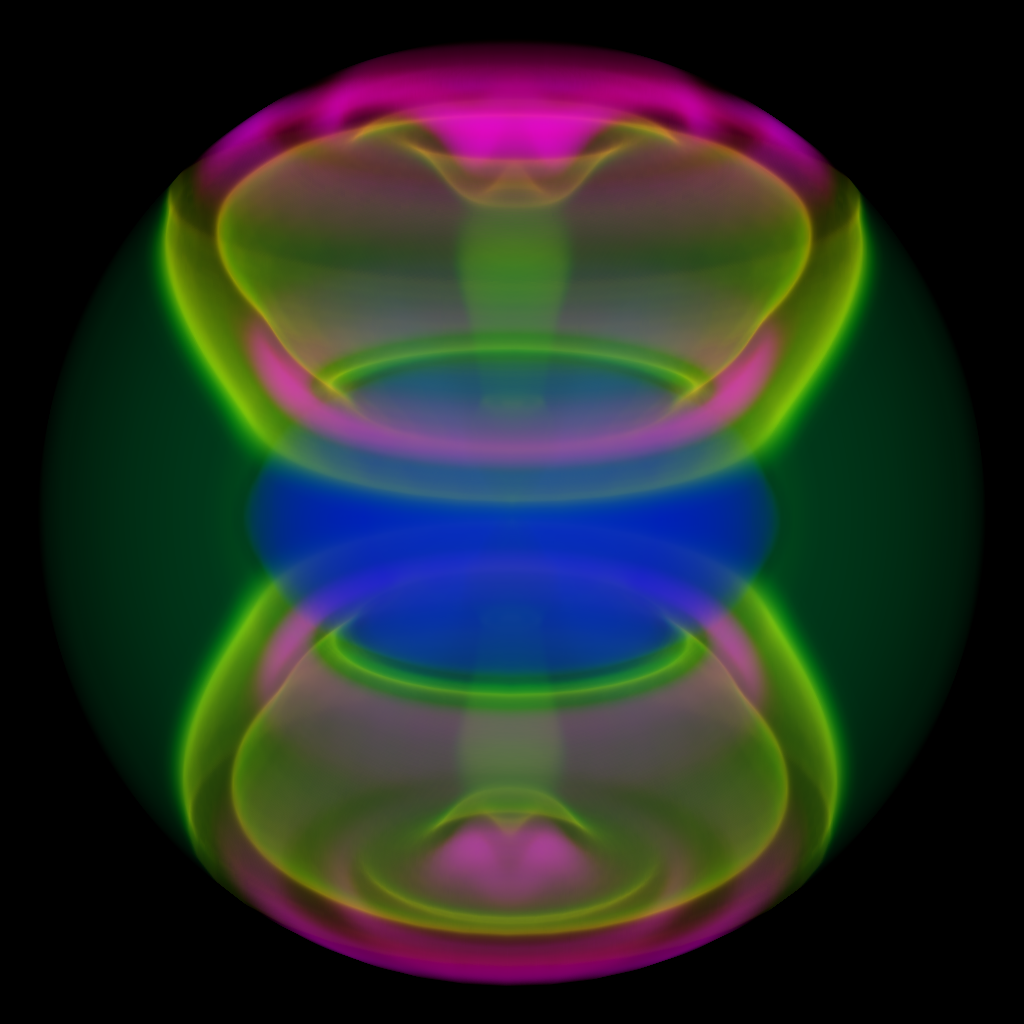
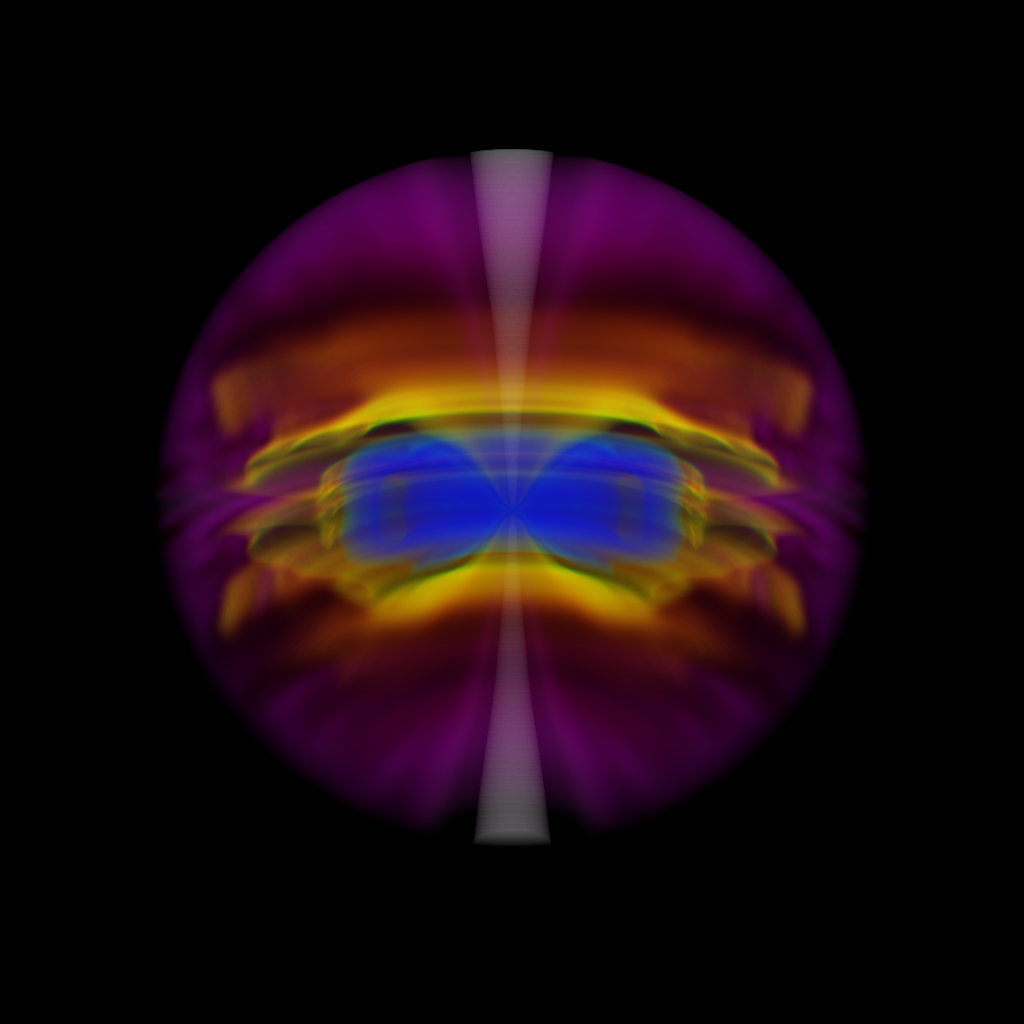
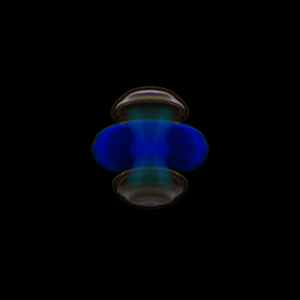
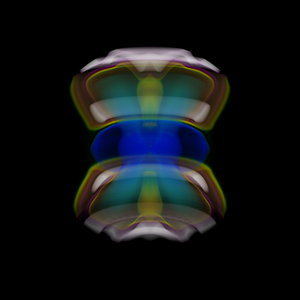
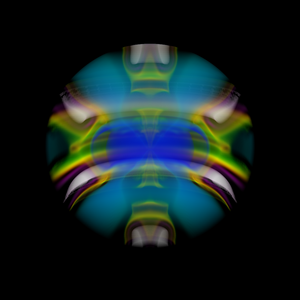
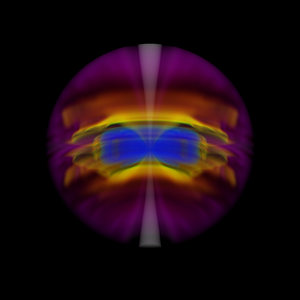
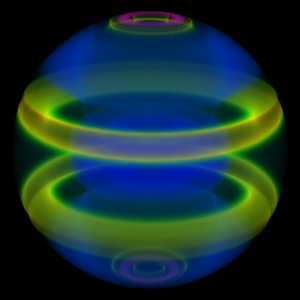
Figure 7. 3D Volume Rendering of Entropy evolution.
|
|
|
|
|
|
MOVIE: Click here to see the time evolution
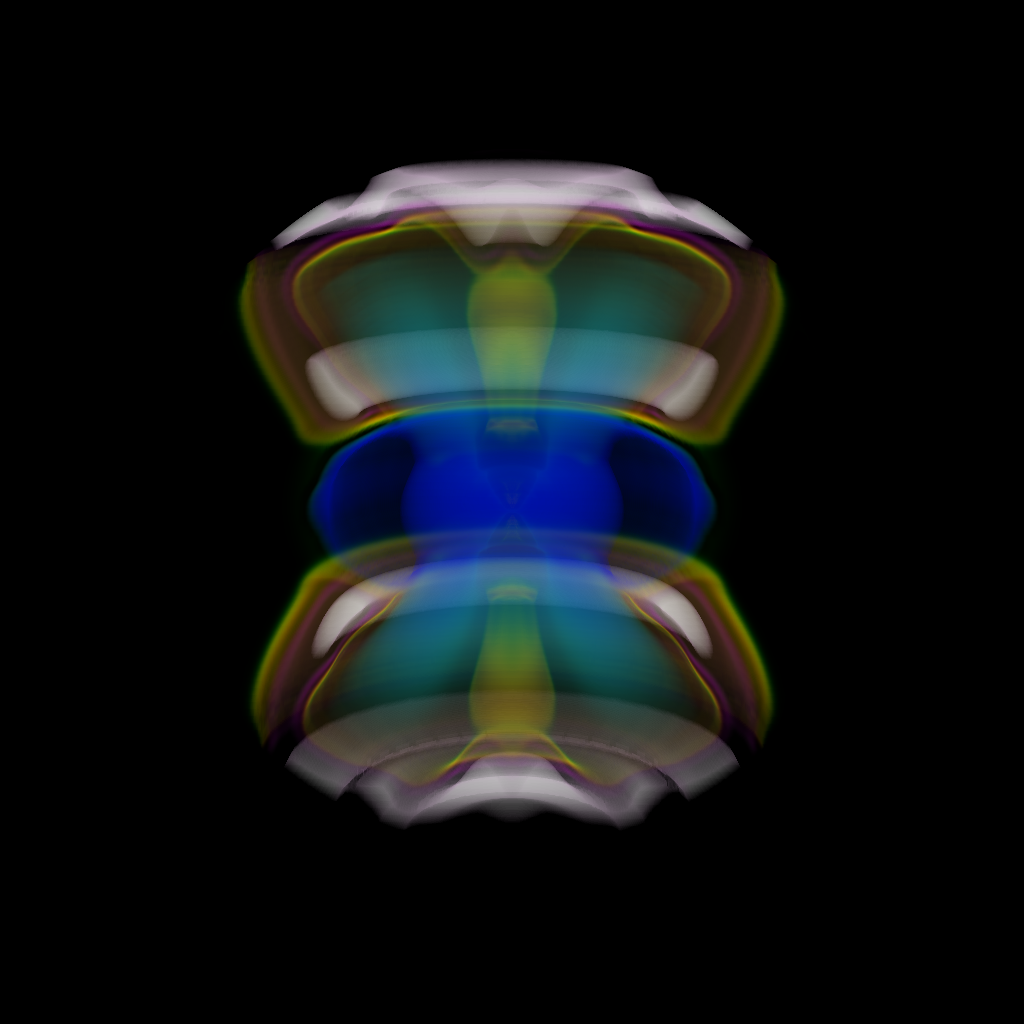
Another transfer function
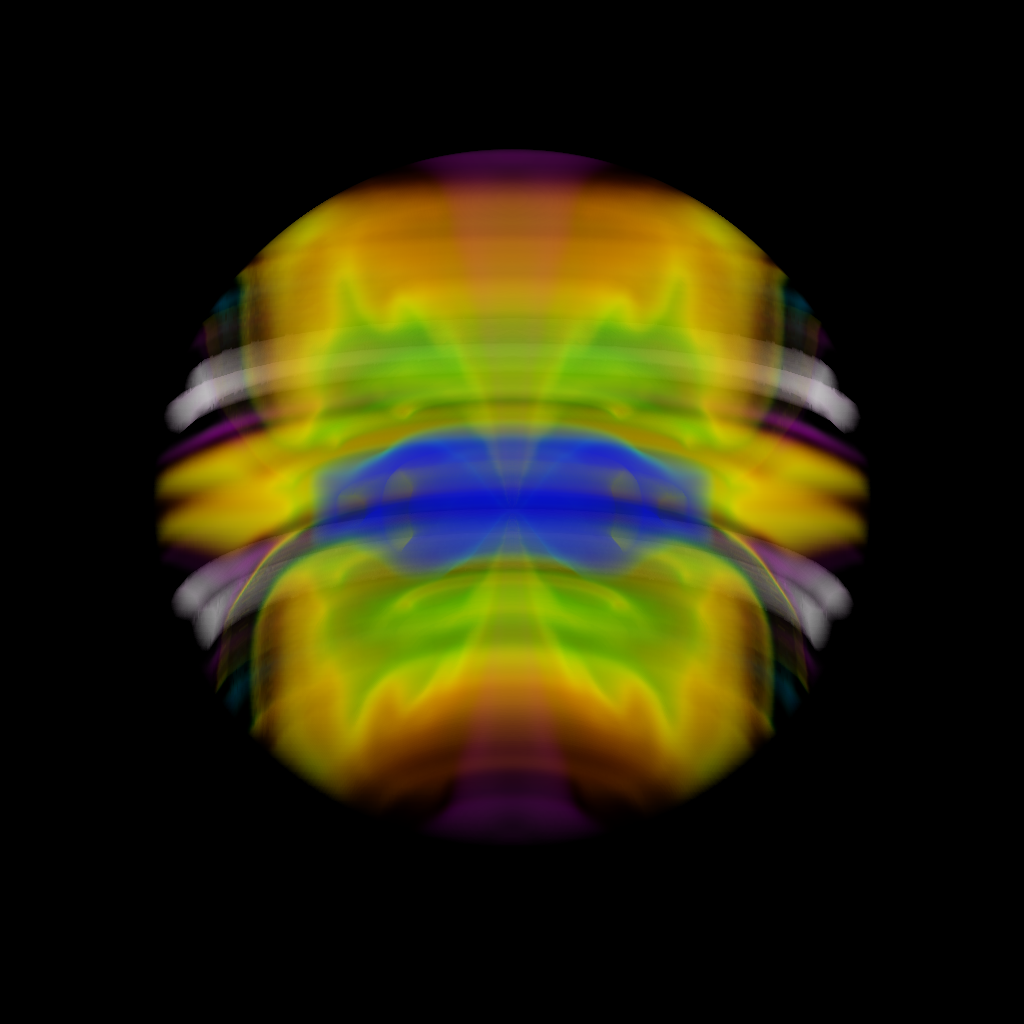
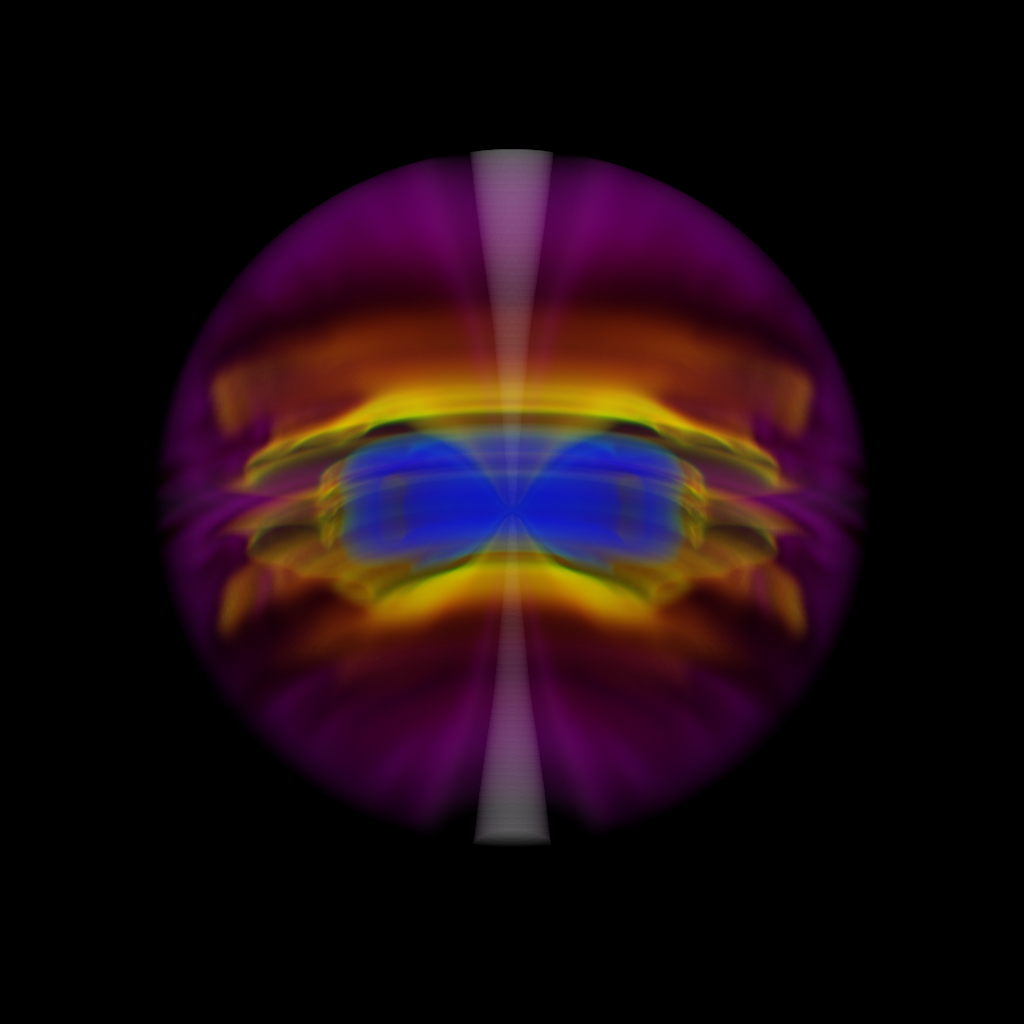
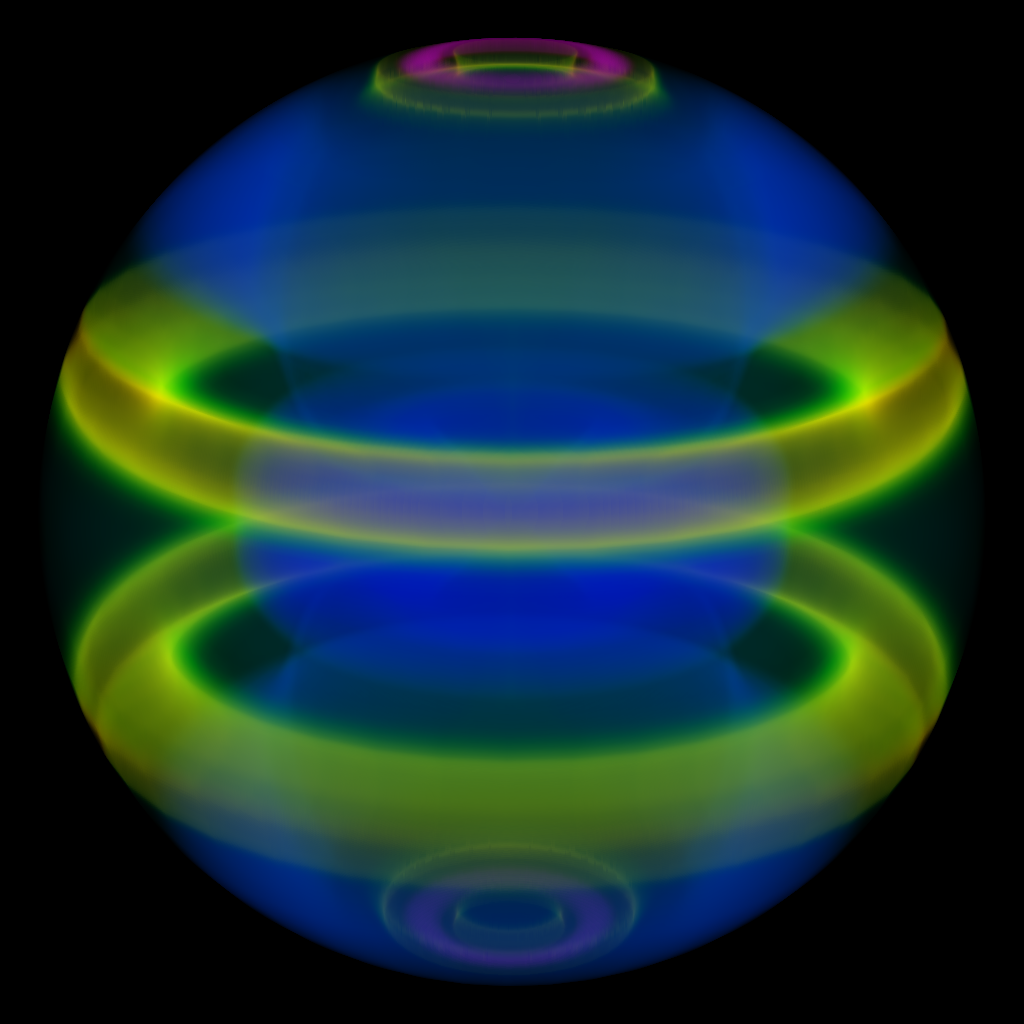
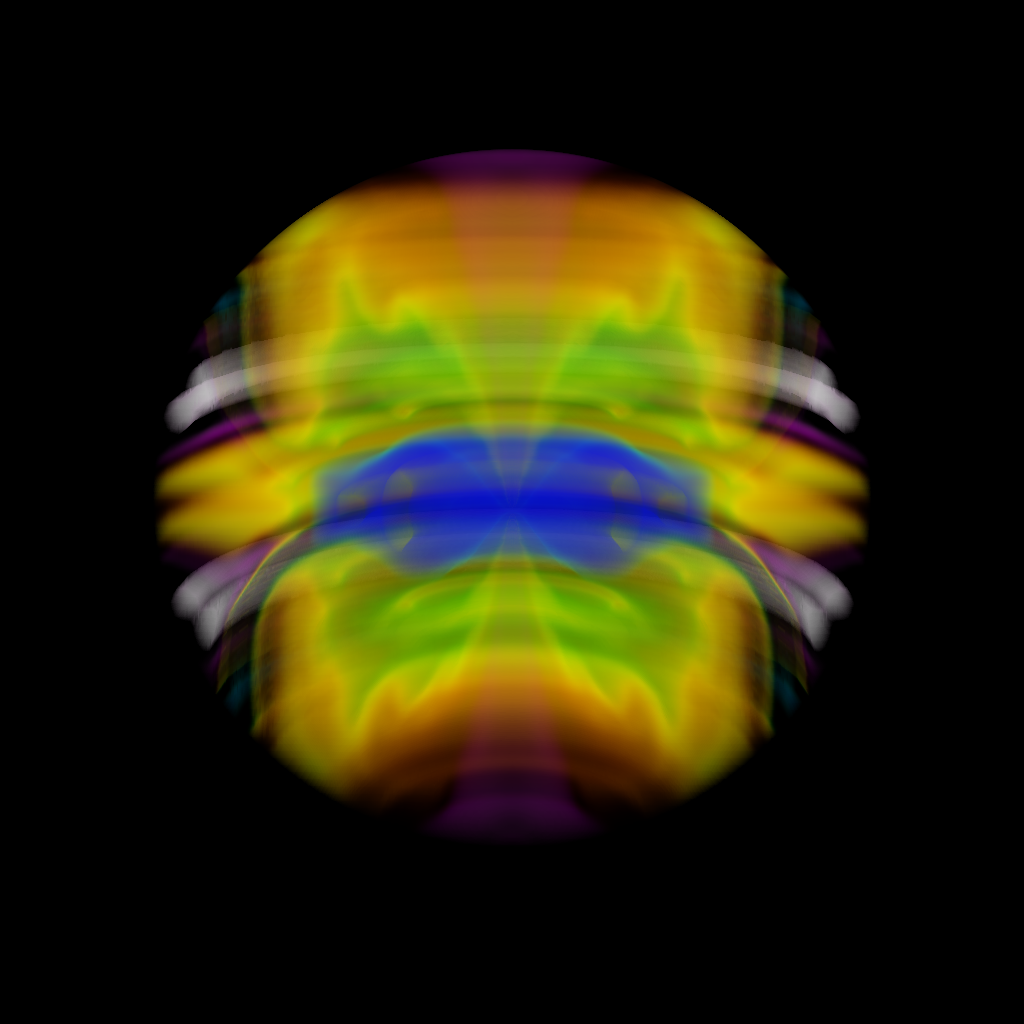
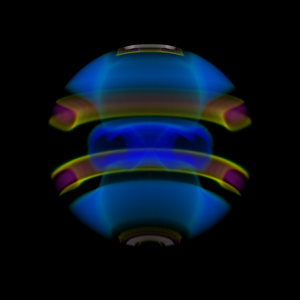
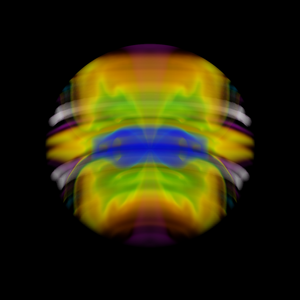
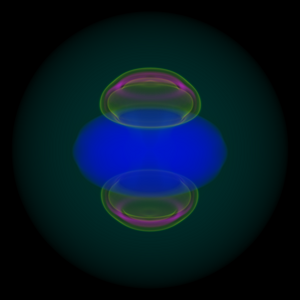
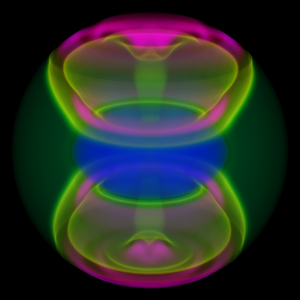
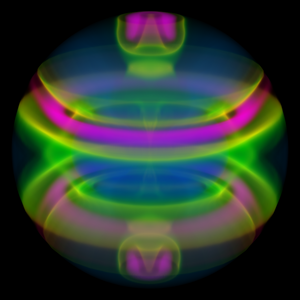
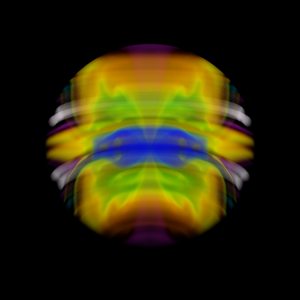
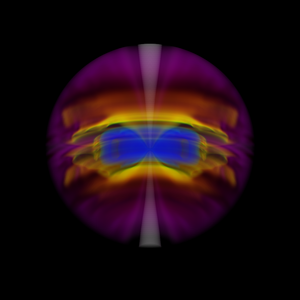
Figure 8. 3D Volume Rendering of Entropy evolution.
|
|
|
|
|
|
MOVIE: Click here to see the time evolution
Comparison of isosurfaces using Express and Visit, I might like VisIt better actually.
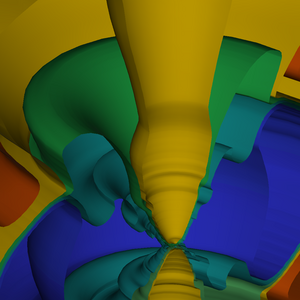
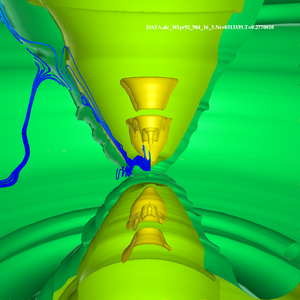
Figure 9. 3D Isosurfaces of T=3025016.
|
|
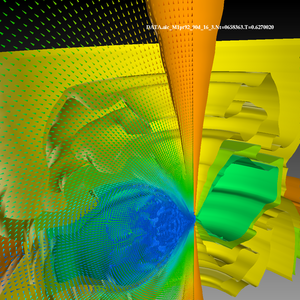
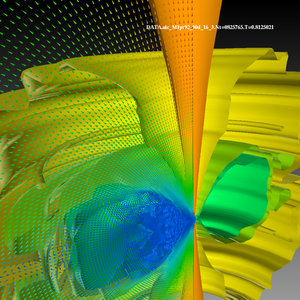
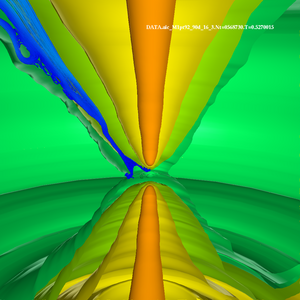
Entropy isosurfaces and velocity vectors using Express
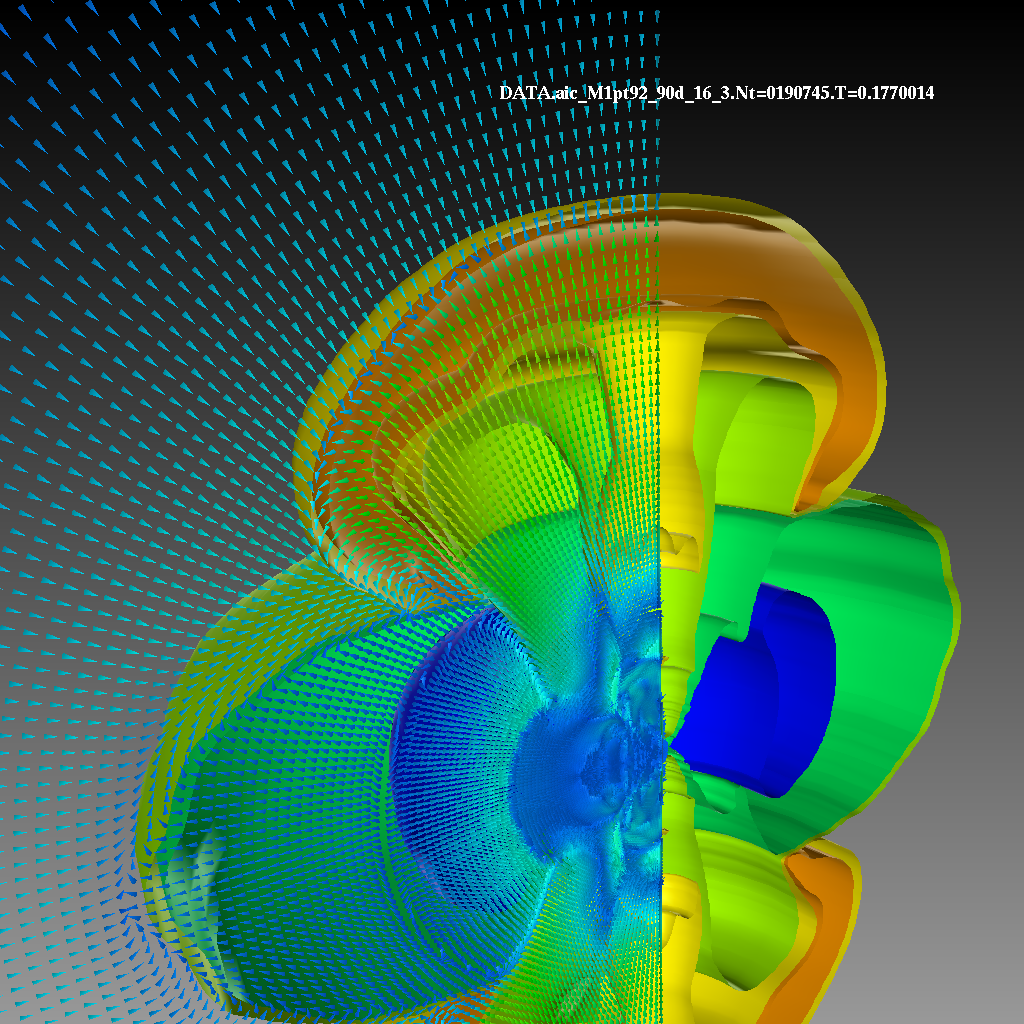
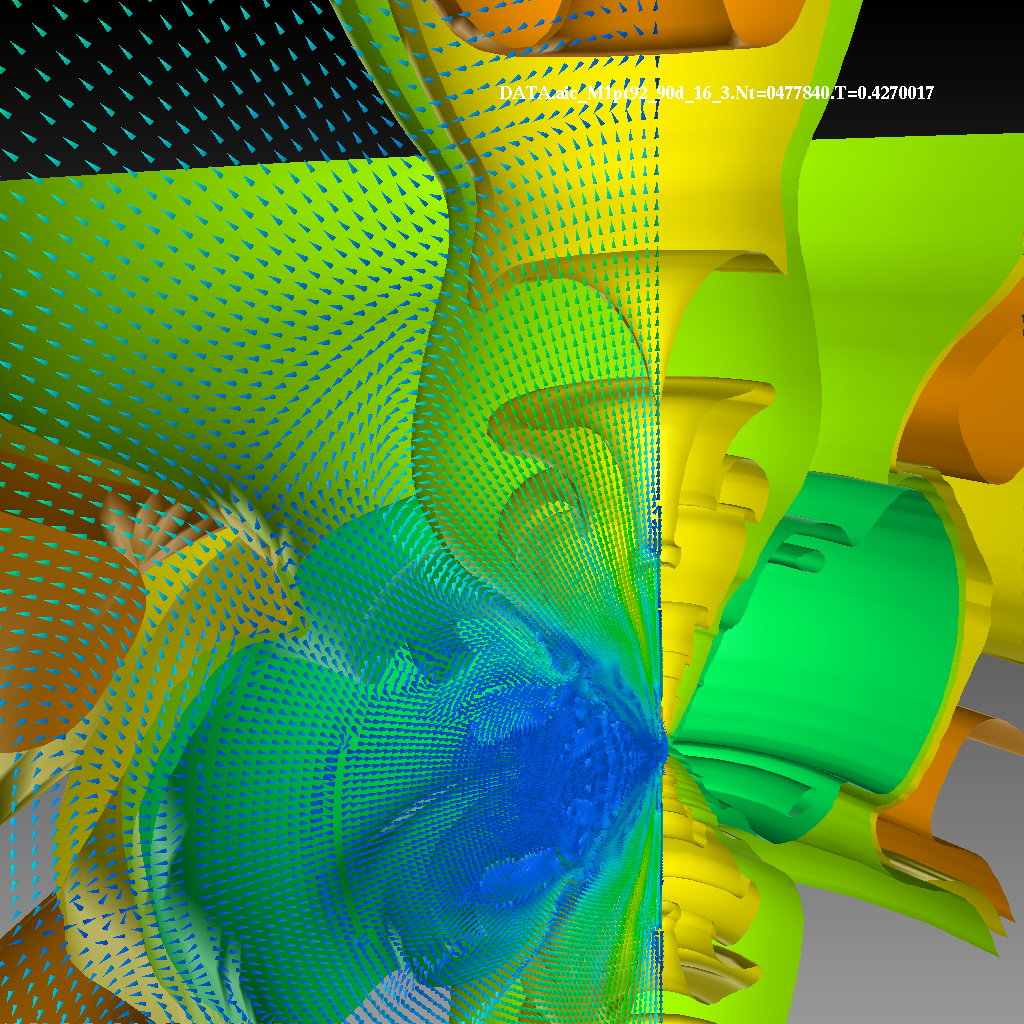
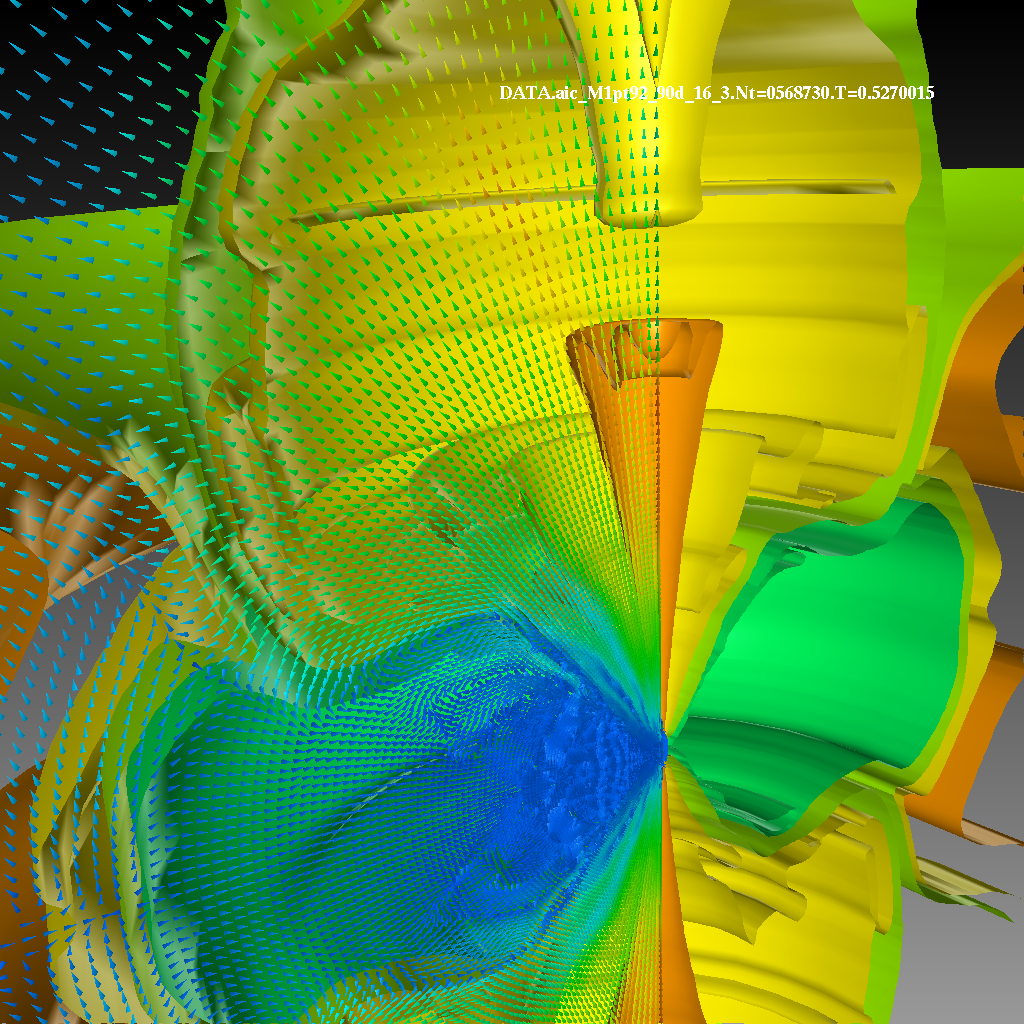
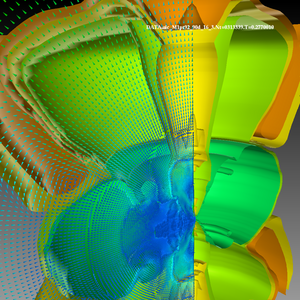
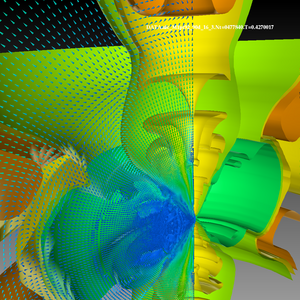
Figure 10. Entropy and velocity evolution.
|
|
|
|
|
|
MOVIE: Click here to see the time evolution
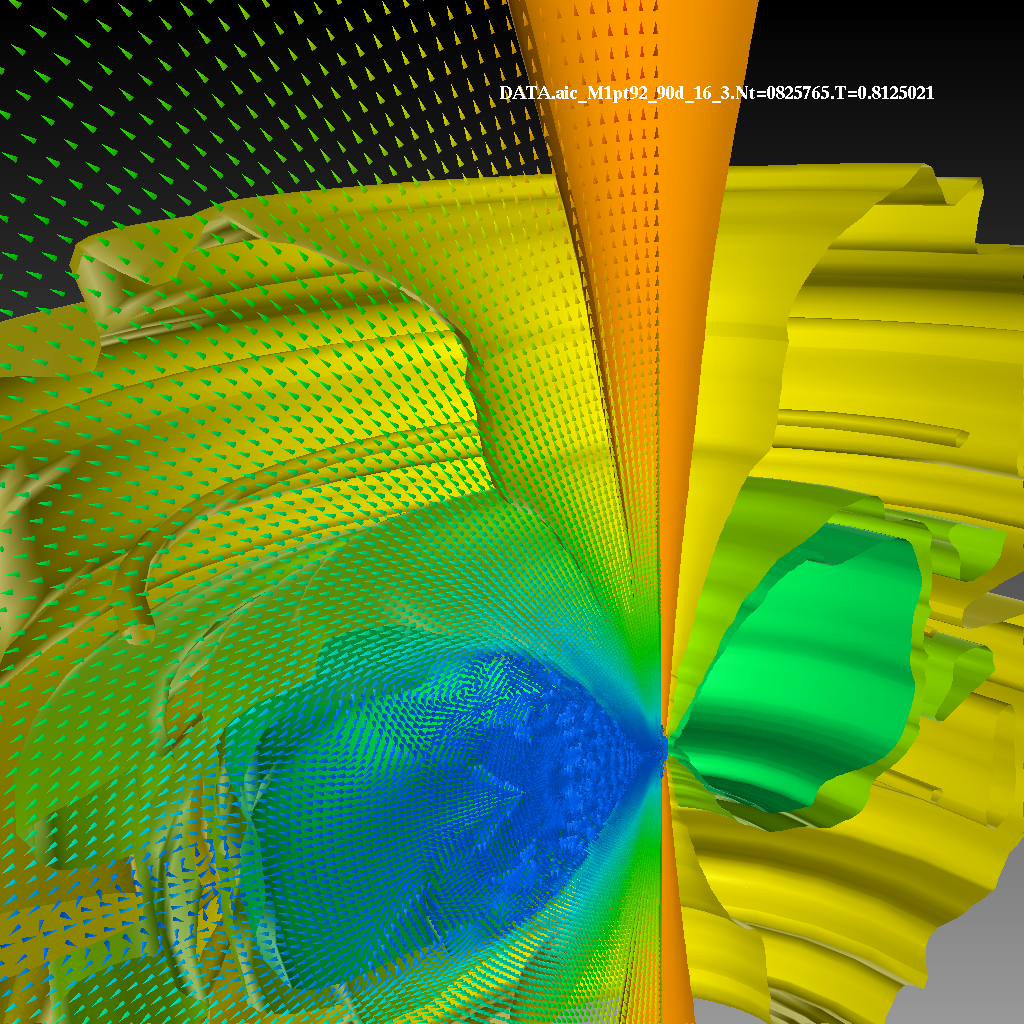
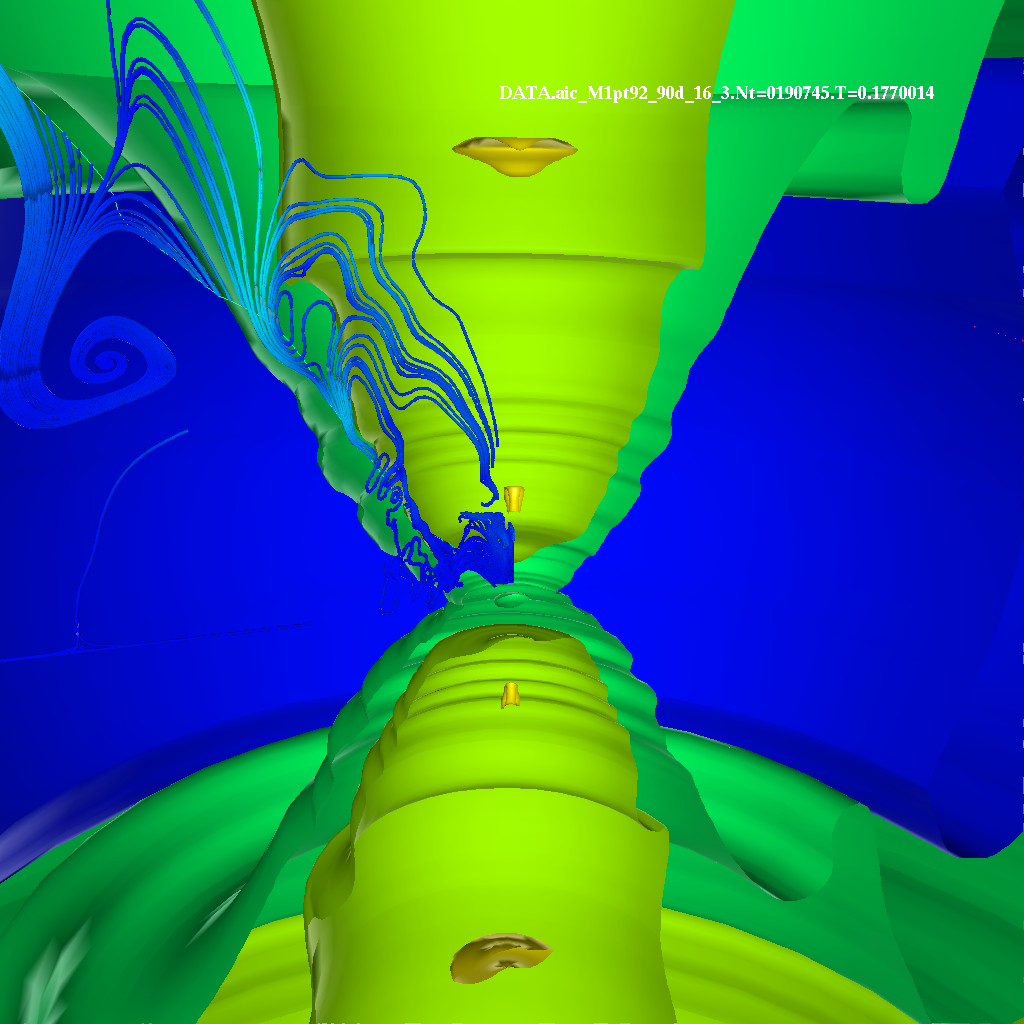
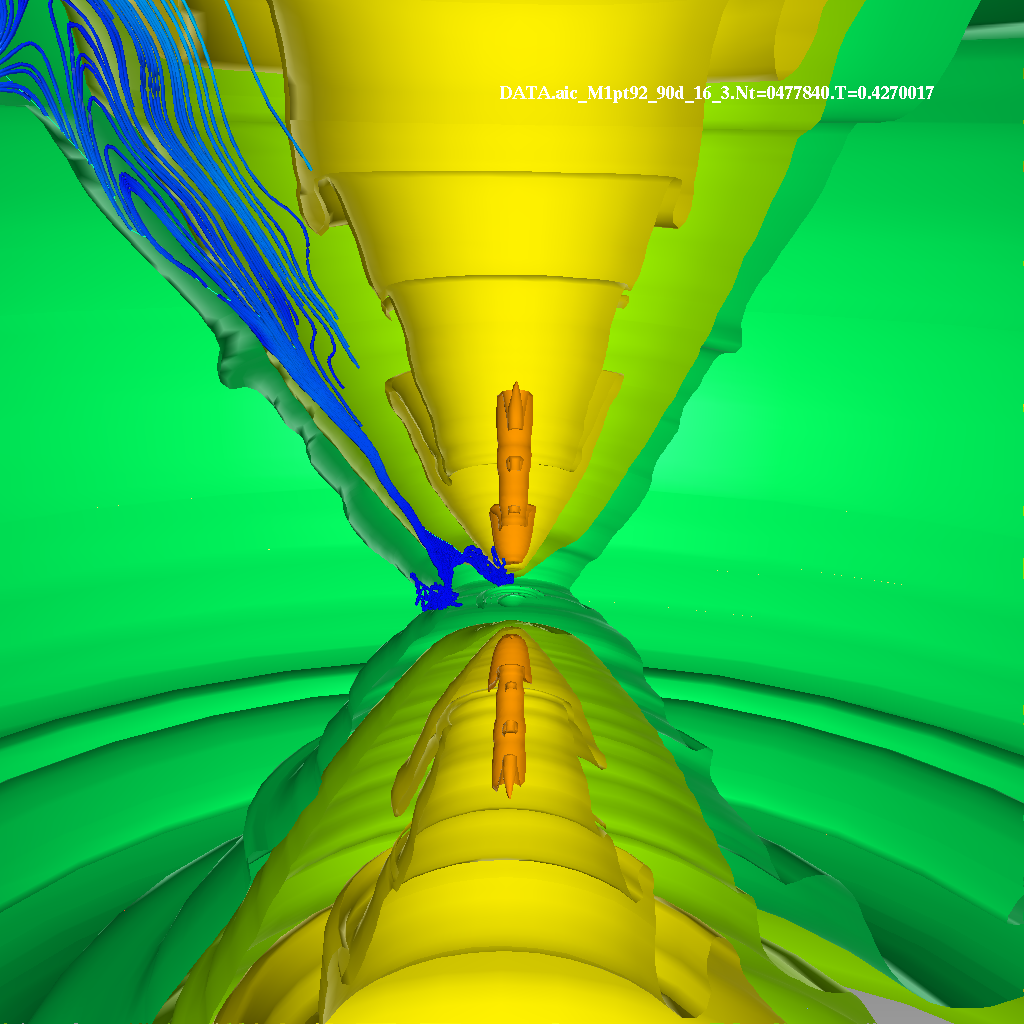
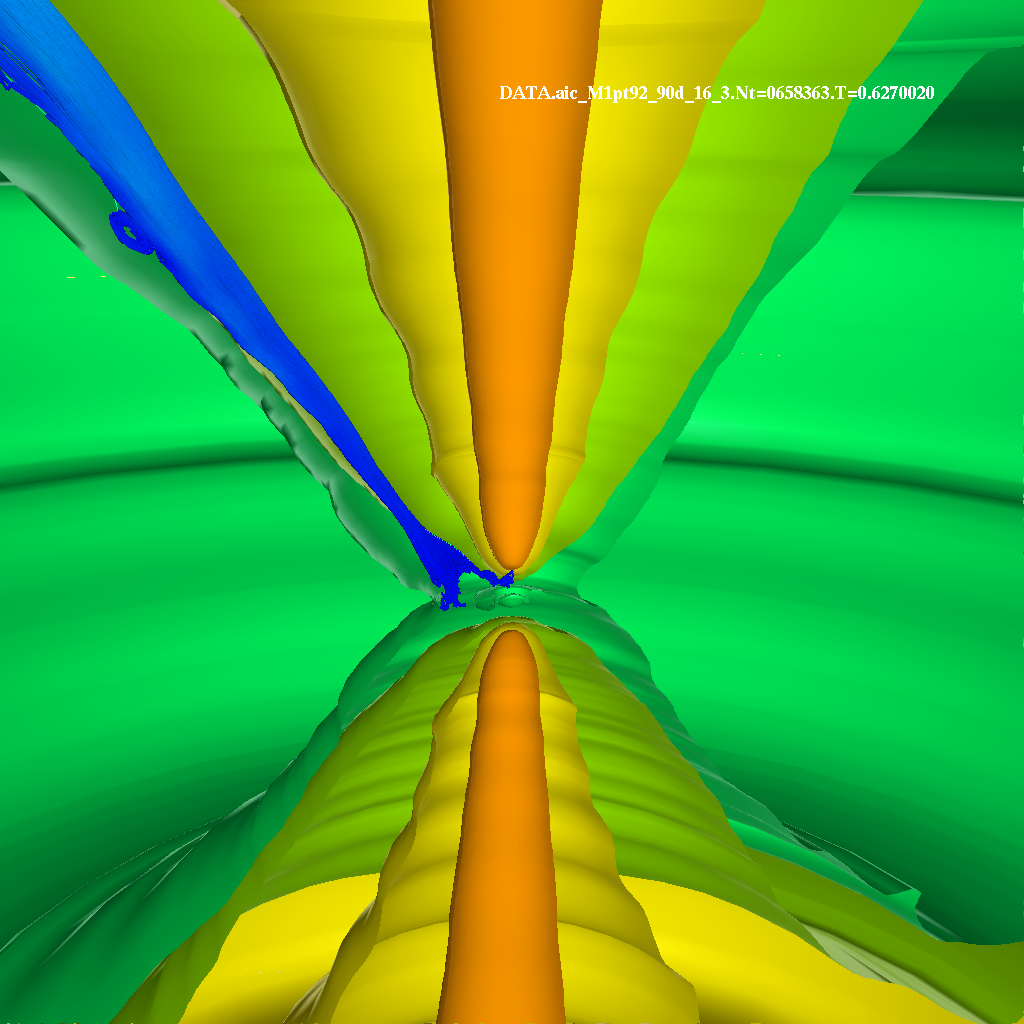
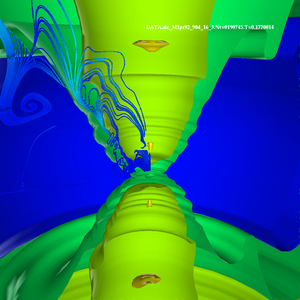
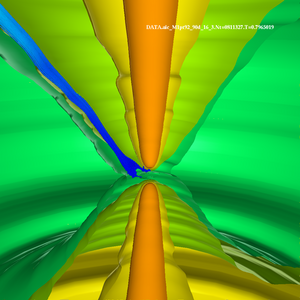
Entropy isosurfaces and velocity streamlines using Express
Figure 11. Entropy and velocity streamlines evolution.
|
|

|
|

|
|
MOVIE: Click here to see the time evolution
Express Reader
This is a very primitive Express reader for the snaz data based on the OpenDx reader that Don Fisher provided. To try it, download the express project tar ball, snaz_reader.tar.gz untar and unzip it (tar xzvf snaz_reader.tar.gz) , cd to the snaz_reader directory, and follow the instructions in the README. You will need a licensed Express installation. If you would like to see an illustrated README follow this link.
NOTE on making movies
For the movies made with VisIt I used the Python interface to make images of a good resolution and with lossless compression (1024x1024 PNG) and then I used ffmpeg to assemnble the movie. The version of ffmpeg that I used is the one that is included in the distribution of Ensight8. This page explains how to use it.
Cristina Siegerist, February 2007