Visualization Dot Com
IEEE Computer Graphics and Applications, May/June 2000Abstract
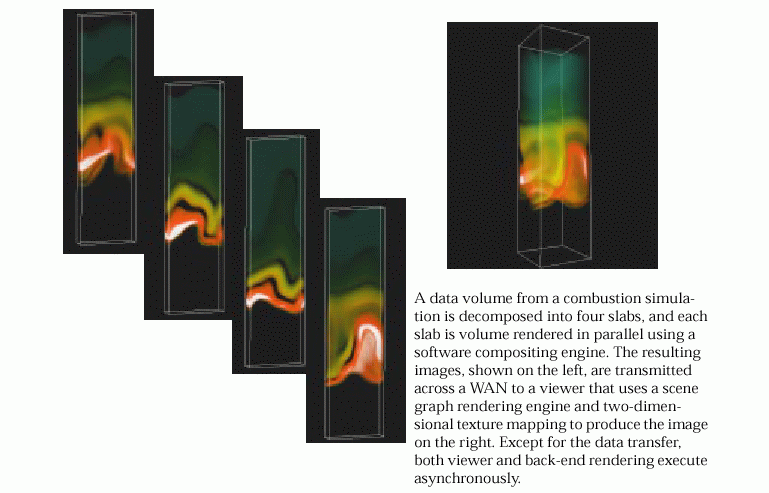
In this article, we explore the seeming well-worn subject of distance-based, or remote visualization. Current practices in remote visualization tend to clump into two broad categories. One approach, which we'll call render-remote, is to render an image remotely, then transmit the image to the user. Another option, render-local, transfers raw data to the user, where it is then visualized and rendered on the local workstation. With advances in networking and graphics technology, we can explore a class of approaches from a new, third category. With this third category, which we'll call shared, or "dot com" visualizaiton, we stand to reap the best of both worlds: minimzed data transfers and workstation accelerated rendering. We will describe a prototype system called Visapult currently under development at Lawrence Berkeley National Laboratory that strikes such a balance, achieving a blended, scalable visualization tool. "Dot com" visualization means that remote and local resources collaborate and negotiate, combining capabilities to produce a final product.
Our submission: PDF Source (66303 bytes), LBNL-44871
IEEE CG&A Galley Proof:PDF Source (283995 bytes).
Visapult - A Prototype Remote and Distributed Visualization Application and Framework
Siggraph 2000, New Orleans, LA. July 23-28, 2000.
In the Web Rendering session of the Applications & Sketches Track.
PDF Source (34020 bytes), LBNL-45215
|
|
Using High-Speed WANs and Network Data Caches to Enable Remote and Distributed Visualization
Accepted to SC00, Dallas TX, November 4-10, 2000.
Abstract
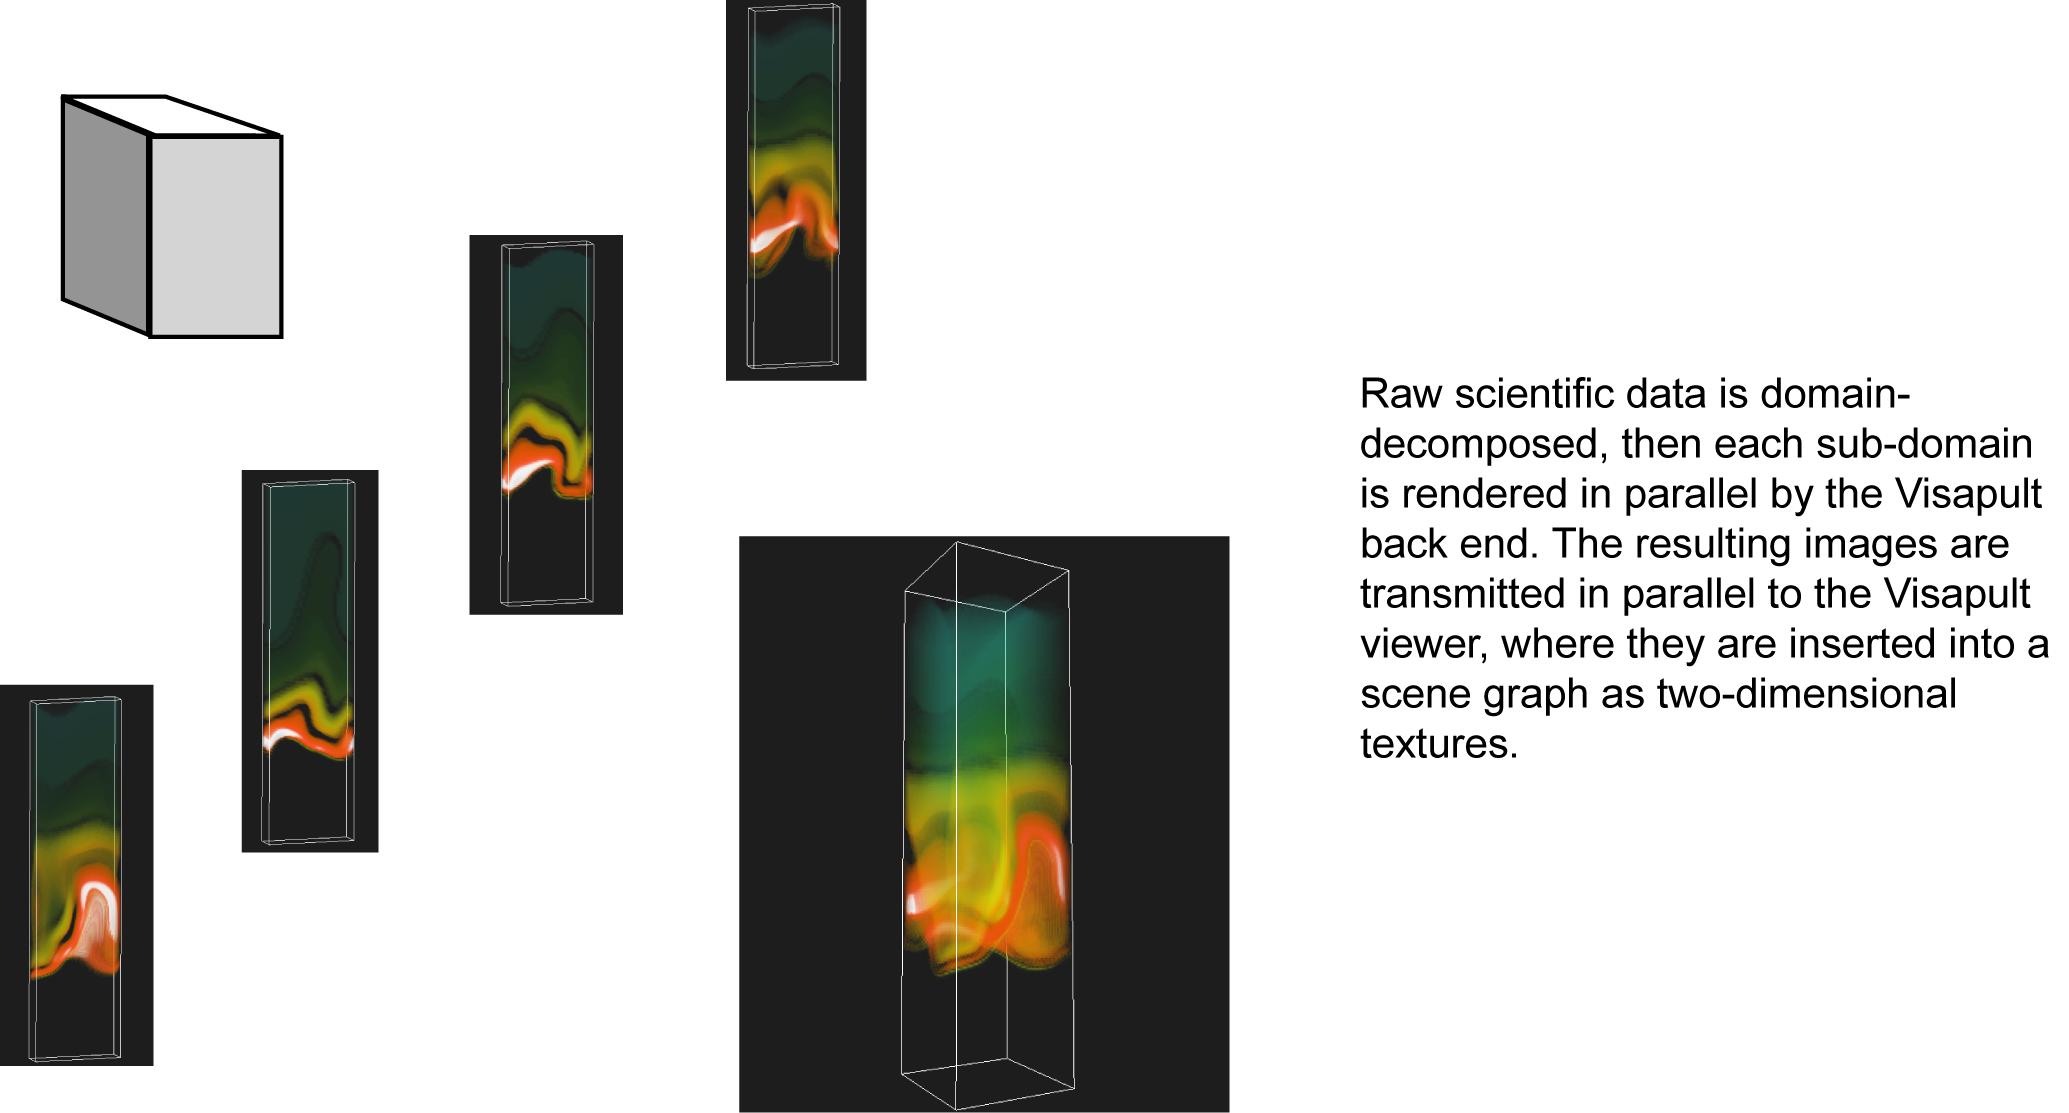
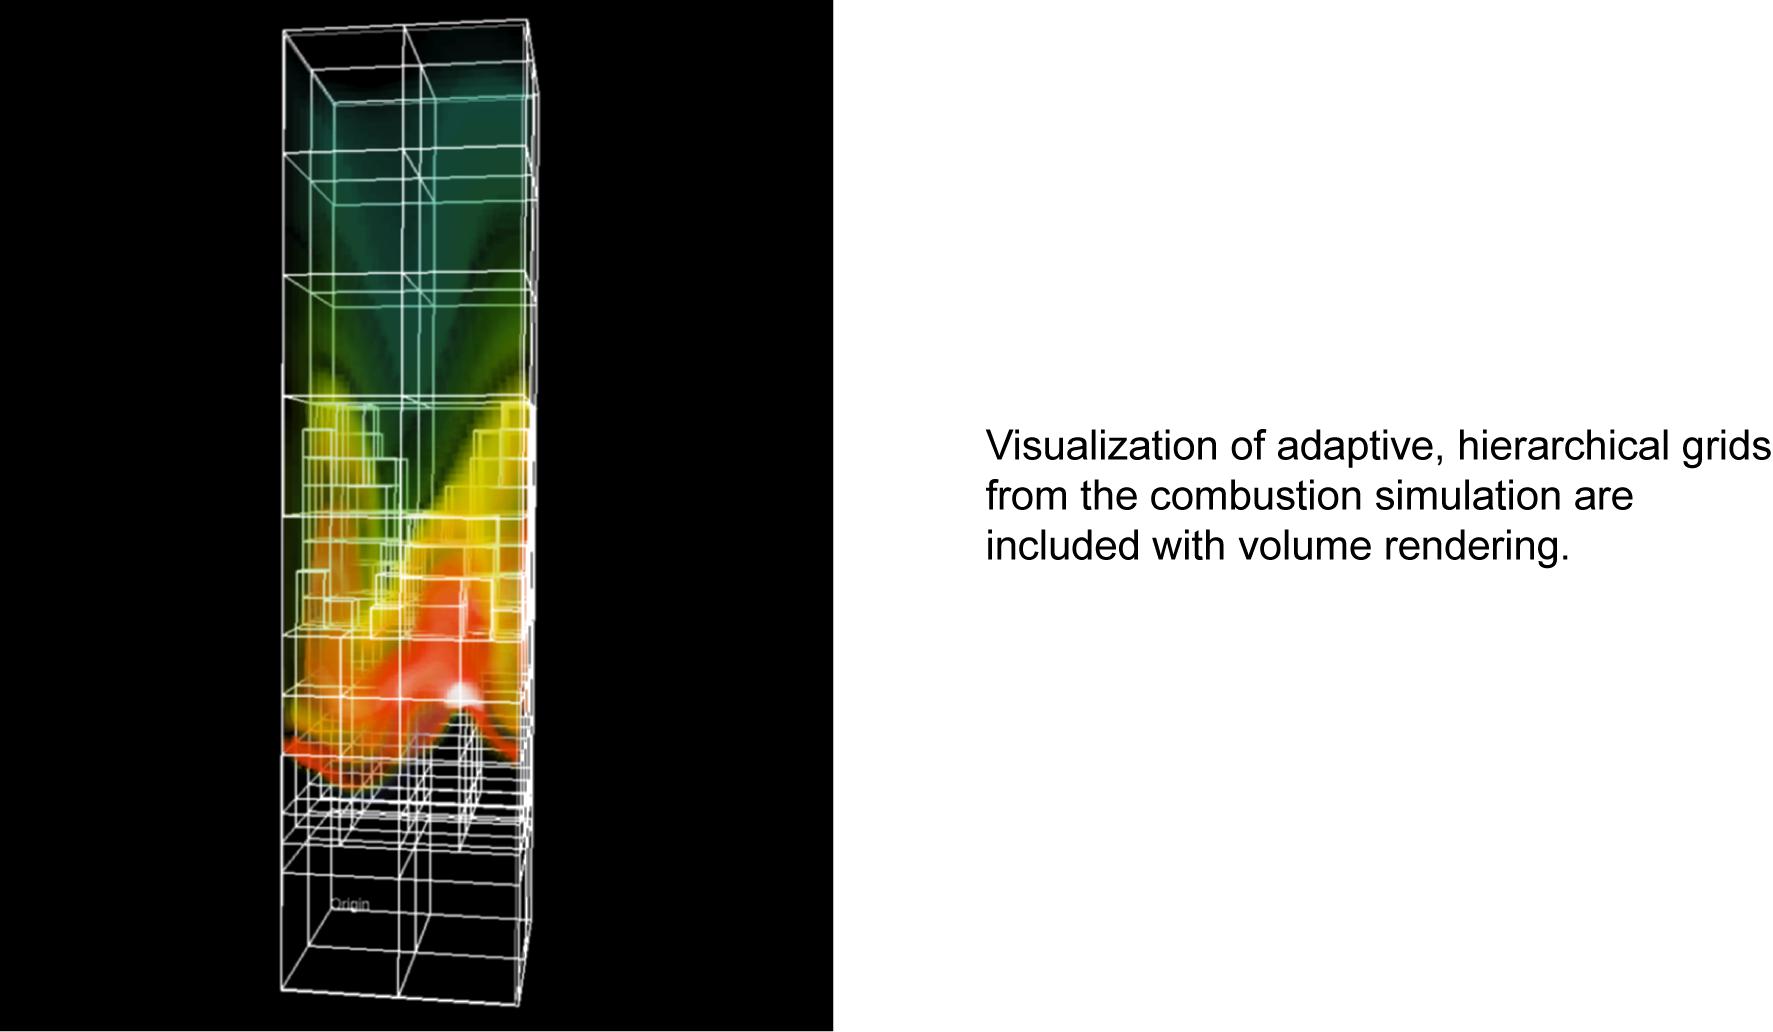
Visapult is a prototype application and framework for remote visualization of large scientific datasets. We approach the technical challenges of tera-scale visualization with a unique architecture that employs high speed WANs and network data caches for data staging and transmission. This architecture allows for the use of available cache and compute resources at arbitrary locations on the network. High data throughput rates and network utilization are achieved by parallelizing I/O at each stage in the application, and by pipelining the visualization process. On the desktop, the graphics interactivity is effectively decoupled from the latency inherent in network applications. We present a detailed performance analysis of the application, and improvements resulting from field-test analysis conducted as part of the DOE Combustion Corridor project.
PDF Source, 283262 bytes, LBNL-45365

|
|