This is an archival copy of the Visualization Group's web page 1998 to 2017. For current information, please vist our group's new web page.
Beam Dynamics high resolution images
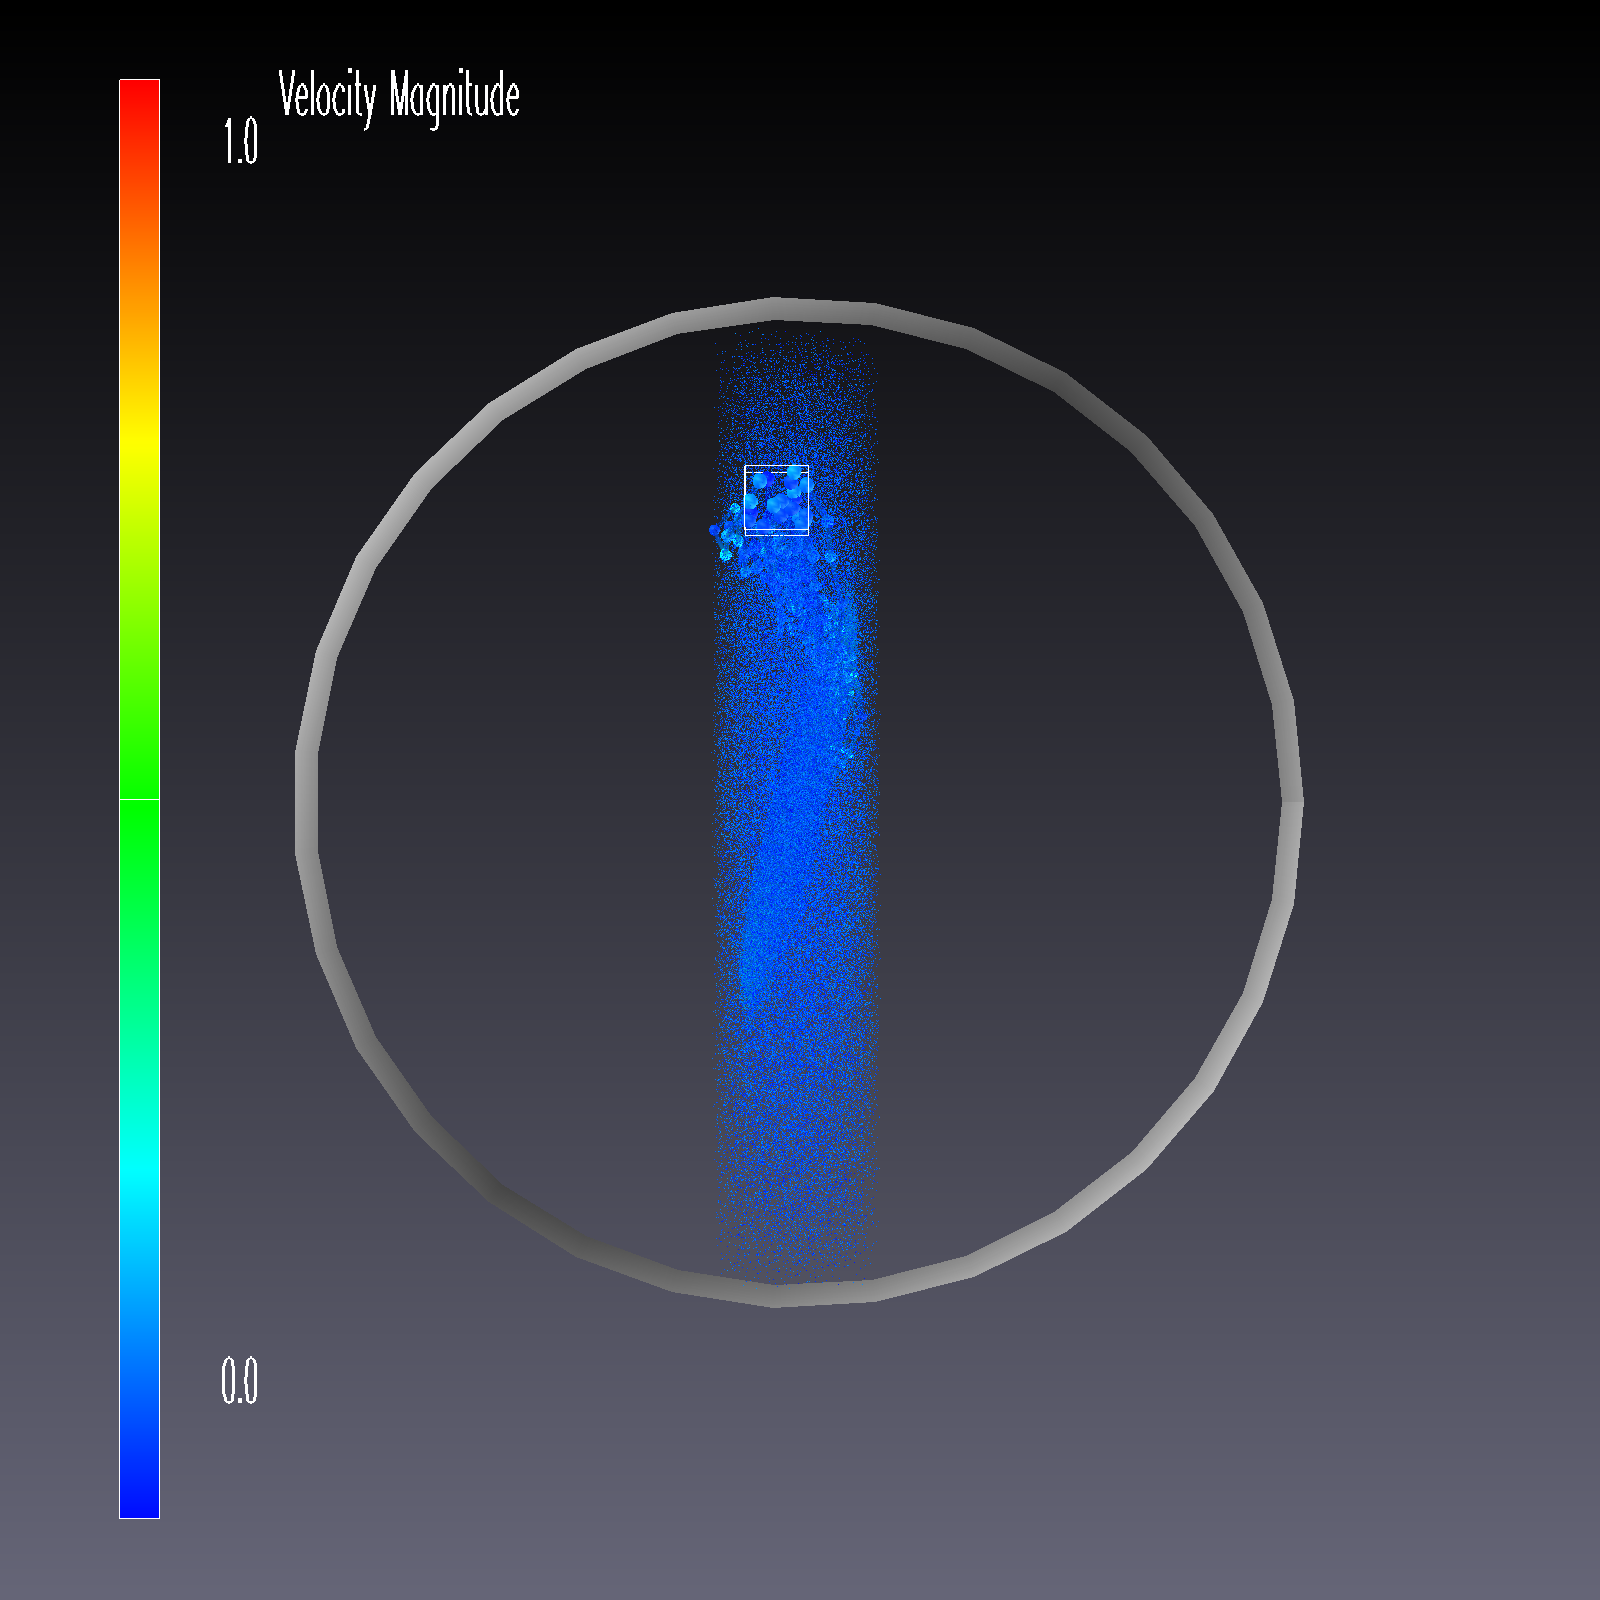
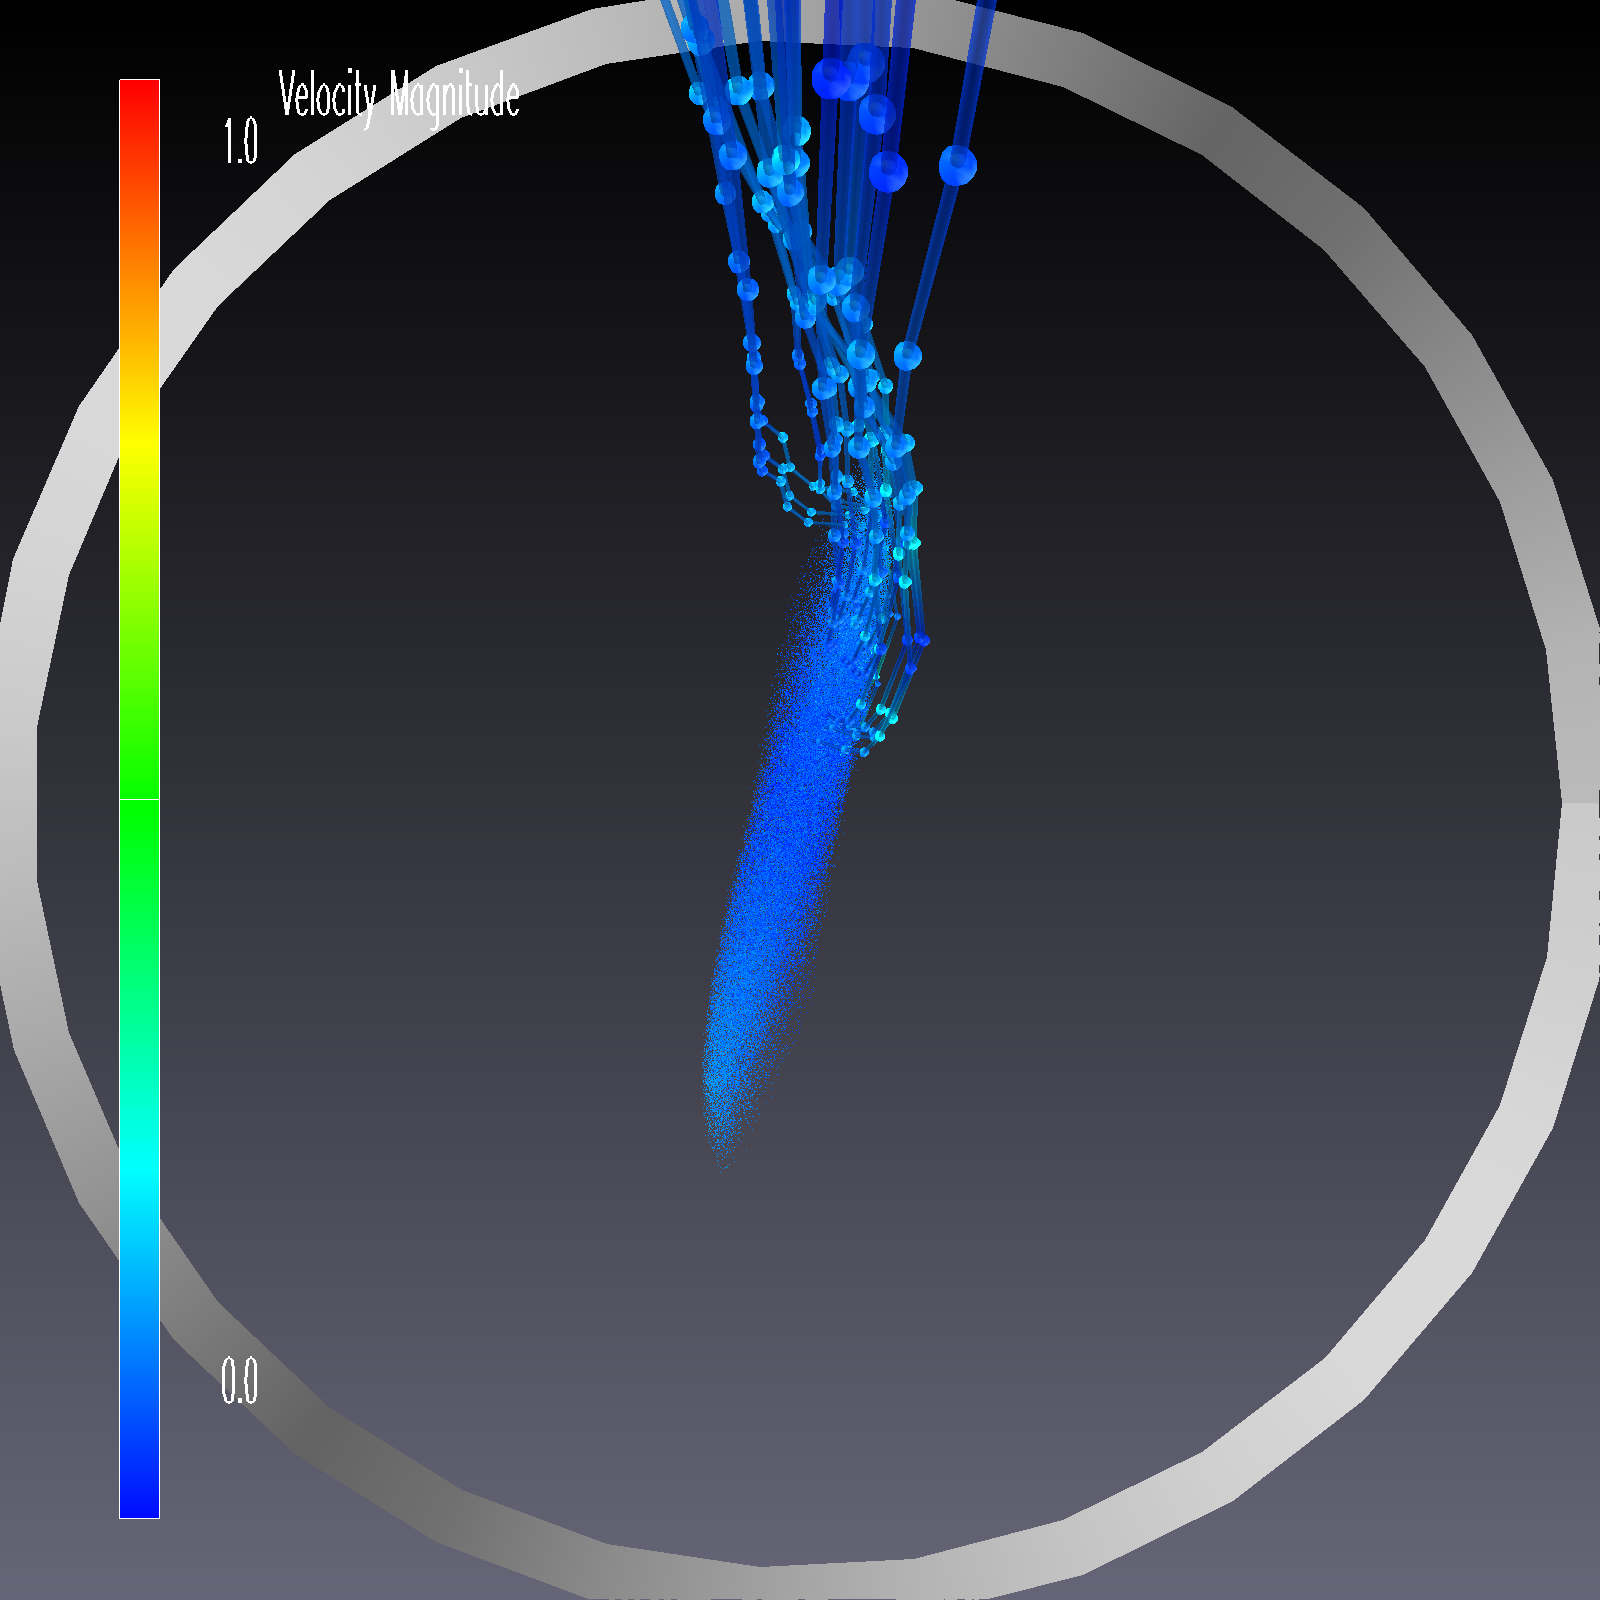
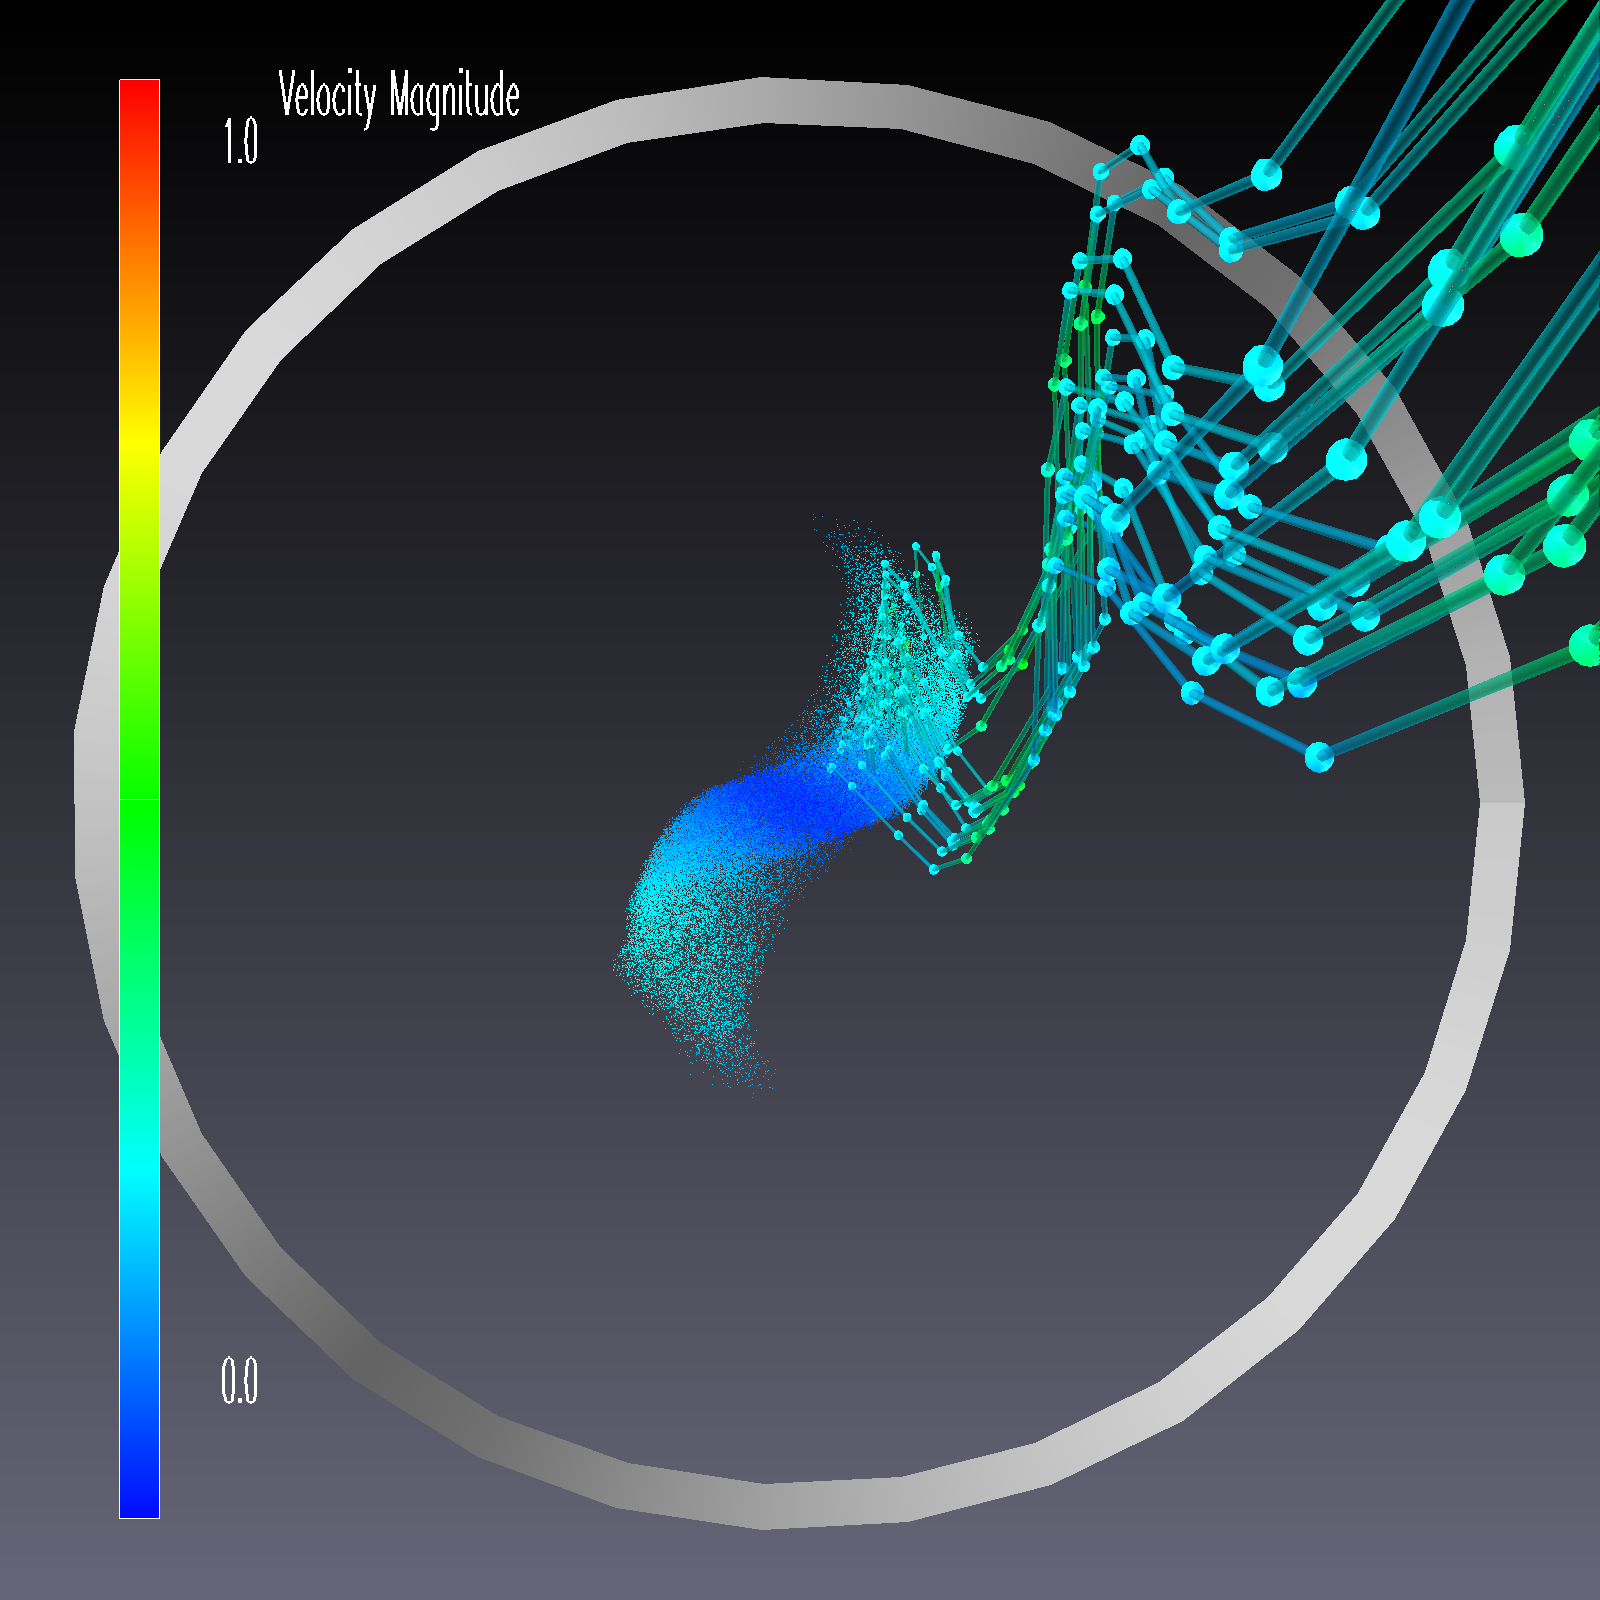
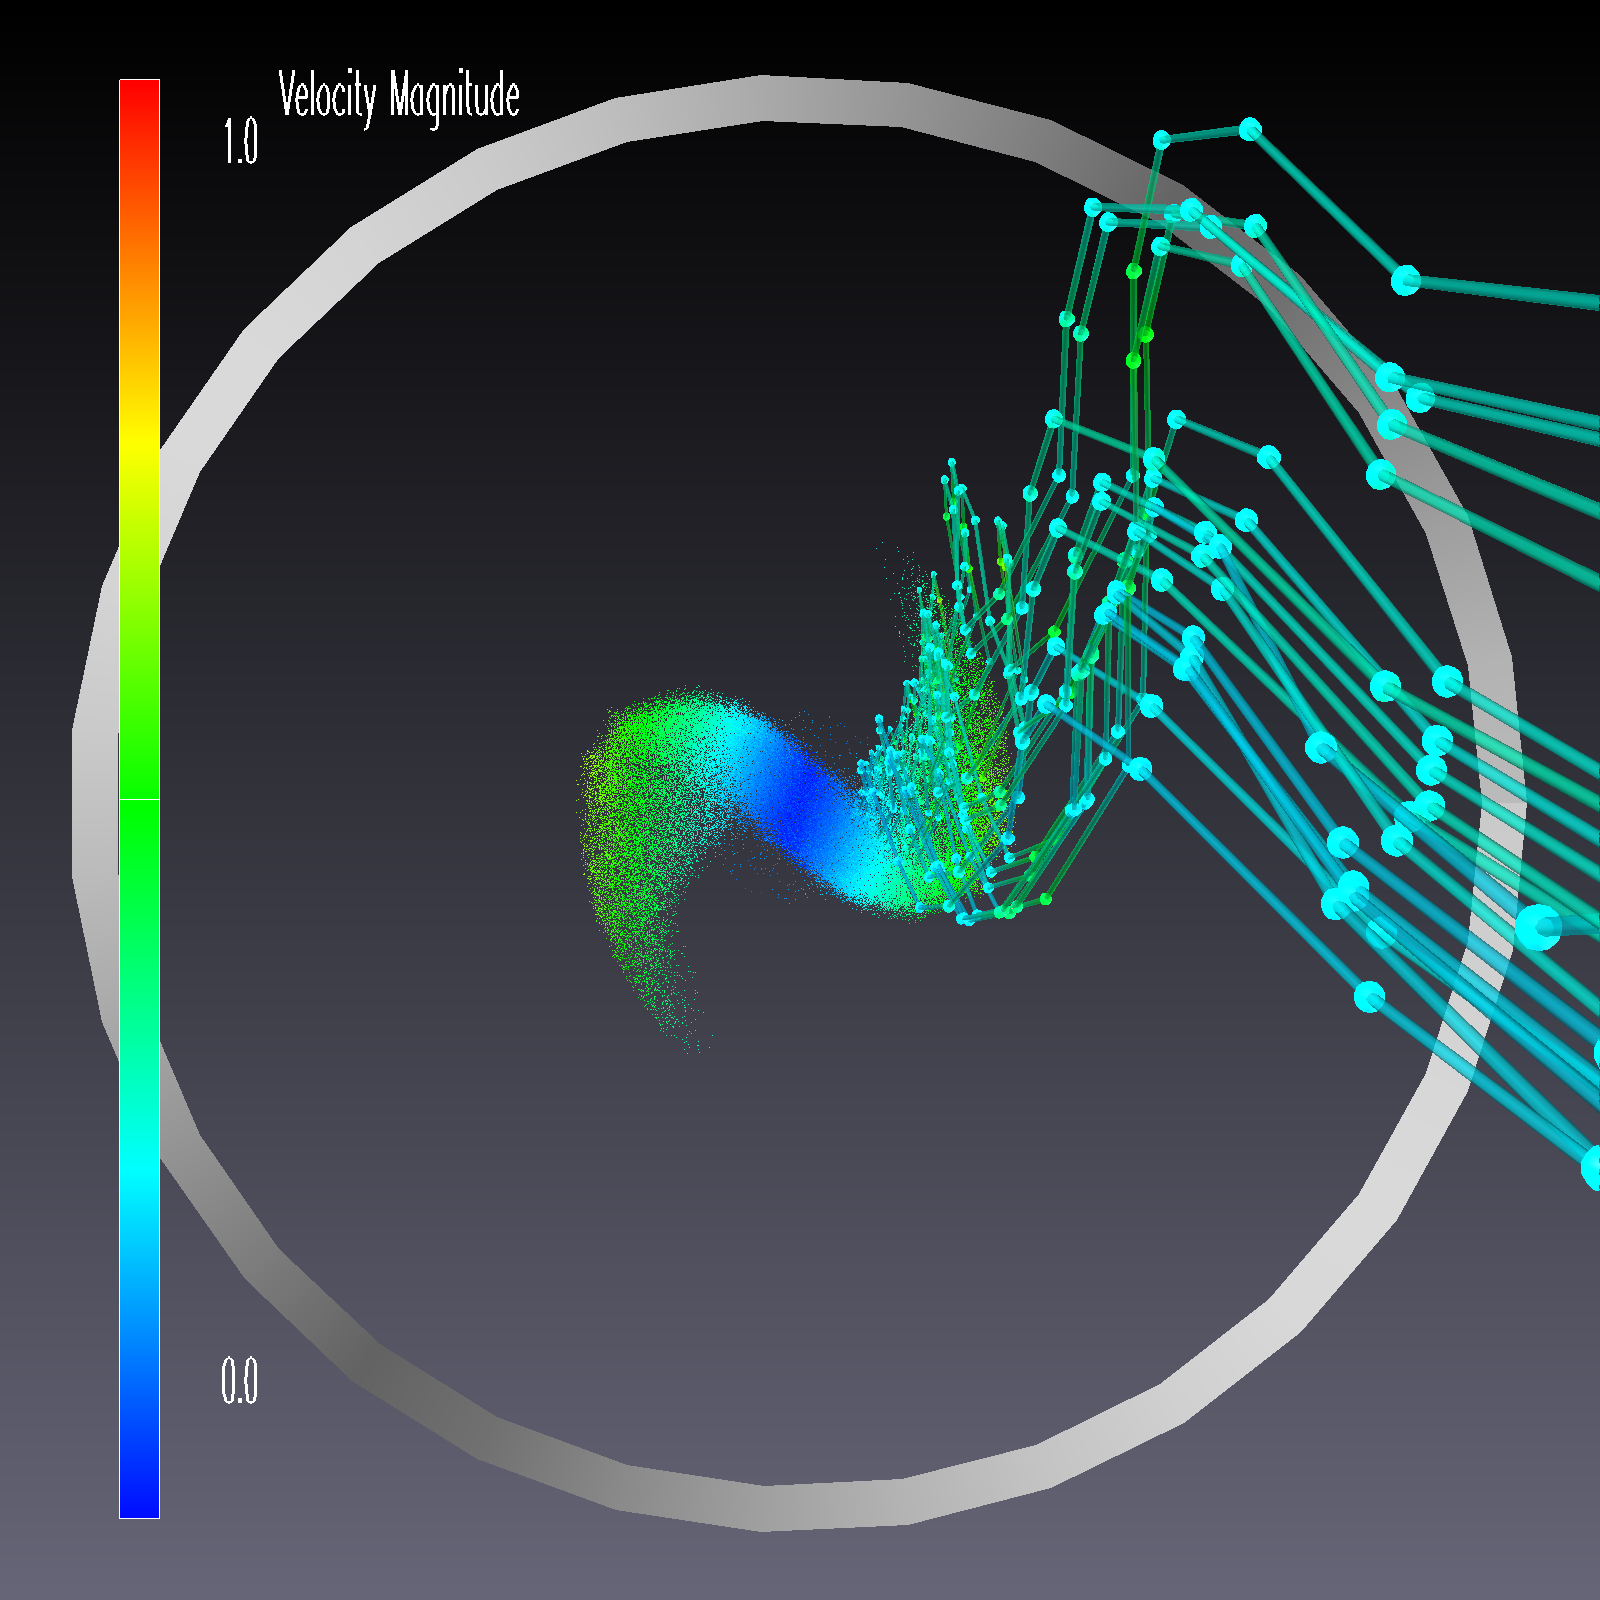
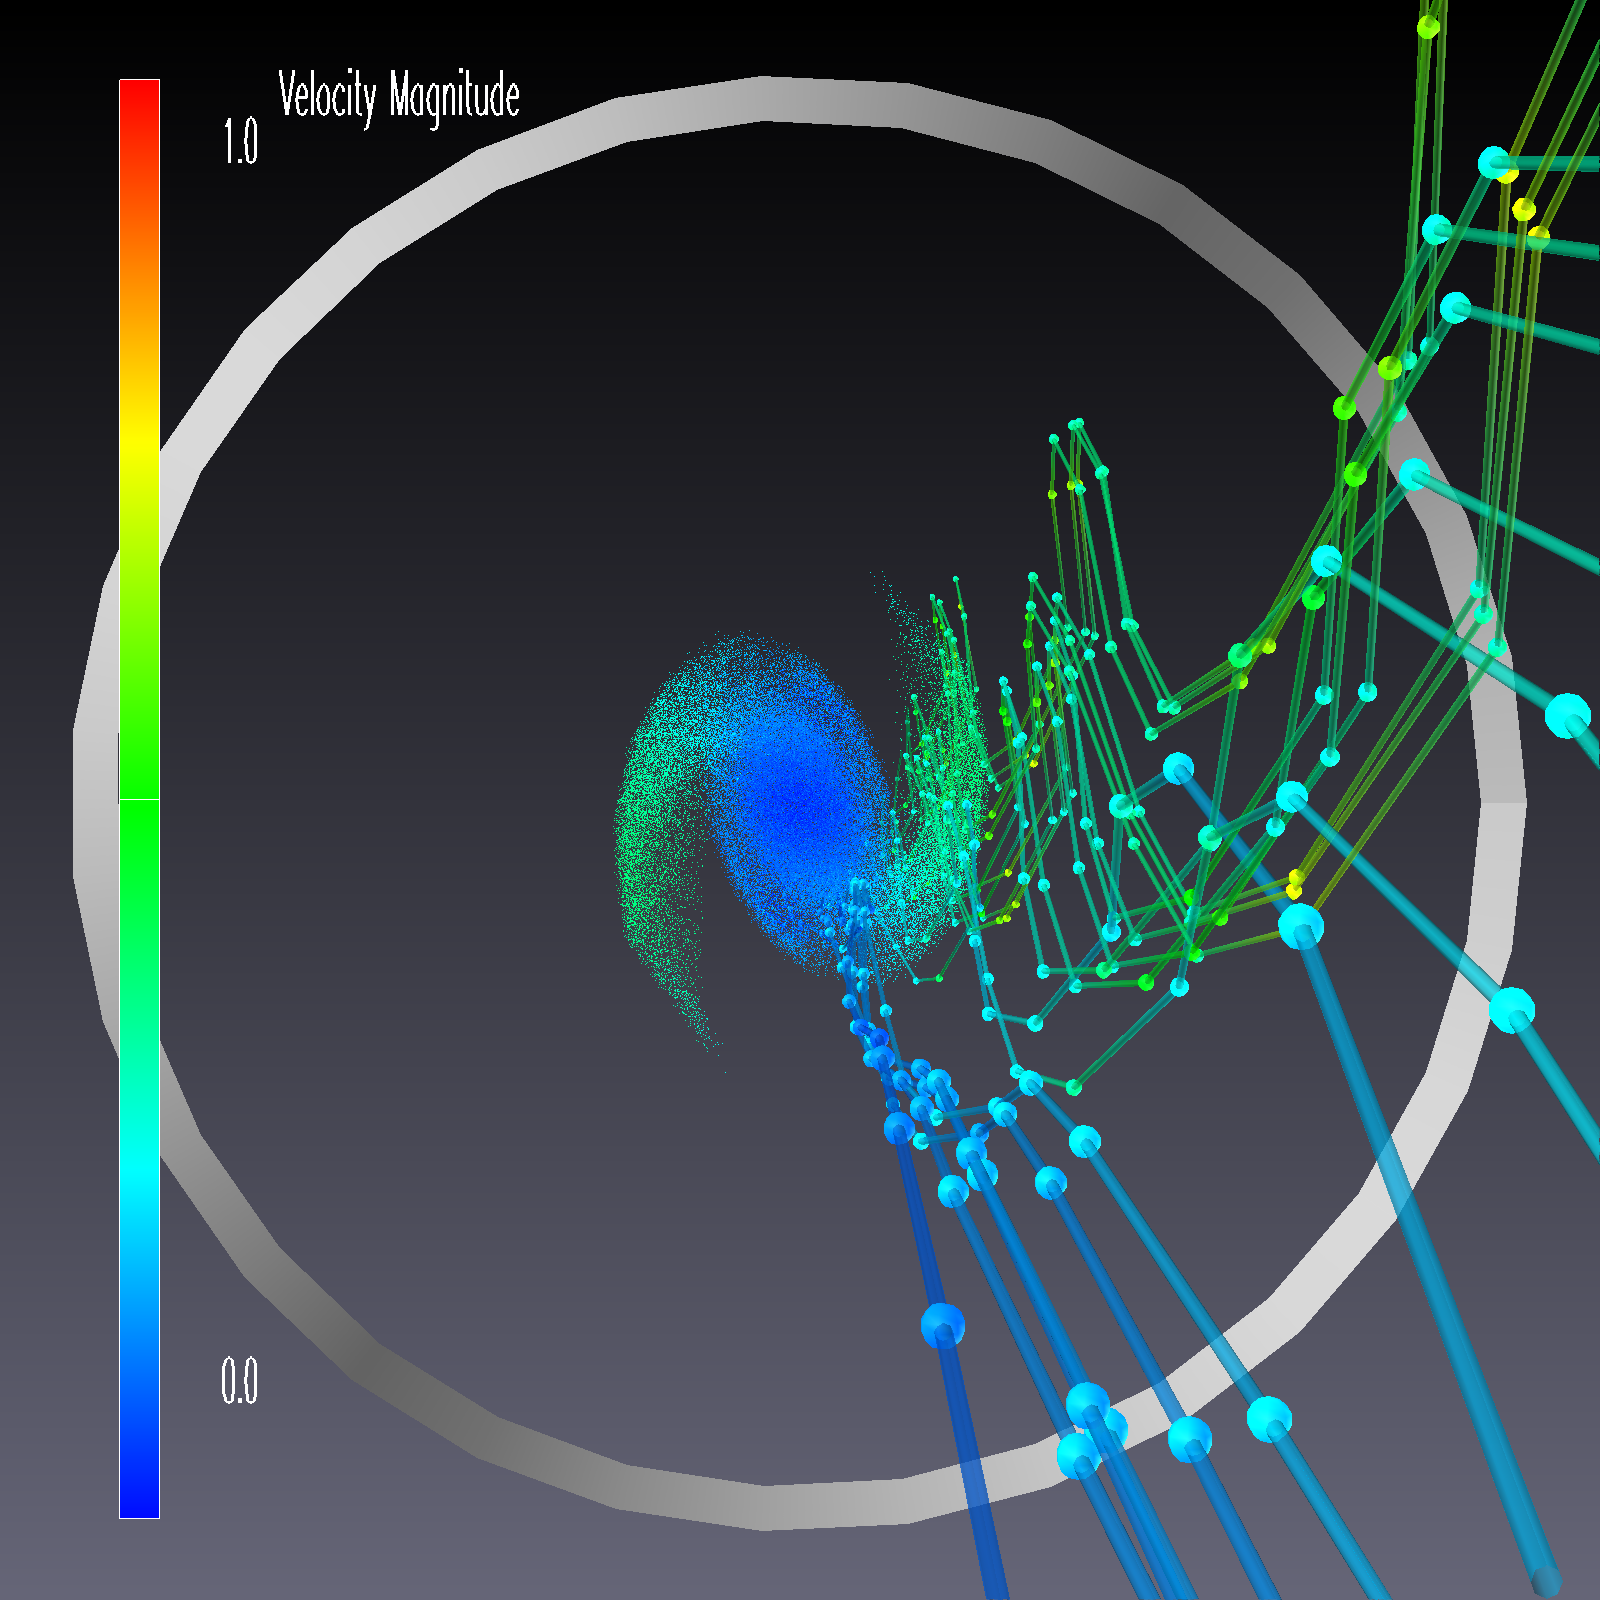
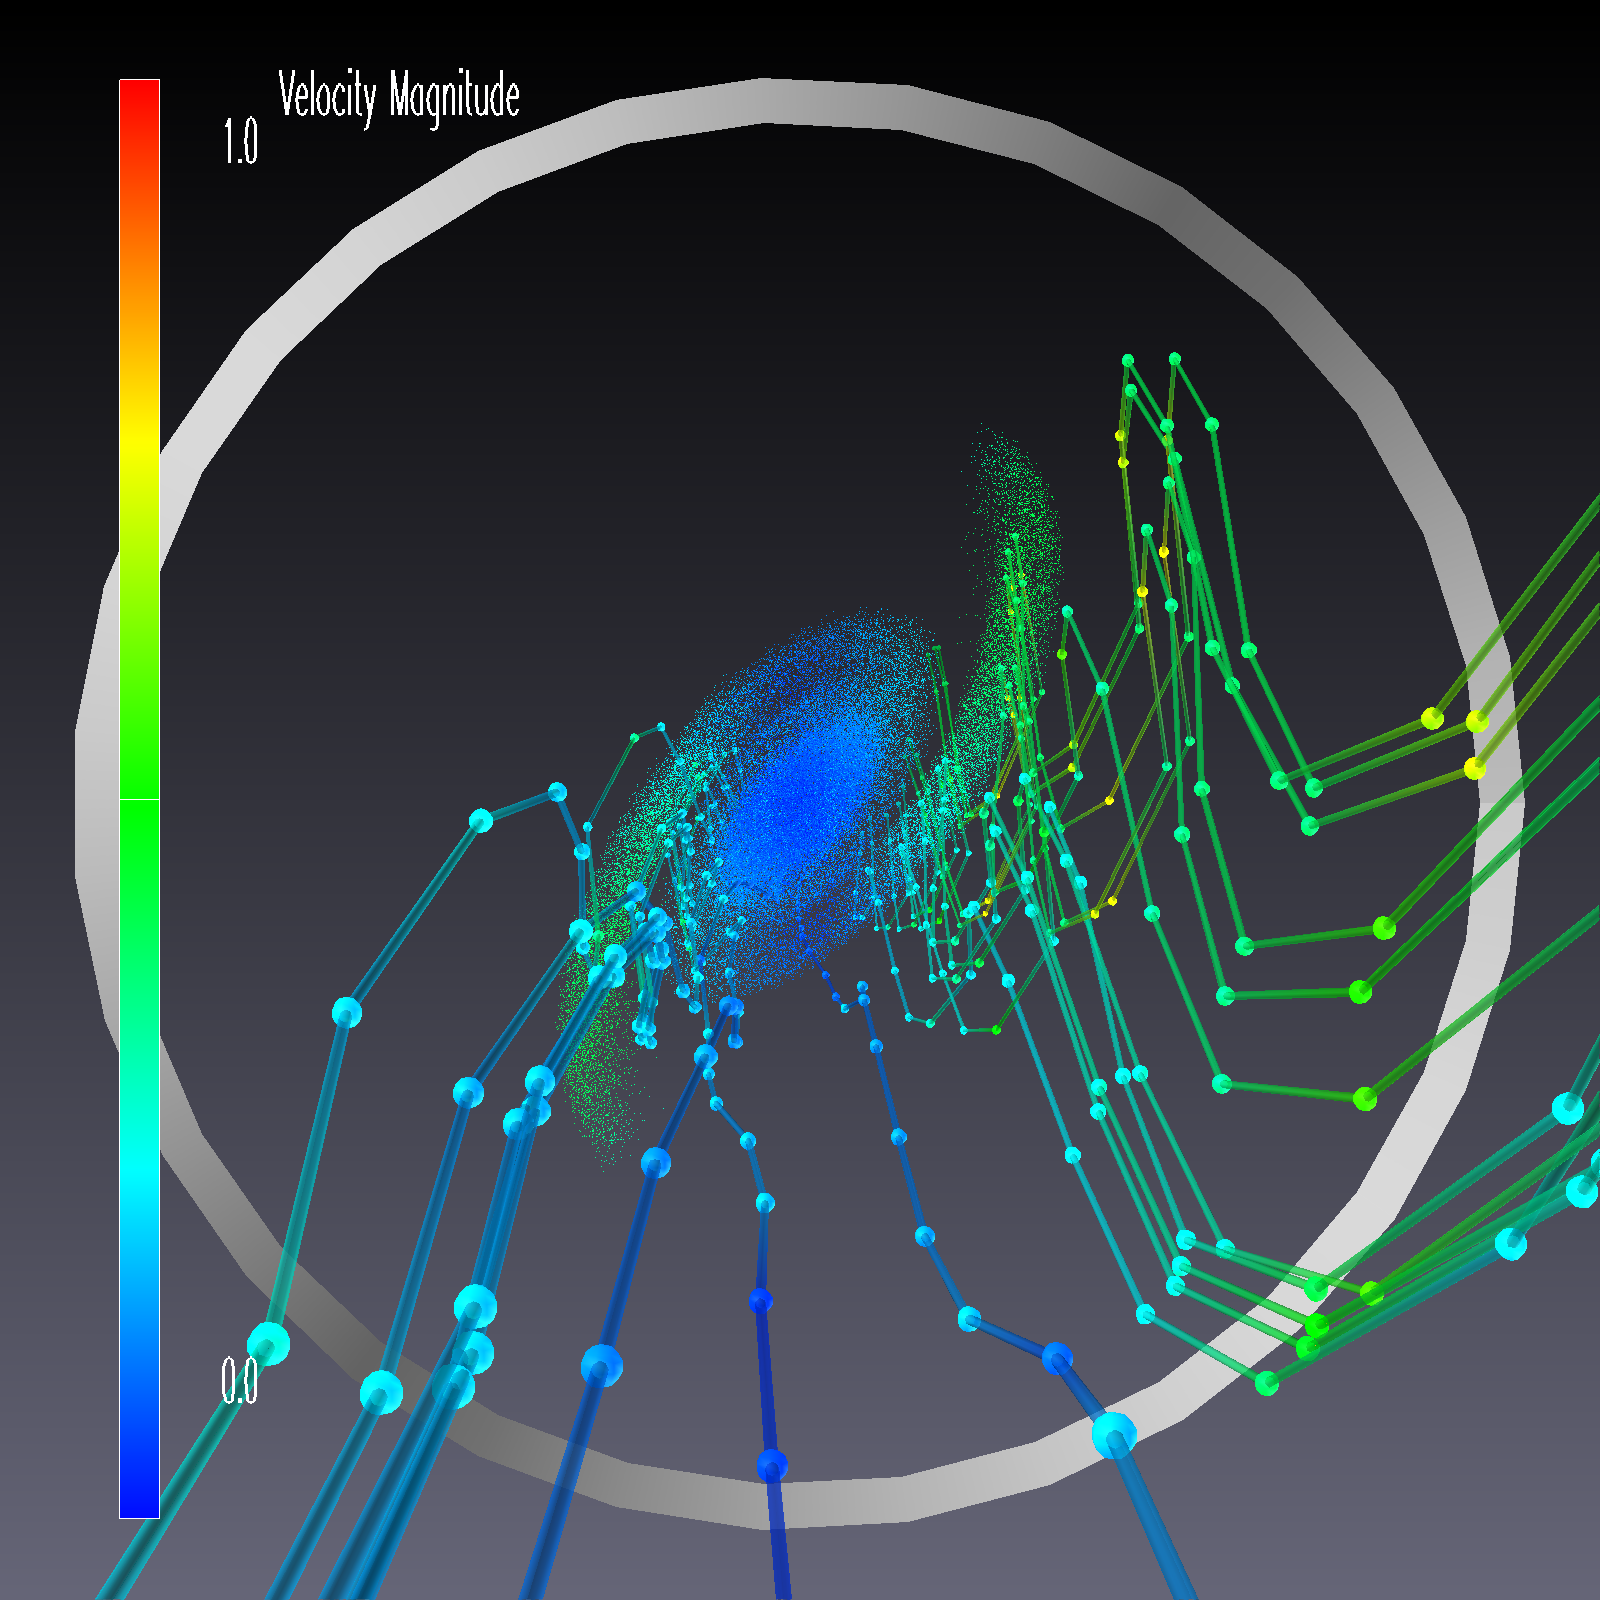
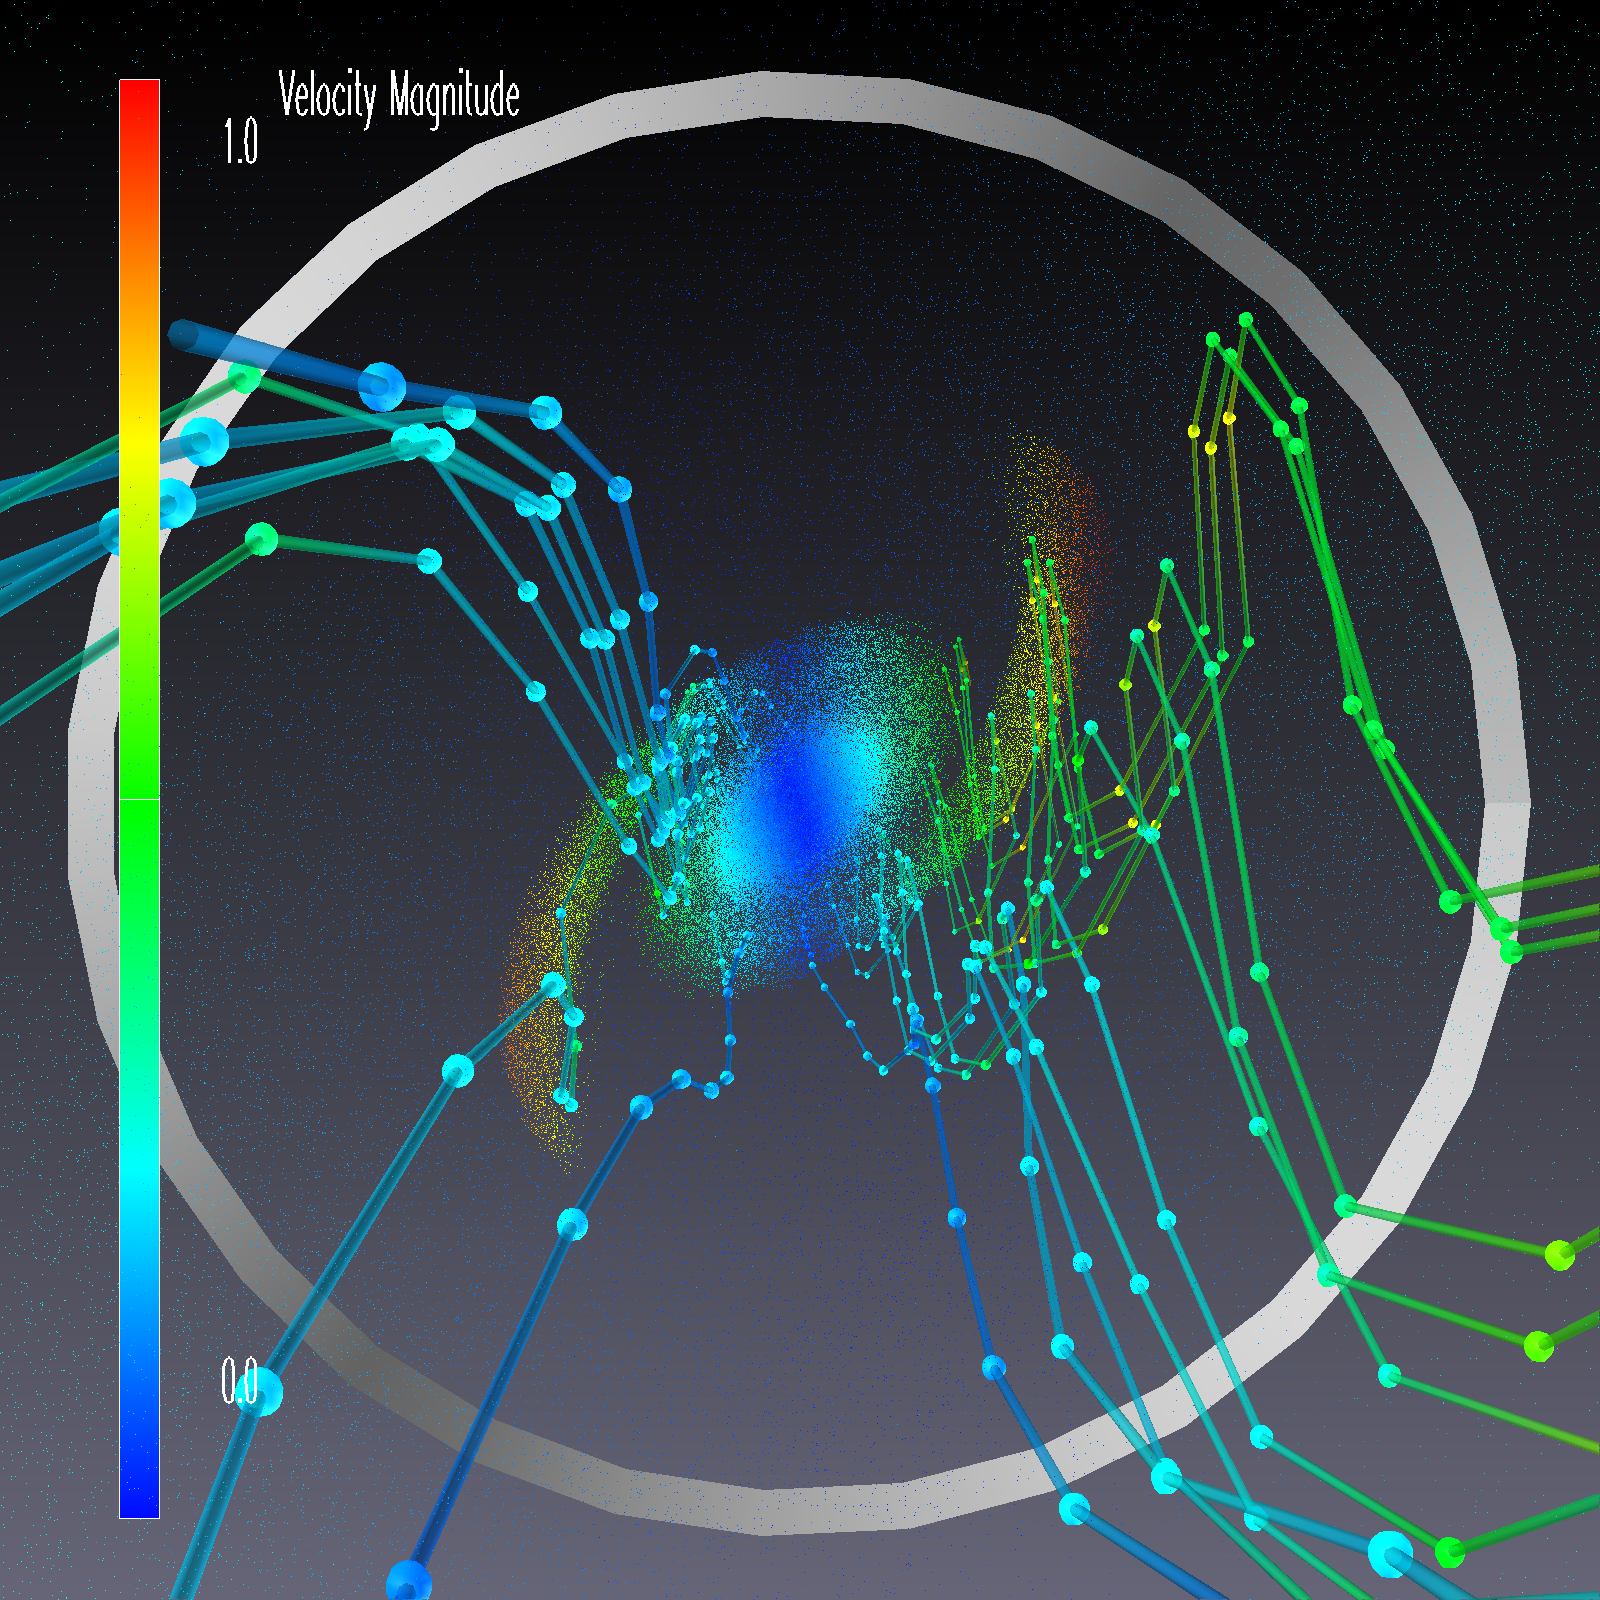
These images were generated using a custom application developed with AVS/Express (www.avs.com) The beam is followed in time along the beam pipe from an initial (step 0) configuration to a final one (step 276). Using an interactive box some particles were selected in the initial configuration and tracked as the simulation progresses (spheres), their trajectories are shown as lines. The beam (only renderend every 20 timesteps is shown as points). The colormap shows the magnitude of the velocities.
Particle tracking
Click in an image to see a high resolution version. The images are numbered with their corresponding time step.
|
|
|
|
|
|
|

|
Andreas Adelmann, PSI