Tutorial 4: Particle plots
VisIt operations on particles work best if particles are represented on a
'particle mesh'. In order to convert a 2D mesh to a particle mesh, you can
use
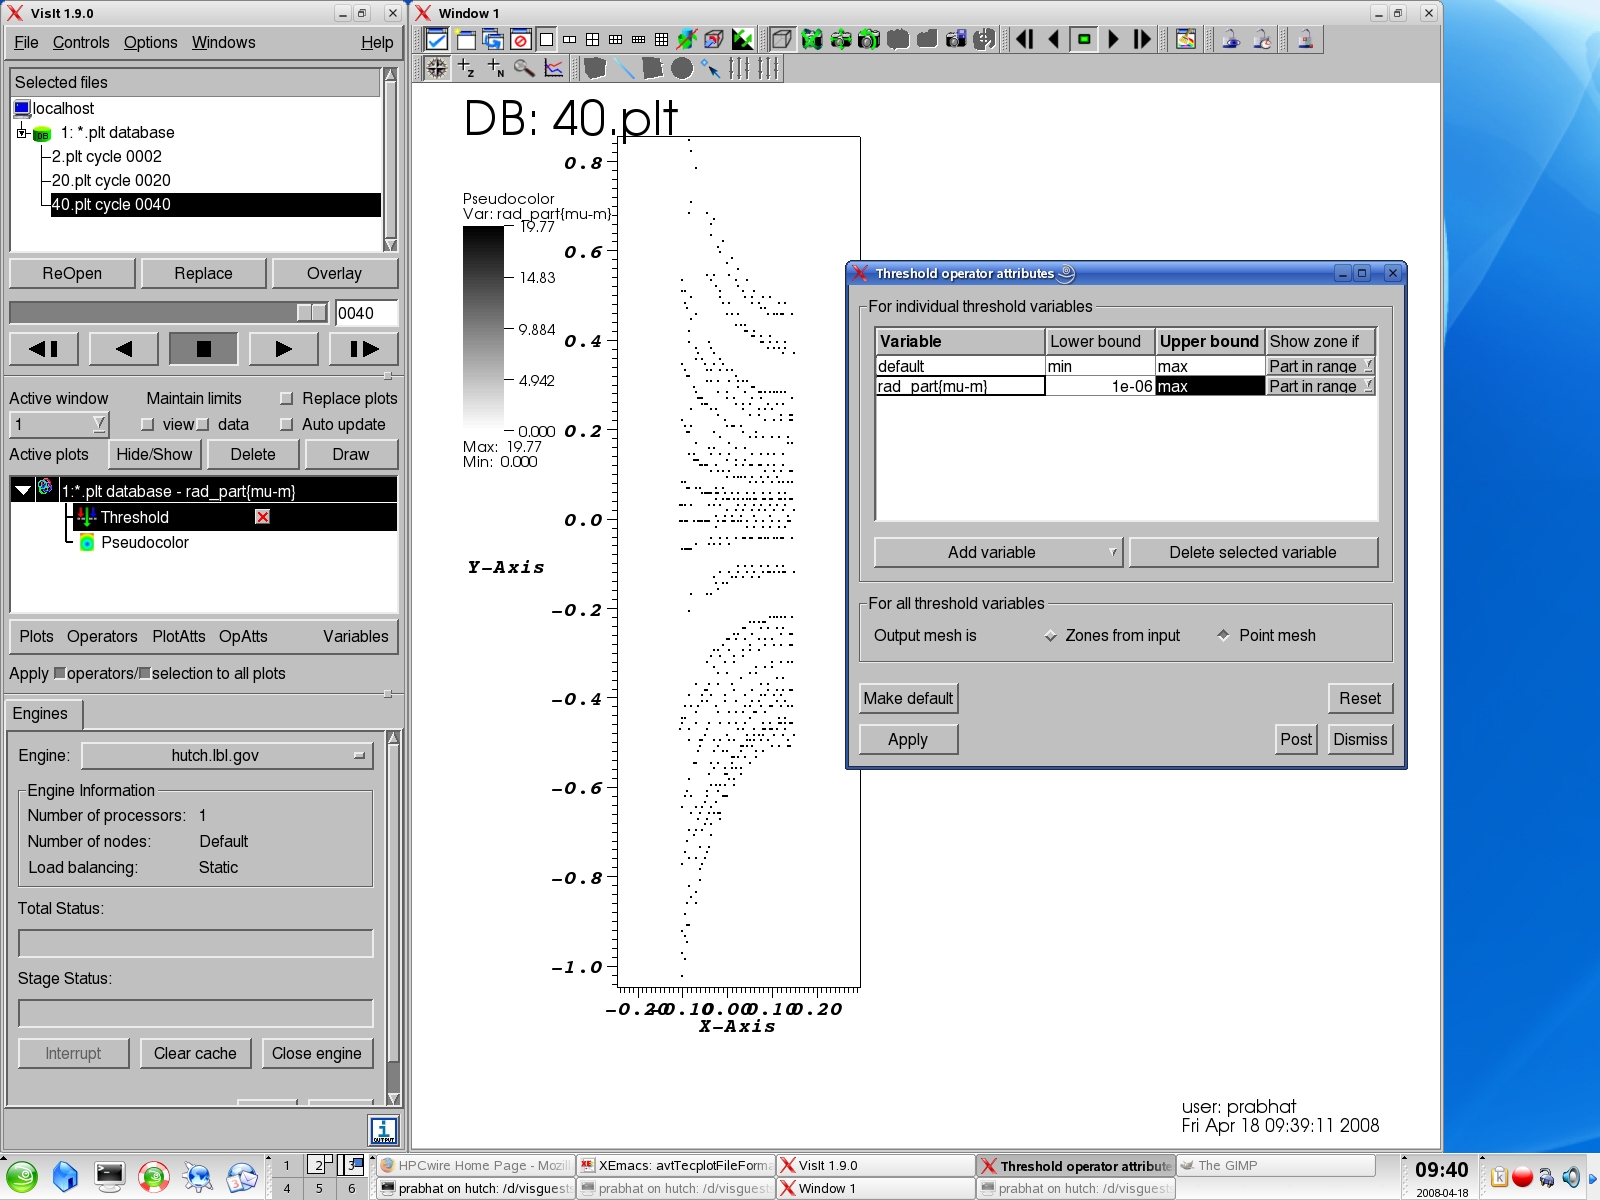
the threshold operator with the option of output'ing to particle mesh.
Use "rad_part" and apply a minimum threshold of 1e-6. Be sure to select
"Output Mesh" as "Point Mesh".
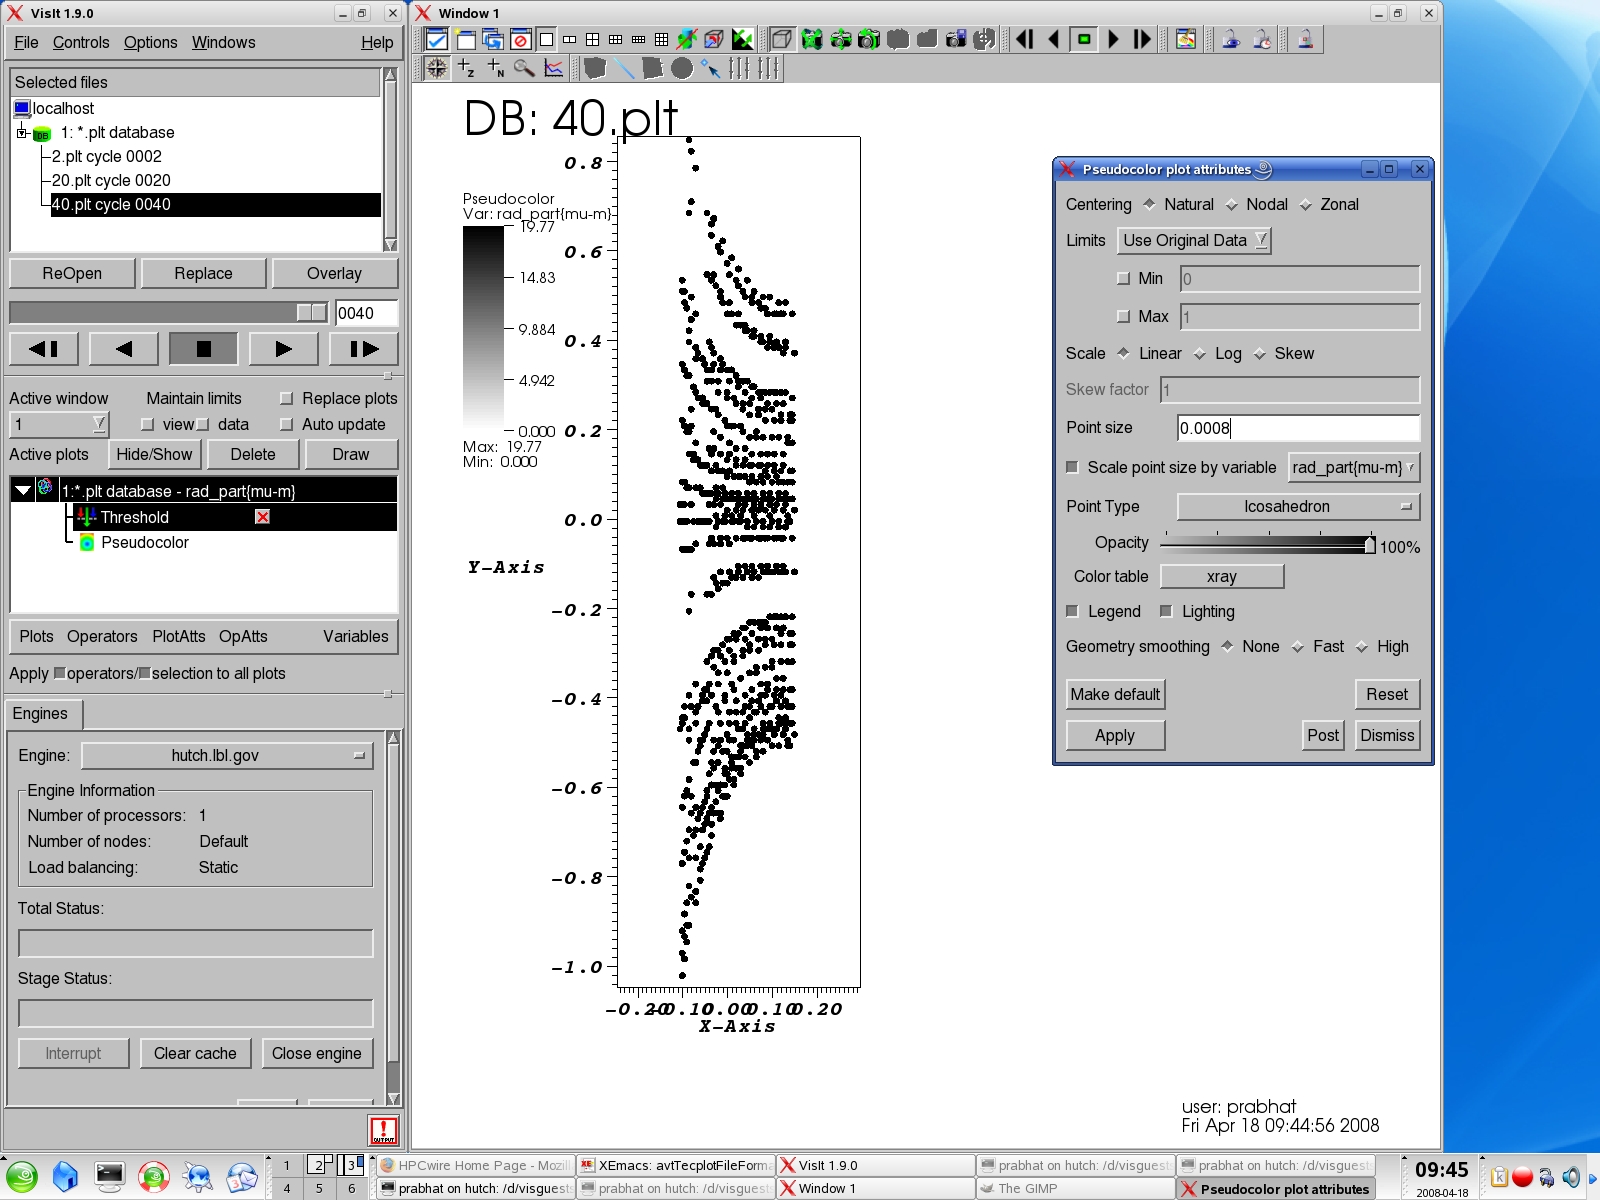
You can now create a Pseudocolor plots for particles. You can associate a size for rendering particles. Goto Pseudocolor plot properties and select "Point Type" as Icosahedron. Choose Scale point size by Variable, select "rad_part". You will need to play with the point size factor to get a reasonable size on the screen.
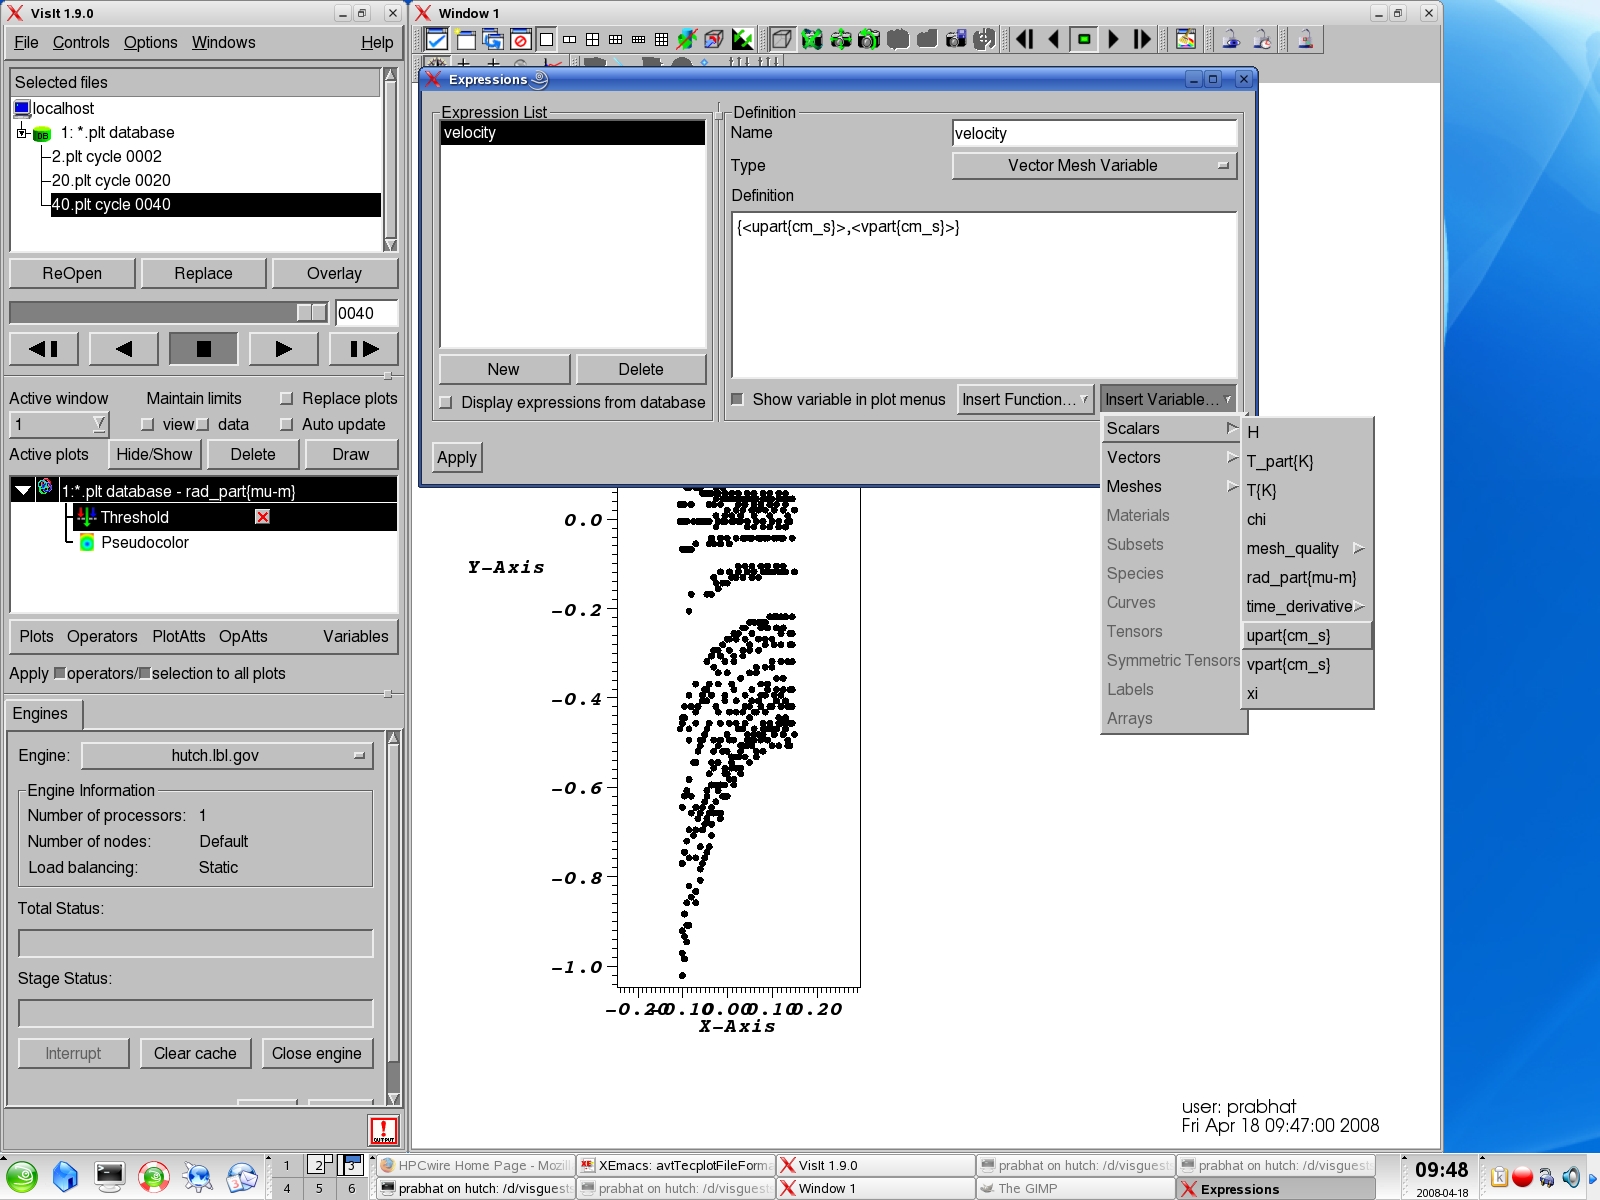
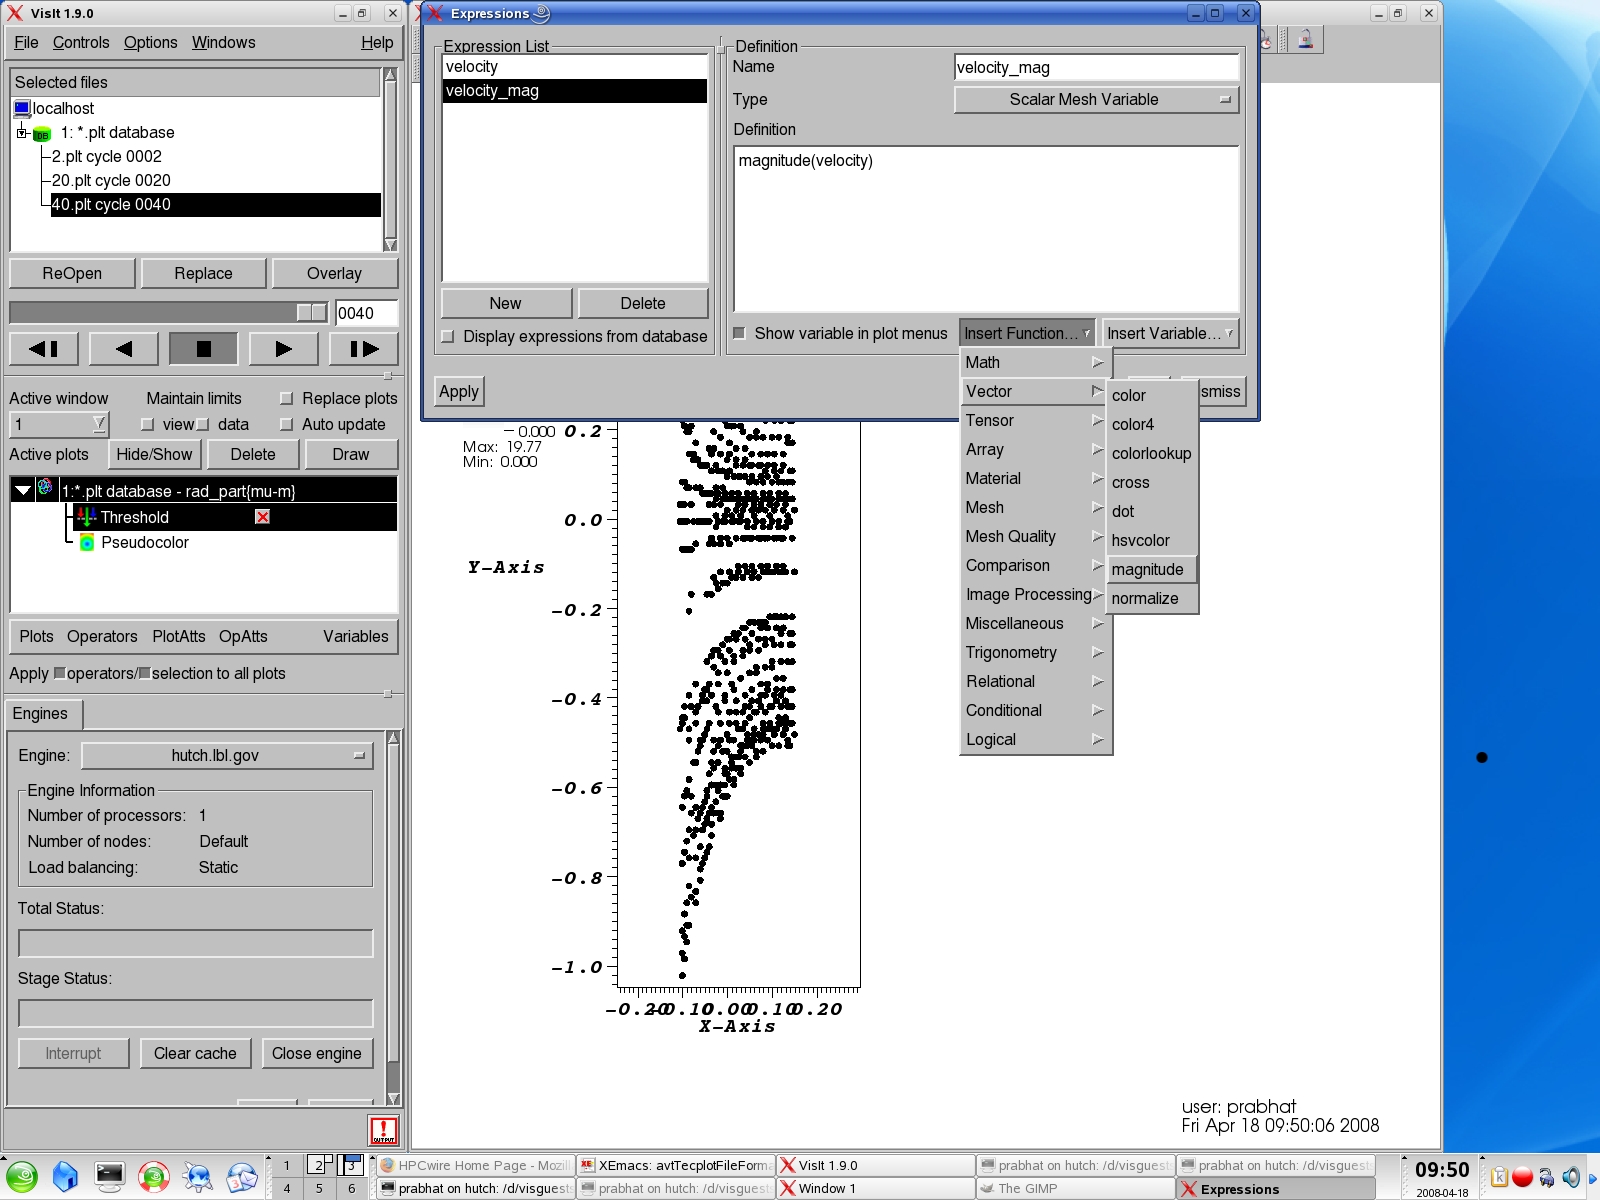
VisIt expressions are a powerful means to create derived fields from existing variables. Launch the expression editor by clicking on
Controls->Expressions. We will create 2 expressions: one for a velocity vector and another for the magnitude of the velocity.
Create a New expression and select "Vector Mesh Variable" type. In order to create a vector, you need to form an expression of the type
"{var1, var2}". Type the curly braces and the separating comma. In order to insert the actual variable names, choose
Insert Variable->Scalar Variable->upart and similarly for vpart. Hit apply. That will create a new vector variable which we will try plotting next.
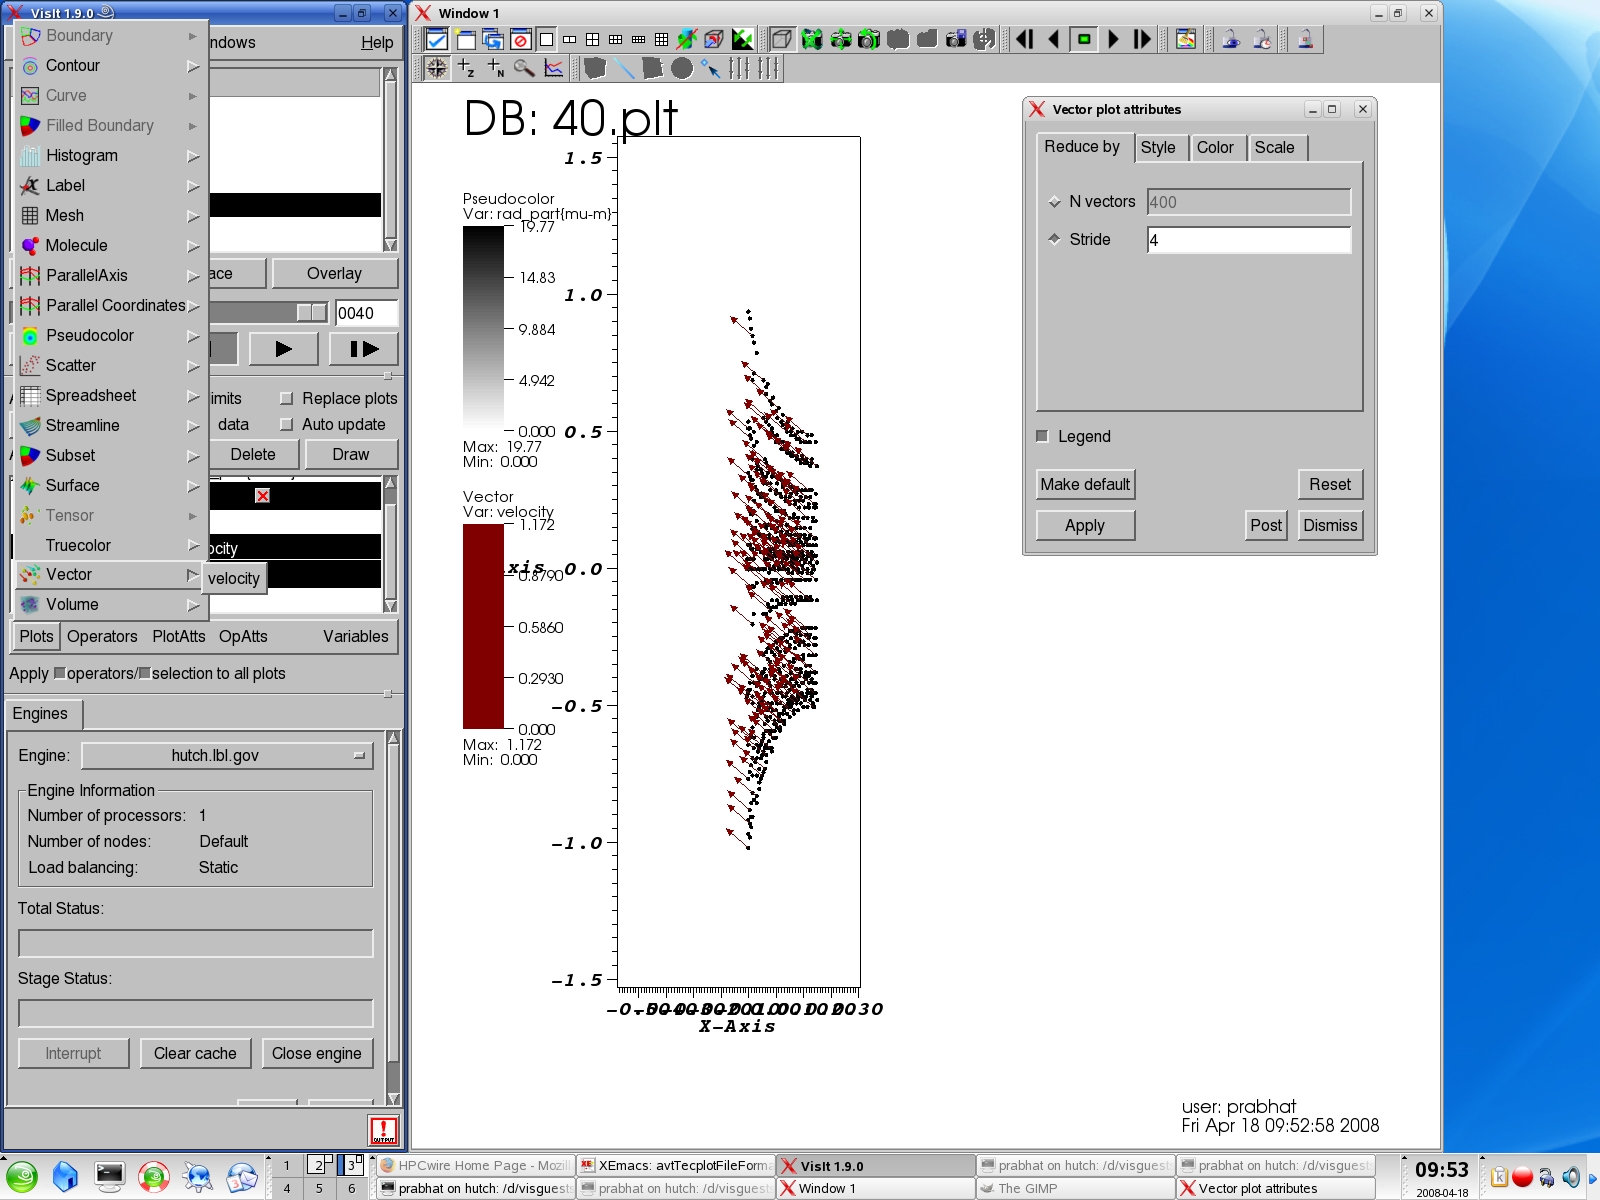
In order to represent vectors by lines/arrows, goto Plots->Vector. You will see the velocity field which we'd just created. Create the plot. Double click on plot properties to bring up a menu of options for the vector plot. You can choose a standard color for the arrows and scale them down. Note that displaying all the arrows might create a lot of clutter, you can reduce this by choosing a stride value (e.g. 4) which will draw every fourth vector.
We will now create another expression for magnitude, derived from the velocity field. Bring up the expression editor, create a new expression of the type Scalar Mesh Variable [since magnitude is a scalar]. Goto Insert Function->Vector->magnitude. That will being up the "magnitude()" expression in the editor. Click between the brackets, choose Insert Variable->Vectors->velocity. Hit apply. The magnitude field is now ready for plotting!
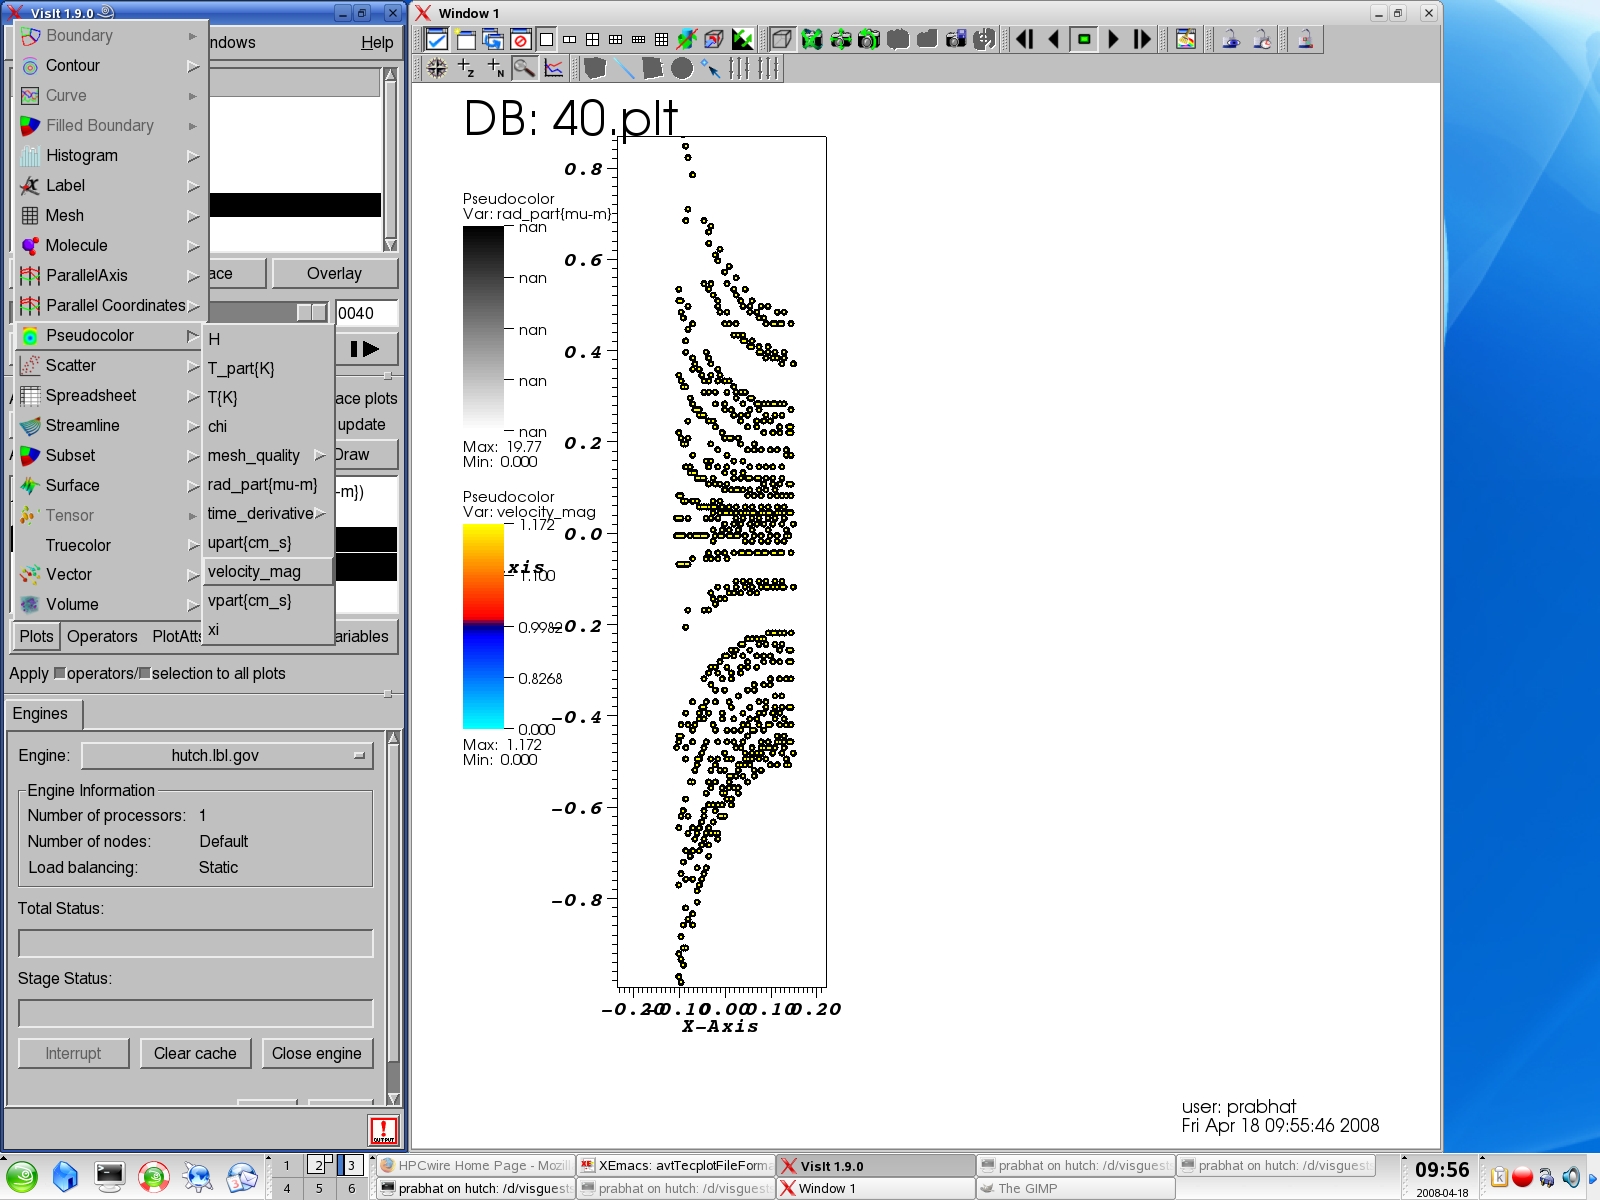
Create a Pseudocolor plot of velocity_mag. As usual, you can change the pseudocolor plot properties by double-clicking the plot.