VisIt at NERSC
Table of Contents
Description
VisIt is a point-and-click 3D scientific visualization application that
supports most of the common visualization techniques (e.g.,
isocontouring and volume rendering) on structured and unstructured grids.
Due to its distributed and parallel architecture, VisIt is able to handle
very large datasets interactively. In addition, VisIt is extensible,
allowing users to add data loaders or additional analysis tools to VisIt.
The NERSC Analytics Team has developed extensions to VisIt in support of
NERSC user applications, and coordinates with the VisIt development team
to make these extensions part of the main VisIt development code branch.
Features
-
VisIt provides support for a wide range of computational meshes,
including two- and three-dimensional rectilinear, curvilinear, and
unstructured meshes.
-
VisIt's visualization capabilities are grouped primarily into two categories:
-- Plots are used to visualize data and include boundary, contour, curve, mesh, pseudocolor, streamline, surface, vector, and volume.
-- Operators consist of operations that may be performed on the data prior to
visualization. Some examples include slice, index select, iso-surface, onion
peel, reflect, threshold, and part selection.
-
VisIt employs a distributed and parallel architecture in order to handle extremely large data sets interactively. VisIt's rendering and data processing capabilities are split into viewer and engine components that may be distributed across multiple machines:
-- Viewer: Responsible for rendering and typically is run on a local desktop or visualization server so that it can leverage the extremely powerful graphics cards that have been developed in the last few years.
-- Engine: Responsible for the bulk of the data processing and input/output (I/O) and typically is run on a remote machine where the data are located. This eliminates the need to move the data and makes high-end compute and I/O resources available to the engine. The engine can be run serially on a single processor or in parallel on thousands of processors.
-
VisIt achieves extensibility through the use of dynamically loaded plugins. All of VisIt's plots, operators, and database readers are implemented as plugins and are loaded at run-time from the plugin directory. New plugins can be added by installing them in the plugin directory. VisIt comes with a graphical plugin creation tool that greatly simplifies the process of creating new plugins. The user describes the properties of the plugin, and then the tool generates most of the code necessary to implement the plugin. For example, in the case of an operator, the plugin creation tool creates the code necessary for the graphical user interface attribute window; the C++, Python, and Java interfaces; and the code necessary to interface to VisIt. The only code you need to write is the C++ code that actually performs the operation.
- VisIt also has the ability to animate data, allowing users to see
the time evolution of their data.
Accessing VisIt
Use the
modules
facility as follows to load VisIt, and then launch the application by typing
visit at the command line:
    % module load visit
    % visit
To use a version of VisIt other than the default, include the version
number on the module load line, e.g., to use version 1.5.5:
    % module load visit/1.5.5
    % visit
To check which versions of VisIt are available:
% module avail visit
IMPORTANT NOTES
- Sometimes when the VisIt GUI starts, the opening of VisIt windows
stalls. If this is the case use:
%visit -nowindowmetrics
- You can install and run VisIt on your local machine and use a remote
VisIt compute engine on the NERSC analytics machine.
For information on how to set up VisIt's host profiles to do this and how
to run a remote VisIt compute engine, please read Gunther Weber's
Running a Remote VisIt Compute Engine on DaVinci.
Documentation
Manuals
Additional Resources
VisIt Web site
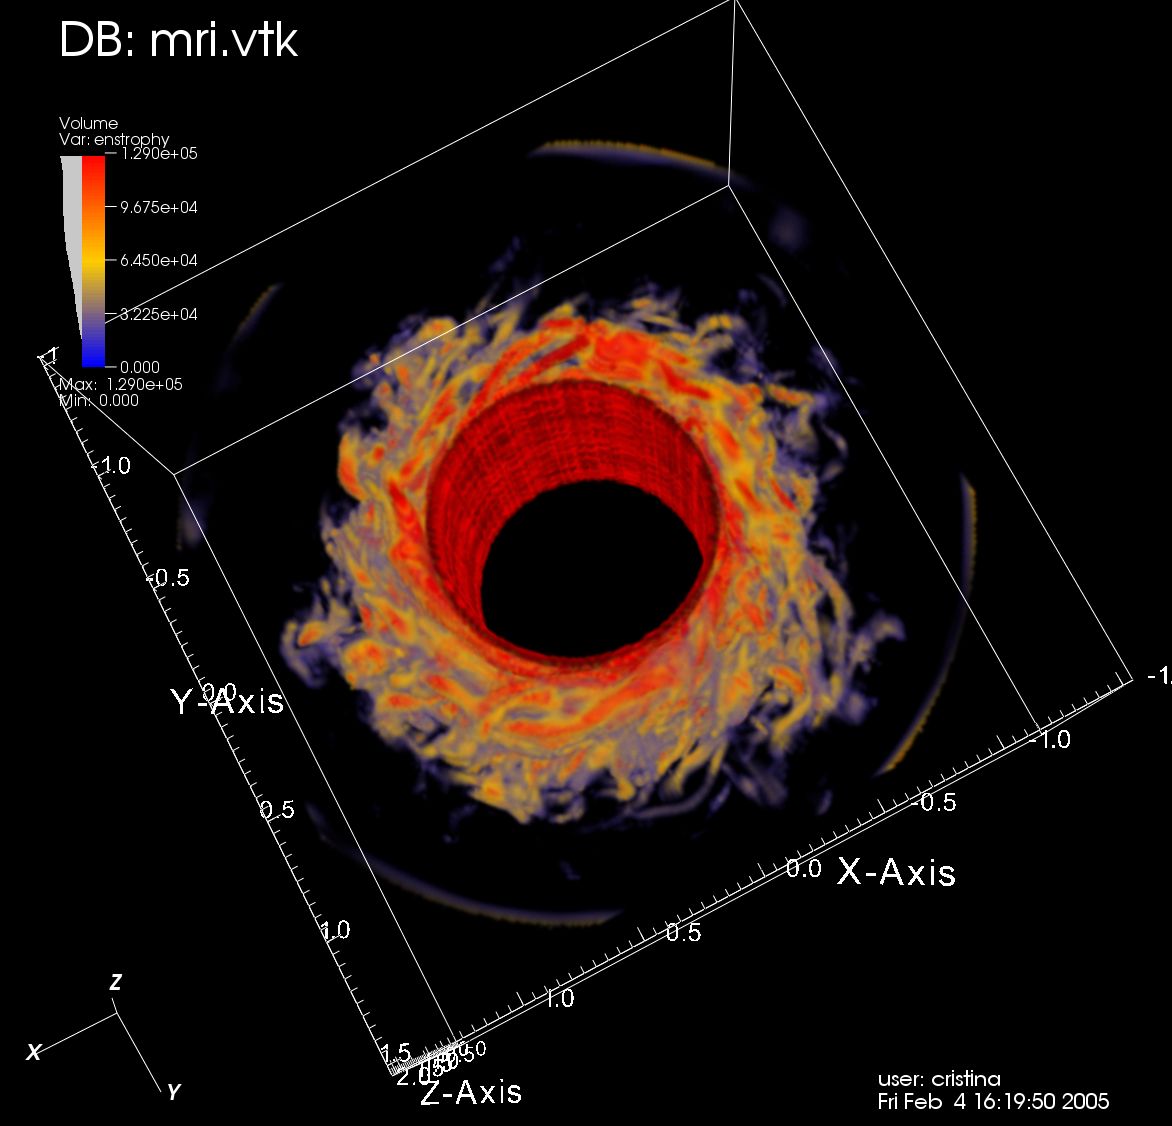
Sample Screen Shot
Examples of visualizations for which VisIt has been used are available on
the NERSC Analytics Visualization page under
Case Studies, or on the Visualization Group
Vignettes page (
2006 and
2007).
|
Volume rendering using VisIt
(click to enlarge)
|