One problem faced by many research efforts is the need to integrate data from many different sources into a single unified display. This page describes our efforts to address this need within the context of visualization of a site model.
The species of data which we need to visualize for this project include:
- Topographic data (structured and unstructured)
- Engineering data including roads and buildings.
- Hand-drawn information (location in plan view of latite dikes)
- Simulation data computing copper concentration
- Field data, including assay samples taken from wells, well head location
Data Conversion
The source format for the engineering and unstructured topography (topo contour lines) was given to us in DXF format. None of the existing visualization tools we use has a DXF reader (note: there is a DXF reader module for AVS available from the International AVS Center at www.iavsc.org, but it did not work on our data).
Using lex and yacc, we wrote a simple DXF file parser which was capable of extracting vector and polyline information from the source data file. When all of the raw data was visualized, this was the result (click on the image for a higher-res version):
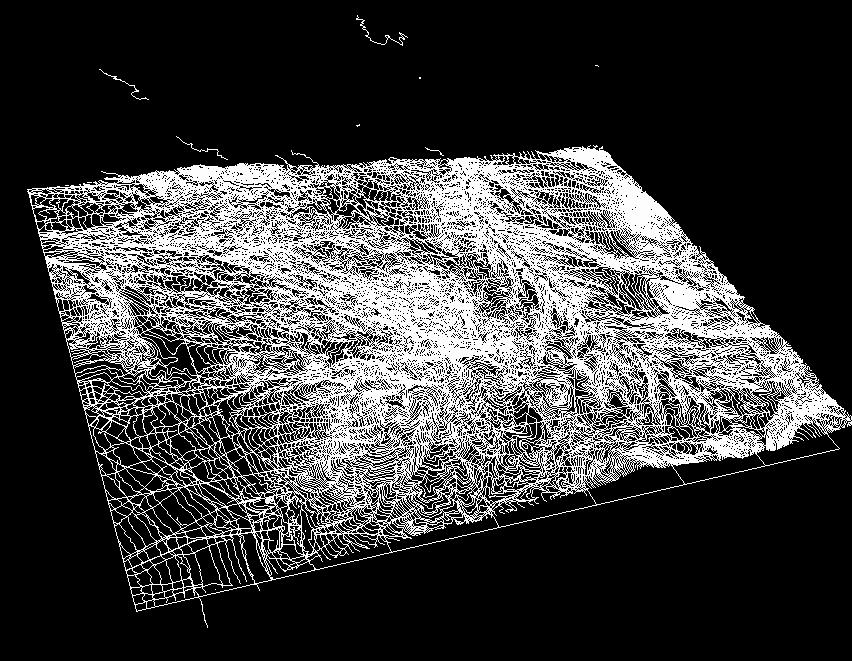 |
This file contains lines of topography, building footprints, lines of drainage, and a user-supplied grid. These entities had to be extracted by hand from the converted file. This is the result:
 |
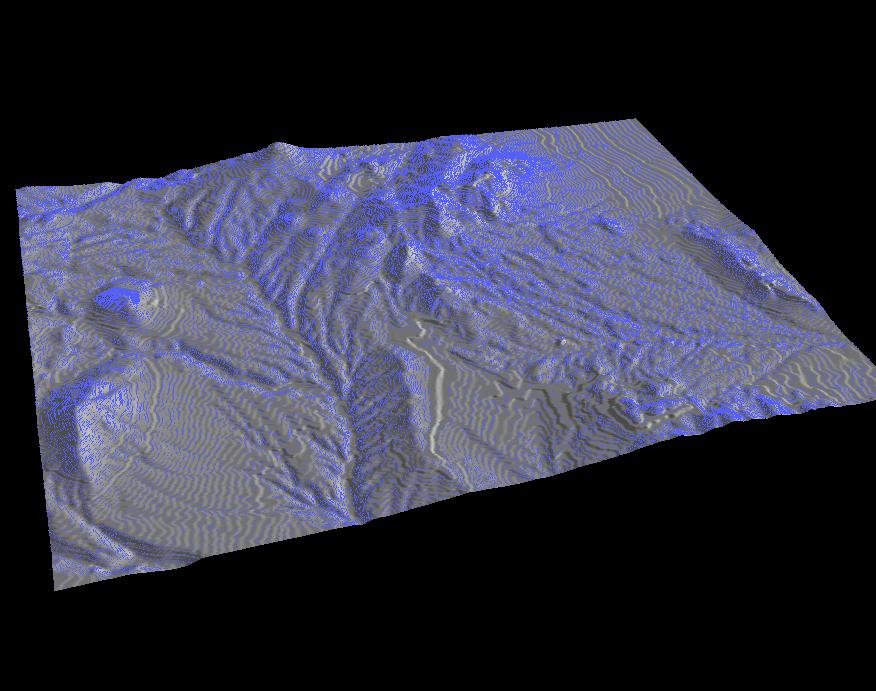
Surface Fitting
With the 200K topographic sample points, we needed to compute a surface which fit through the data for use in visualization. Existing tools failed for the following reasons:- Triangluation methods
- Techniques based upon Delauney triangulation fail when duplicate points are encounterd.
- Kriging
- The technique of computing a weighted average of points that lie within a user-defined search radius requires the selection of a "good" search radius size. When "too large" of a radius is used, the data is "too smoothed." When "too small" of a search radius is used, it is often the case that there will be grid points at which no input data falls within the search radius.
- Techniques based upon Delauney triangulation fail when duplicate points are encounterd.
To rectify this situation, we modified an existing kriging tool to use a dynamic search radius. This code operates by starting with the user specified search radius, which can be assigned a conservative value (on the small side). At a given output grid point, if no input data falls within the search radius, the search radius is doubled and the process repeats until either some input data falls within the dynamic search radius, or until a finite number of search steps are performed.
It turns out that this method works well with topographic contour data. The images below show the results of surface fitting using this technique.
 |
 |
| 256x256 Quadmesh surface | 512x512 Quadmesh surface |