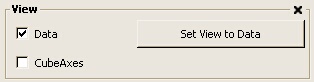
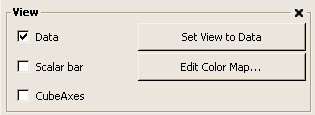
The top region on the Display tab of the property sheet associated with an item in ParaView contains the View settings. The appearance of this regions depends on the setting of the Color By option in the Color area. Two possible configurations are given below. The top one is the state of this area when the data is color by property, and the bottom shows the configuration when the data is colored by some scalar or vector component of the data.
This region of the interface allows you to toggle the visibility of the data and other items associated with the data, to reset the camera to view this data object, and the edit the color map associated with the mapper and scalar bar. Each of these settings and operations is described in more detail below.
Data: This check box can be used to toggle the visibility of the data. This visibility can also be controlled using the eye icon in the Selection Window.
Scalar bar: If the Color by option in the color area is set to use a scalar or vector component for color, then the Scalar bar option will be displayed in the View area allowing you to toggle the visibility of the scalar bar. The scalar bar provides a graphical representation of the color map used to color the image, along with tic marks indicating the range of values mapped through the table. The scalar bar is an interaction widget - using the left mouse button you can reposition and resize the scalar bar in the Display Area. Bringing the scalar bar close to the bottom or top edge of the Display Area will cause it to switch to a horizontal mode while bringing it near the right or left edge will cause it to switch to a vertical mode. Additional controls for the title and labels of the scalar bar are provided on the property sheet displayed when Edit Color Map is selected, and these are described below.
CubeAxes: Toggle the visibility of the labeled axis displayed along three outer edges of the bounding box of the data object.
Set View to Data: This button will reset the camera so that this data object mostly fills the Display Area. The current camera direction will be maintained, but the camera will be translated and the zoom will be adjusted.
Edit Color Map...: If the Color by option in the color area is set to use a scalar or vector component for color, then this button will appear in the View region of the interface. Pressing this button will change the property sheet to look similar to the image shown below.
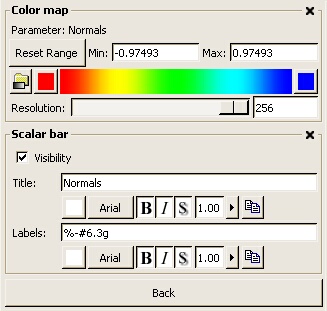
The top region of this property sheet allows you to adjust the color map used to map scalar values to color. The indicated range is the initial range computed for this data object. If you have adjusted parameters that have changed the scalar range you will either need to press Reset Range to reset to the full scalar range, or to enter a sub range manually. There are several preset color maps, or you can specify the color of the two end points of the color map. An HSV interpolation method will be used between these end points. The resolution of the color map can be set to any value between 2 and 256. This number indicates how many colors are in the map.
The bottom region of this property sheet
contains controls for customizing the scalar bar. You can toggle the visibility,
change the title and adjust the formatting for the tic labels. In addition,
you can set the color, font family, attributes such as bold, italic, and
shadow, and the opacity of each text item. For convenience, the last button
in the row will copy the properties from the other item. For example,
if you customize the Title text then want to copy the specification of
this text to the labels, you will press the  button at
the end of the text customization buttons in the Labels area.
button at
the end of the text customization buttons in the Labels area.
Pressing the Back button will return you to the Display tab of the data object's property sheet.