Immersive Information Visualization
Steve Smith (sas@lanl.gov, sas@lbl.gov)Los Alamos National Laboratory
Lawrence Berkeley National Laboratory
University of New Mexico

Introduction
Computers have been used to mediate the generation of sound and images for nearly half a century now. The field of Computer Graphics came into it's own during the late seventies through the eighties with huge advances in technology and widespread application in many fields from computer interfaces, to entertainment to scientific and engineering design and analysis, to cartography. In the late eighties, there emerged the new term,Visualization which was primarily used to depict physical quantities and processes in what is known as Scientific Visualization . By the mid nineties, the term Information Visualization had been coined to cover these tools and techniques for more abstract, informational objects and domains. The application of computer generated visuals and sound from a first-person perspective probably first occurred in flight simulators. The term Virtual Reality emerged in the late eighties, replacing an earlier term from artificial intelligence, Artificial Reality. Virtual Reality implied an immersive perceptual environment that the user was embedded in through the use of advanced computer mediated graphics and sound and possibly haptic, olfactory and other perceptual stimulae.Immersion
An important precept of our work is that the task of understanding abstract information demands even more of the human than scientific visualization and that one key to increasing our ability to handle the quantity, complexity and subtlety is to use varying techniques to create a sense of presence or Immersion. Firstly, the use of multiple senses , the use of large field-of-view visual presentations (Powerwalls, CAVEs, Head Mounted Displays, etc), real-time rendering and animation speed, 3D perspective, complex lighting models, texturing, etc. naturally affords us a much larger encoding space. Secondly, the use of higher-level metaphorical devices than simple geometry (colored points, regions, even polygons and symbols) offers a wider range of subtlety. And thirdly, the sense of presence seems to enhance the coupling of higher level perceptual functions and lower level cognitive functions. It is not hard to believe that humans, and in fact primates, mammals, vertebrates and even the lowest order of creatures with sense organs are evolved to use the huge range of cues provided by the real world, integrating multiple sensory streams and creating higher orders of information, knowledge and perhaps even wisdom through the application of complex, layered models of the world around them.Flatland
For most of our 3D immersive visualization work, we use the Flatland development environment from the University of New Mexico High Performance Visualization center and the Homonculous project run by Dr. Thomas P. Caudell of the Electrical and Computer Engineering department.On top of this development environment we have added another layer of our own known as Flux (not a true acronym) which is a data flow environment to support the development and coordination of many independent information visualization components in a single application.
Examples
The following are a few very early examples of our attempts to apply these principles to several complex and subtle but relatively abstract problems. They reflect the work of many people ranging from those who provided the problem data (or simulation) to those providing the underlying technology and those who participated in developing the actual metaphors, encodings and representations.
Motivation
We believe that the human perceptual and cognitive systems are currently extremely underutilized by visualization systems. The human sensory organs and nervous system were evolved over a huge period of time under a wide variety of survival pressures, living in a fully dynamic, 3 dimensional world. Not only do we see in stereo, but our hearing is simultaneously capable of omnidirectional listening and highly directional discrimination. We are able to intuitively predict a wide variety of phenomena in the real world, ranging from simple geometric tasks (e.g. recognizing lines, areas, volumes) to more physics based tasks (e.g. predicting ballistic trajectories) to complex social tasks (e.g. recognizing, even manipulating pack, herd, or mob behavior in prey or in fellow humans). Our cognitive systems also have a very strong abstract symbolic component, developed originally perhaps for language, but adapted for the symbolic, abstract thinking characterized by mathematics.We believe that the limited application of immersive environments to information visualization reflects a number of things, but perhaps most importantly, the lack of experience. Over approximately 25 years as a computer graphics practitioner, I have watched new tools, techniques and even paradigms arrive and be ignored and dismissed by many while the groundwork is laid and experience is gained by those willing to experiment and to make mistakes. It should also be noted that we are on the cusp of widespread availability of inexpensive but high quality equipment for limited immersion. The entertainment industry in particular is driving his technology hard and 3D gaming, animation and interactive storytelling will continue to drive the technology and the acceptance of these modes of interaction with computers. The limited window provided here through text, low resolution, still images without sound does not begin to suggest the experience that goes with using these tools in a full or semi-immersive environment.
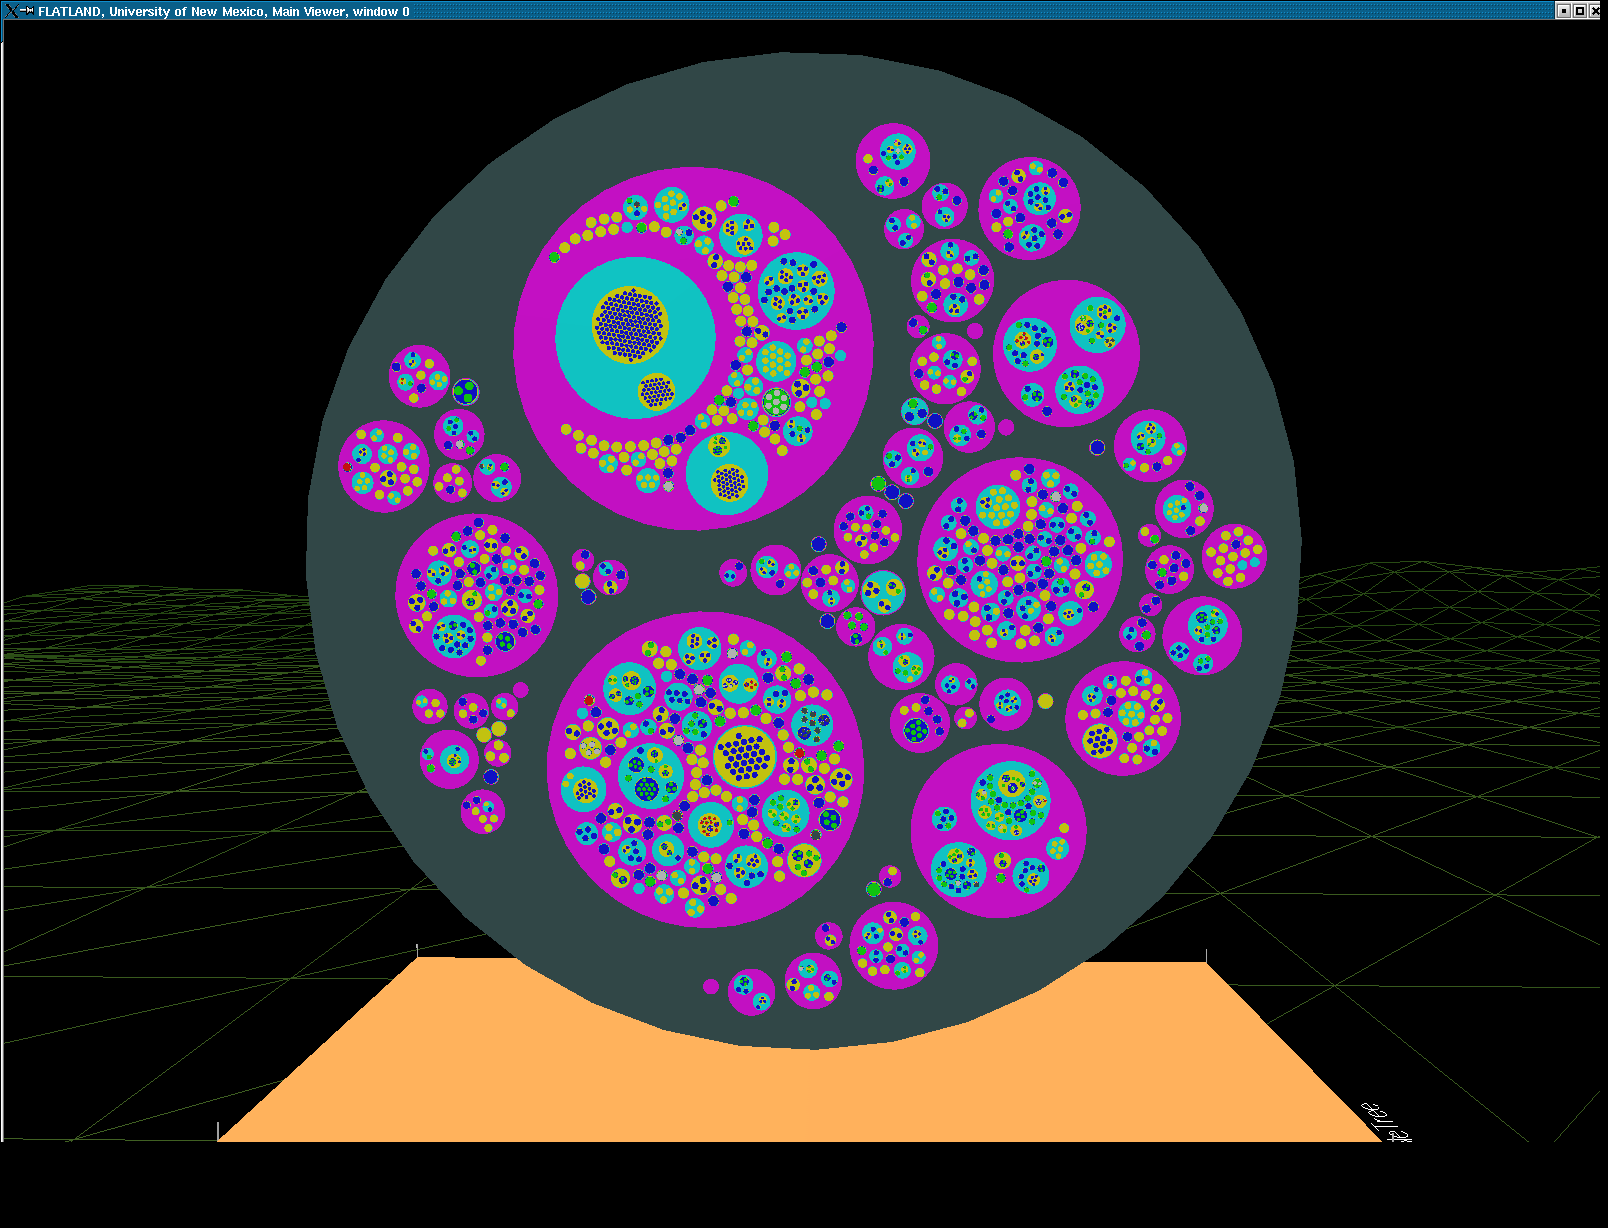
FROTH (Force-directed Representation Of Tree Hierarchies)
The FROTH algorithm uses forces derived from the Lennard-Jones potential, a stylized force often used to model the forces between atoms and molecules and tends toward an organization of hexagonal closest packing. Since we are laying out trees, we are able to do a recursive, divide-and-conquer layout in order N to the power of ((M+1)/M) where N is the total number of nodes and M is the average number of branches at each level in the tree. The Lennard-Jones potential essentially balances two high powers(6 and 12) of 1/r in a single force. Inspired by atomic physics simulations, this has lead us to consider a wider range of forces similar to this where a single force has an equilibrium point. The particular rendering seen here on the right, we refer to as "the bubble tree" with a variant above laid out on a hemisphere. The actual behavior of these bubble trees, as they lay out dynamically is very reminiscent of cell fissioning. A new node is placed randomly into the point in the tree where it belongs and then through recursive application of a force derived from the lennard-jones potential, all of the nodes in the tree adjust to each other until equilibrium is reached again.


H Fat Tree
The following visualization is of 6144 (6K) Quadrics interconnect switches arranged in a Quad Fat tree, connecting 1024 4-processor machines. These 4096 (4K) processors comprise 1/3 of the 12K processor Q machine developed for the ASCI project at Los Alamos National Laboratory. The challenge in this project was to compactly layout the 6K switches in a way that allowed us to unambiguously see the communications between processors and switches while maintaining a sense of the implied latency of messages through switches. The inspiration for this layout are the H-arranged waveguides for phased array radar where the distance from every antenna in the array to the receiver point is identical. This layout was generated by a recursive function, yielding a fractal dimension of 2 (therefore not technically fractal). The message traffic shown here comes from the Alacarte simulator, which exploits the deterministic rules in the Quadrics switches to anticipate the route a given message must take given the total state of the switch fabric and a source, destination pair.
CIP/DSS graph layout
The Critical Infrastructure Protection/Decision Support System
(CIP/DSS) project is part of the DHS portfolio of projects doing
R&D in infrastructure protection for Homeland Security.
This
project involves work from several national laboratories, with Los
Alamos, Sandia and Argonne national laboratories providing most of the
modeling effort. 
There are 14 major infrastructures modeled, such as Energy, Finance, Environment, Transportation, Communications, Water, etc. These Infrastructures are then broken down further into subsectors such as (within energy) Electrical Power, Natural Gas Distribution, etc.
On the right, you will see each of the 32 subsectors laid out in parallel layers, ordered arbitrarily by the names they are given. In the source representation, each "subsector" is built independently of the others with the interdependencies between their variables being external references. The layout within each subsector was defined explicitly by the developer of each model.

The layout on the left shows the same 32 subsectors, comprised of about 5000 coupled ordinary differential equations, laid out in a circular array to help deconflict the intradependencies from the interdependencies.
A commercial modeling tool, Vensims, is used to develop, run and analyze this huge, complex model. This particular model is designed to represent an urban scale set of infrastructures but there area similar models being built to describe regional and national scale infrastructures which in turn may also be coupled.
As you can see, the complexity, scale and subtlety of this problem is quite significant. We plan to not only help with understanding the topology of these networks but also the dynamics of their execution.

The visualization shown here involves the application of force-directed layout algorithms similar to the FROTH project described elsewhere. For general graph-layout in 2 and 3 D we use a modified spring model.
As you may be able to see in this limited snapshot, the elements with the least interdependencies move to the outside edge of the graph while those with the most interdependencies move to the inside.
We currently treat all nodes and edges identically, but intend to distinguish how we map spring constants and coulomb forces to the nodes and edges to help group and separate subsectors and infrastructures more clearly.
NID (Network Intrusion Detection)
Here we model the internet and our open internal network using what we call the "Space Defense" metaphor. The internal protected space is the small circular (annular) region in the center, the inner transparent hemisphere is our firewall or gateway router and the region between the two external hemispheres is where the internet at-large resides.This work is being done for the Los Alamos National Laboratory security team, funded by NNSA.
")
Flows (such as TCP connections) are indicated by rays between the source and the destination host. The color of the ray represents the destination port or loosely the service being requested or provided. The duration of the ray's existence and some features of it's animation encode the duration of the flow's existence.


The height and coloration of the surface representing the internal protected space encodes (logarithmically) the number of simultaneous connections to the host at that location.
The internal space encodes the last two octets of the IP address as R and Theta. Each subnet is therefore a "ring" in the annulus with 256 positions around the circumference.

The external space similarly encodes the first 3 octets of the IP address as Phi (elevation), Theta (azimuth) and R (position between hemispherical shells). Each subnet in the internet at large, therefore is represented by a unique location in the hemispherical shell.
In the foreground you see the H Fat tree representation of a supercomputer switching fabric and messaging flux. This shows how multiple visualization applications can be run in the same virtual environment.