This is an archival copy of the Visualization Group's web page 1998 to 2017. For current information, please vist our group's new web page.
Material Science NMR Project
Project Overview
Material Scientists use Nuclear Magnetic Resonance (NMR) technology for many purposes, including chemical structure determination. To better understand the results of NMR experiments, UCB/LBNL researchers are using NERSC's Cray T3E supercomputer to simulate the response of crystalline structures to an applied magnetic field.
The LBNL Visualization Group is working with Bernd Pfrommer to visualize the results of computations on several different crystals, including silicon, alanine-alanyl, glycine, and potentially others. alanine-alanyl and glycine are basically amino acids, the building blocks that are used by the body to create proteins.
Pfrommer had previously done some visualization using IBM's Data Explorer software, but found that several important features were missing, such as stereoscopic rendering, replicating of periodic data, and multiple arbitrary clipping planes. Due to the Visualization Group's expertise with various visualization techniques and software, we were able to help him acheive his visualization goals quickly while he was simultaneously improving or fixing his code.
Technical Details
The data that is visualized includes atomic positions, a "tensor trace" field, and a vector field of the induced current. The tensor trace is a scalar quantity that partially describes the relationship between the applied magnetic field and the induced current.
A basic feature of all of the molecules, because they are all in crystaline form, is that they are periodic. Therefore, in order to achieve maximum computational efficiency, the smallest possible repeatable cell (known as the unit cell) is used in the computation, and is then replicated during visualization in order to see the full crystal structure. Another aspect of this is that the unit cell is not necessarily rectangular. That is, the edges of the cell are not always at right angles to each other. In our terminology, the data is represented in an "oblique coordinate system".
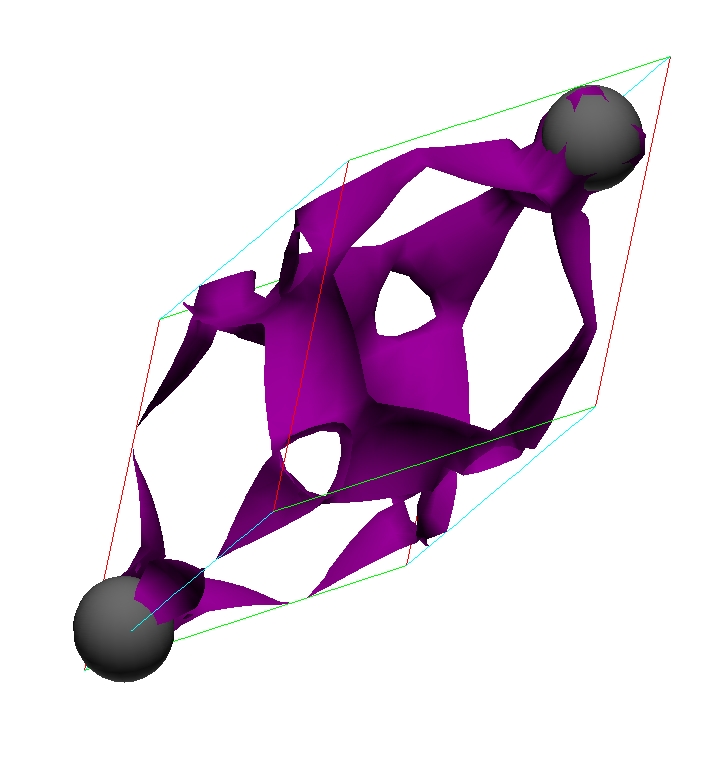 |
Figure 1: Unit cell of a Silicon crystal
Figure 1 shows the first visualization done on this data by the vis group. This shows the unit cell of the Silicon crystal, displaying the atoms in grey and an isosurface of the tensor trace data in purple. The oblique coordinate system can be clearly seen.
Given the atomic positions and the known lengths of interatomic bonds, we calculate the locations of these bonds and display them with the atoms to generate the "ball and stick" model. The ball and stick model is essential to understanding the scalar and vector data because the latter two quantities are spatially related to the molecular structure. See Figure 2.
When the scalar and vector data is replicated it is very difficult to visualize if it is all viewed at once. In Figure 2 this problem is addressed by taking an arbitrary planar slice through the data. Values in this data slice were then represented with semi-transparent colors so that features above and below the slice could be seen. Both scalar and vector data was sliced in this way.
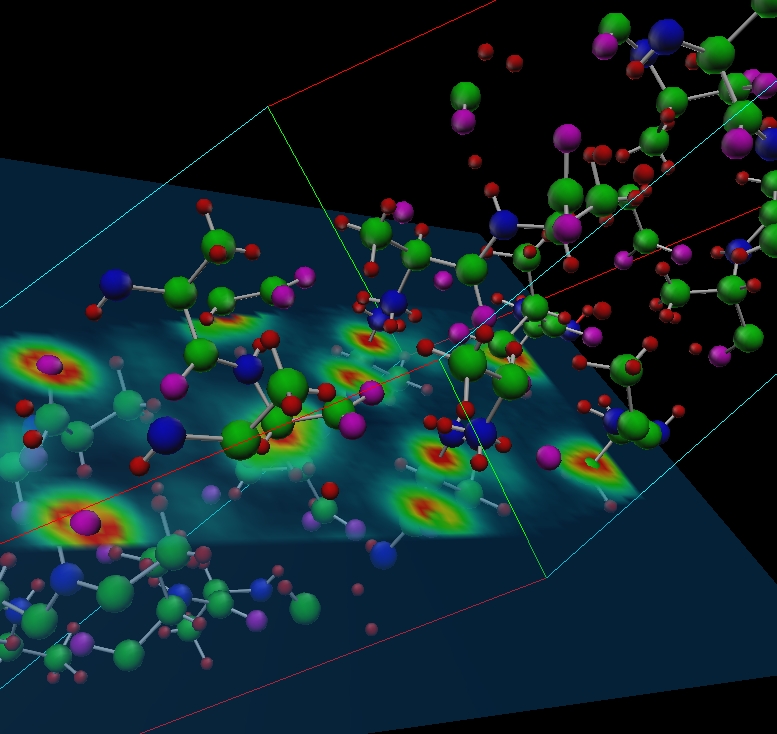 |
Figure 2: Alanine-alanyl crystal with a slice of tensor trace data. The unit cell has been replicated four times.
It was expected that the induced current would occur in circular eddies near the atoms about an axis parallel to the direction of the applied magnetic field. Taking a slice through the vector data on a plane perpendicular to the applied field shows that this is indeed the case. To visualize this, we use a simple visualization technique called "hedgehog" to generate a 3D arrow for each vector in the intersection of the dataset and the plane. The very large vectors are the result of numerical instabilities in the computation near the centers of atoms.
To further aid understanding, an isosurface of the tensor trace data is used to give a sense of the 3D structure of that data.
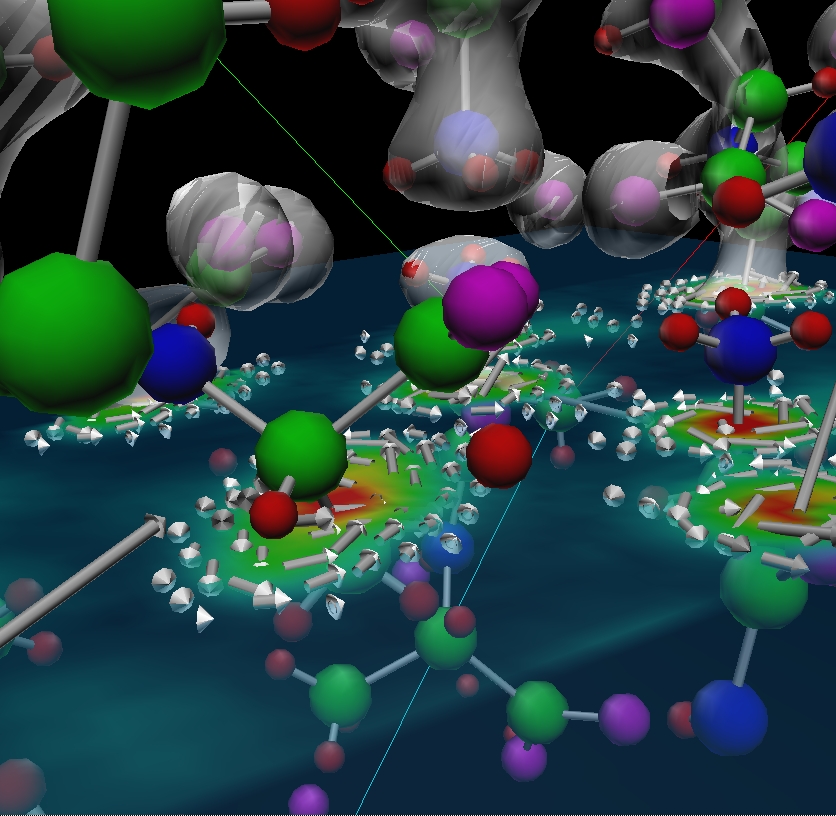 |
Figure 3: Final image of alanine-alanyl that was used in a demonstration for Assistant Energy Secretary Martha Krebs.
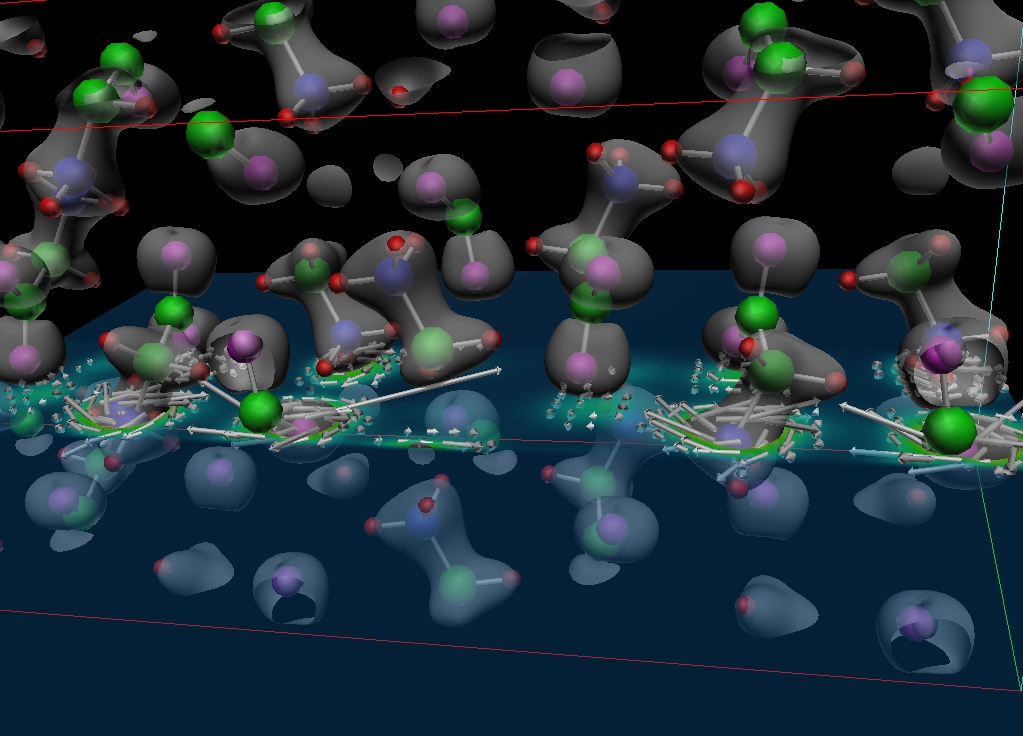 |
Figure 4: Similar visualization of a glycine crystal that is currently being used to study the properties of glycine. Click on image for larger version that shows the periodicity of the structure.
Stereoscopic display has been extremely valuable in this project. The complex three dimensional structure of the crystals can be very confusing when displayed on a 2D monitor, but becomes quite obvious when viewed in stereo. As in our other work, researchers are pleased that they do not have to spend time deciphering the image, but can take it for granted and study their data as though it were a real object.
Future Work
When the unit cell is replicated the resulting crystal sometimes needs to be chopped or clipped so that some other structure can be seen (e.g. hexagonal symmetry). To do this it is necessary to clip both the data and, in some cases, the resulting geometry. We have implemented routines which do some of this. Currently the ball and stick model can be clipped by an abritrary set of planes. We will be extending this to more general data and geometry. This has also suggested several useful extensions of existing visualization routines.