This is an archival copy of the Visualization Group's web page 1998 to 2017. For current information, please vist our group's new web page.
Visualization of Quantum Monte-Carlo Simulations
 |
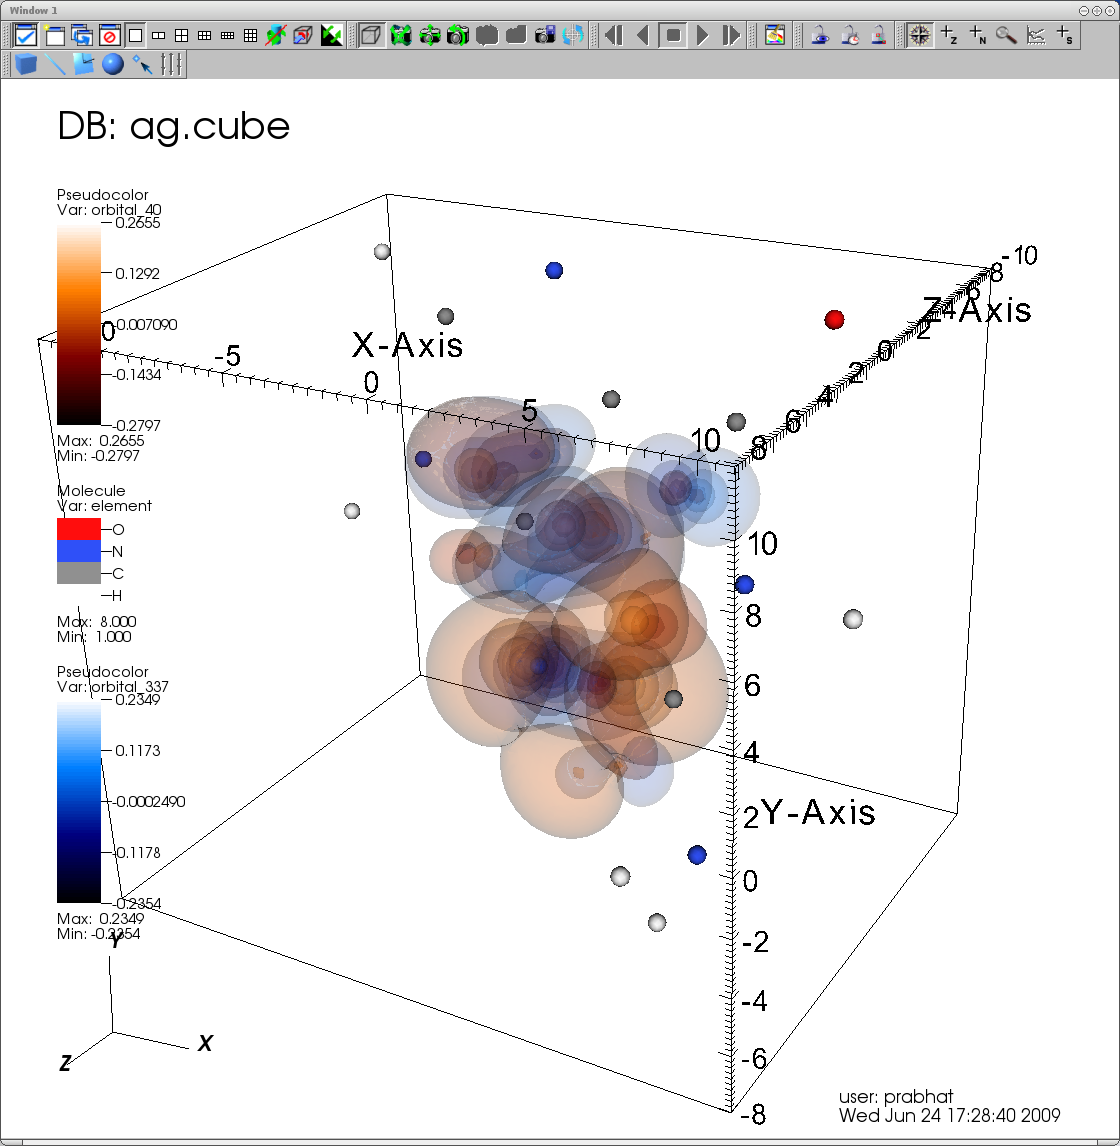 |
| Plot of 2 electron trajectories and iso-density surfaces. | Plot of multiple orbitals. |
Researchers at UC Berkeley and LBNL use quantum monte carlo simulations to derive minimum energy configurations for molecular systems. Simulations involving a small number of atoms and relatively few electrons can result in complex energy configurations which are very hard to understand without a geometric representation. In this collaboration, we developed plugins to load CUBE and XML formats into VisIt. We provided the researchers with an array of sophisticated visualization techniques to gain insight into the relationship of electron trajectories and overall system energy. The tools include plotting iso-contour lines, overlaying multiple fields (such as electron density and electric potential), plotting time-varying trajectories and iso-surfaces.
UC Berkeley/LBNL Collaborators
- Sinisa Vukovic
- Maciej Haranczyk
Media