This is an archival copy of the Visualization Group's web page 1998 to 2017. For current information, please vist our group's new web page.
Visualization of Jablonowski test case on geodesic grid
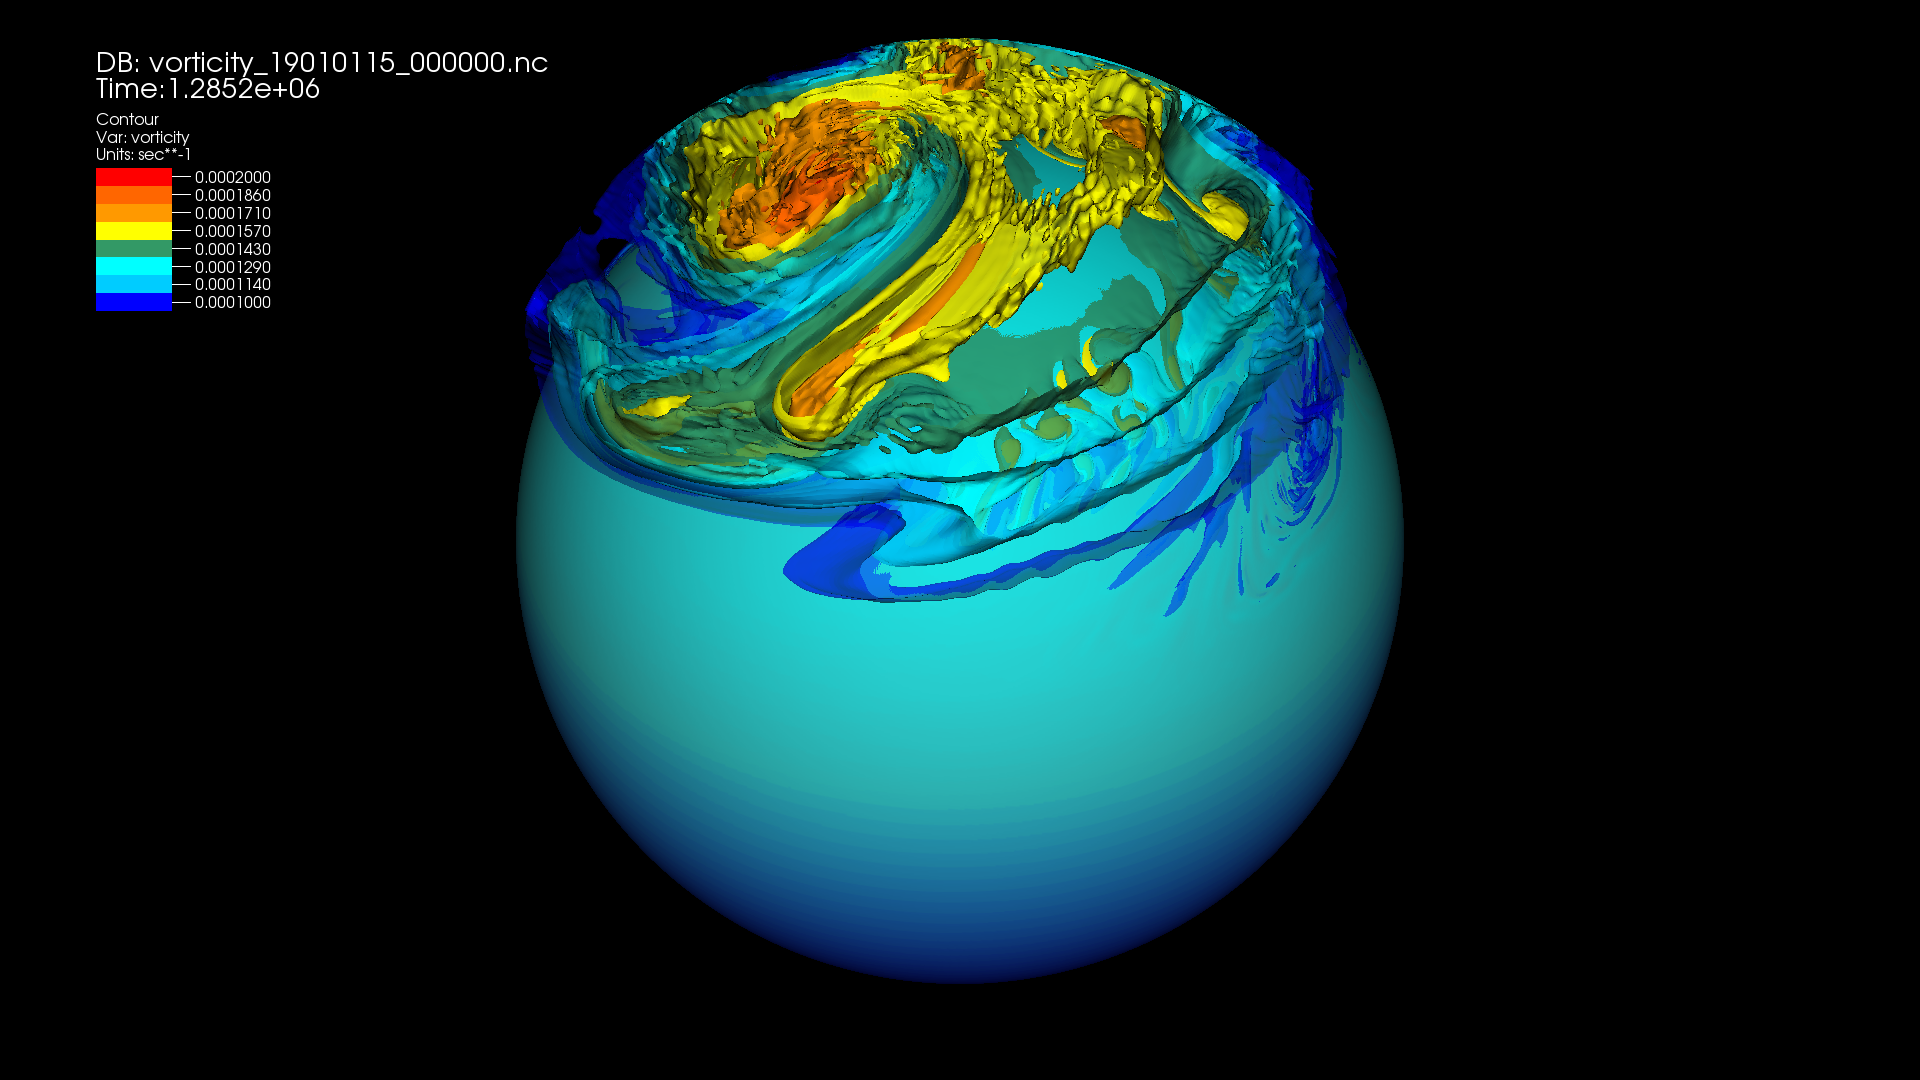
Accurate modeling of Earth's climate is one of the biggest challenges facing HPC today. One of the largest sources of error in existing climate models is the simulation of clouds. By increasing the grid resolution from 200 km to 2 km, clouds can be accurately resolved in simulations. Current latitude/longitude-based decompositions do not scale to these high resolutions, thus alternative discretizations, such as the icosahedral mesh must be used. The demo illustrates the Jablonowski test case running on an icosahedral mesh, We plot isocontours corresponding to different vorticity levels in the atmosphere.
Acknowledgement
Data provided by Dave Randall, Celal Konor and Ross Heikes (Colorado State Univ). Joint work with Karen Schuchardt, Bruce Palmer, Annette Koontz and Jeff Daily (PNNL). Visualization by Prabhat (LBNL).