This is an archival copy of the Visualization Group's web page 1998 to 2017. For current information, please vist our group's new web page.
Radiation Biology and DNA Repair
Project Overview
Radiation damage to DNA and the repair thereof is being investigated at LBNL by the Department of Radiation Biology and DNA Repair in the Life Sciences Division. Large simulations of radiation damage to DNA have been performed. This allows theoretical models to be tested and/or verified. It has also lead to insights into the structure of DNA at the level of the chromatin fibers.
The simulations being done involve thousands of base pairs and each base pair contains ~40 atoms. Simulating and visualizing structures this large (or larger) at the atomic level is difficult and/or impossible. Of course, in many cases such a fine level of detail is unnecessary or unwanted. It is often desirable to look at the higher level structure and interactions. This has lead to the investigation of hierarchical structures for representation, computation, and visualization. An LDRD for research in this area was summitted in 1997 for FY '98 to fund this research.
Technical Details
We have begun this investigation by developing some prototype tools in Khoros which allow us to look at data in PDB format and a modified PDB format used by the researchers. The modified format contains some hierarchy in addition to standard PDB format hierarchies.
Our current tools allow a representation to be selected along with a "level of detail". Then a template can be used to selectively display, color, and modify the radii of the data. Figure 1 shows a single nucleosome visualized in a variety of ways. Here the sugars helices are colored green and cyan and the bases are colored red (adenine), yellow (cytosine), blue (guanine), and magenta (thymine). The top row shows base pairs represented a colored lines, ribbons, and spheres. The bottom row shows each base-sugar and each base pair displayed as a single sphere. The color is based on one of the bases represented by the sphere.
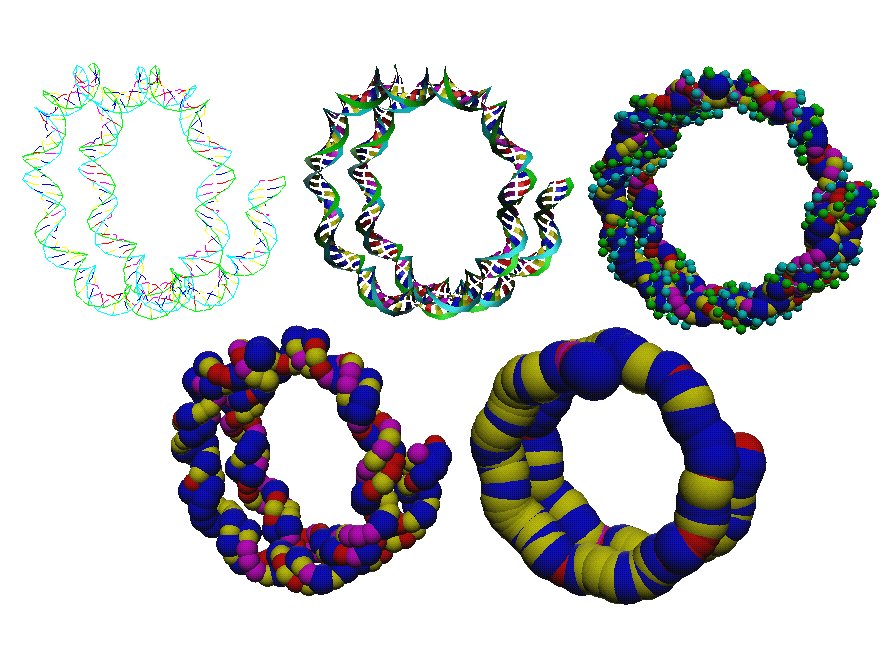 |
Figure 1: Some representation of the standard nucleosome DNA structure.
These different representations can be used to manipulate the DNA structure more quickly (lines are rendered much more quickly than spheres). They can also be used to see structure at different levels more easily. For example in the most detailed picture with spheres you can see the basic helical structure of the DNA but in the lowest detail picutre with spheres you can see the DNA helix winding to form the nucleosome.
These tools were used to visualize a number of calculations done involving radiation damage and DNA structure. To interactively examine the results the DNA structure was represented by lines. When the results were understood and verified then final images (see below) were produced using spheres.
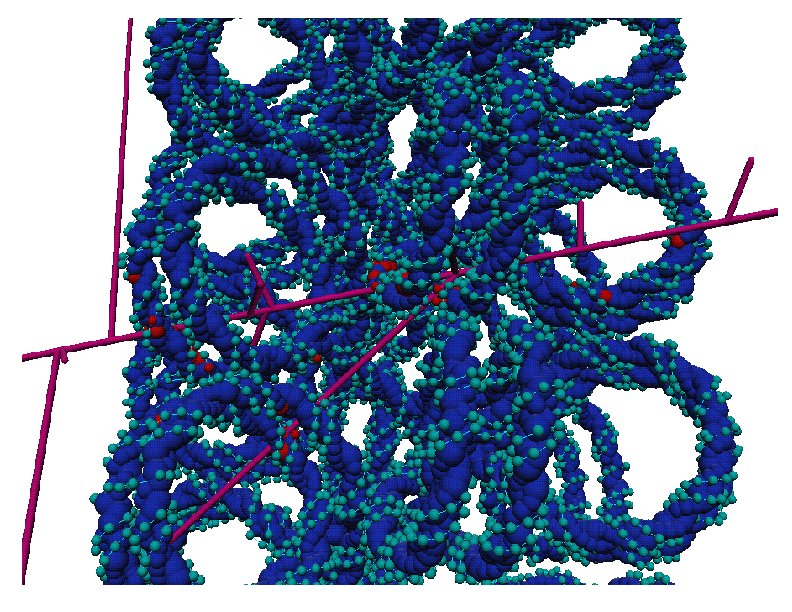
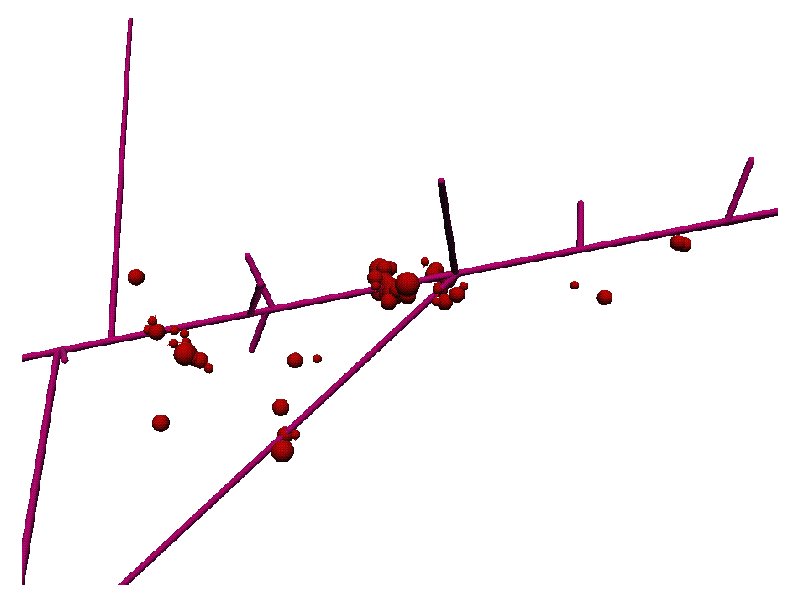
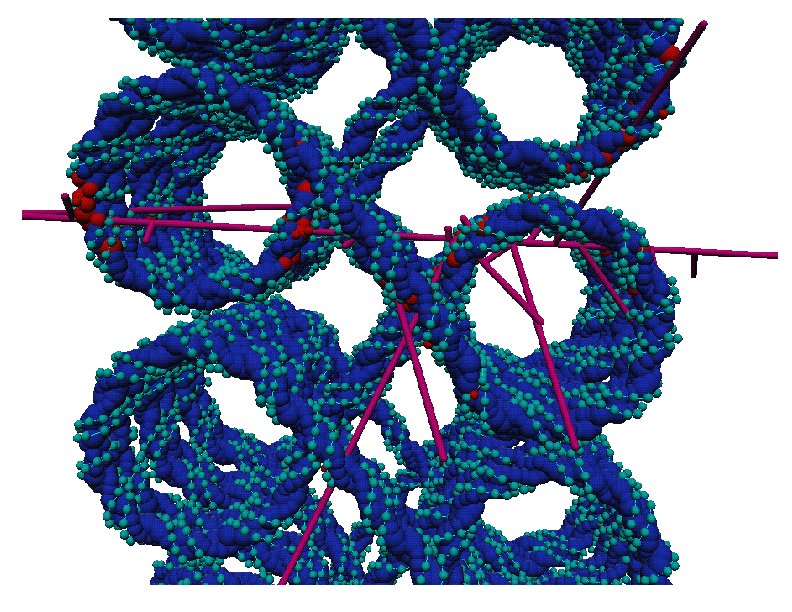
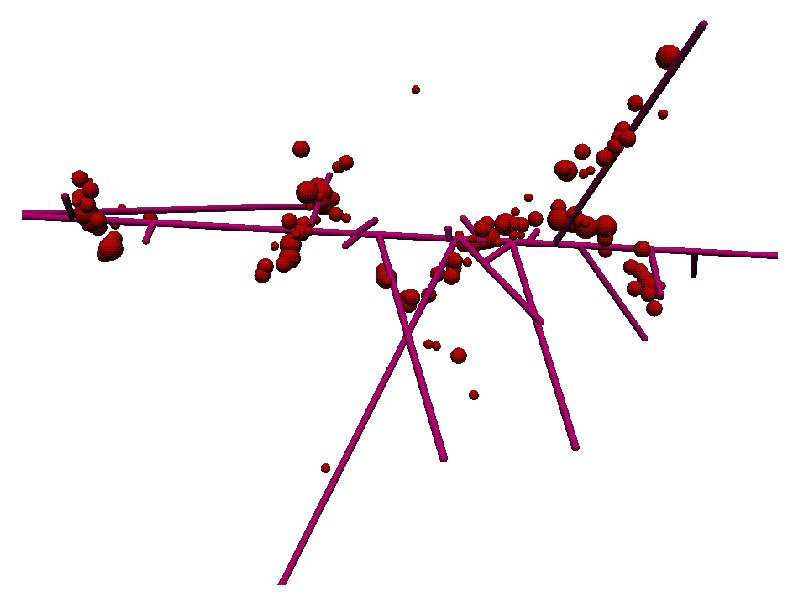
In Figure 2, radiation damage to DNA in a solenoid structure has been simulated and displayed. Magenta lines represent the radiation tracks, red spheres represent damaged sugars and bases, blue spheres represent the undamaged bases, and cyan spheres represent the undamaged sugars. In the left image all the bases and sugars are shown, in the middle image only the damaged bases and sugars are shown, and in the right image the entire DNA solenoid and radiation trace are shown. In should be noted that bases and sugars can be damaged even if the radiation doesn't directly pass through them.
 |
 |
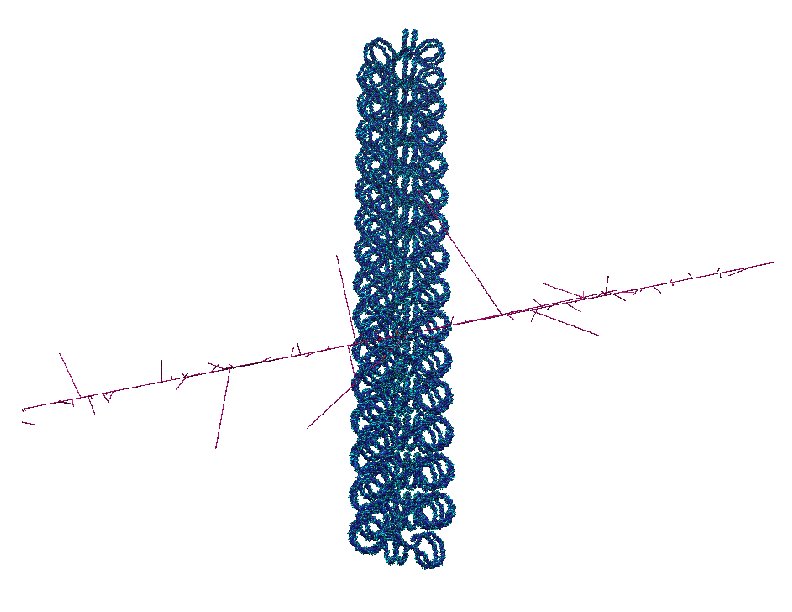 |
Figure 2: Radiation damage to DNA in a solenoid structure.
Figure 3 shows two views of the solenoid DNA structure. This structure is one level above the level of nucleosomes. When this structure is used for the radiation damage computations, the results do not agree with experiments. As a result, alternative structures have been proposed.
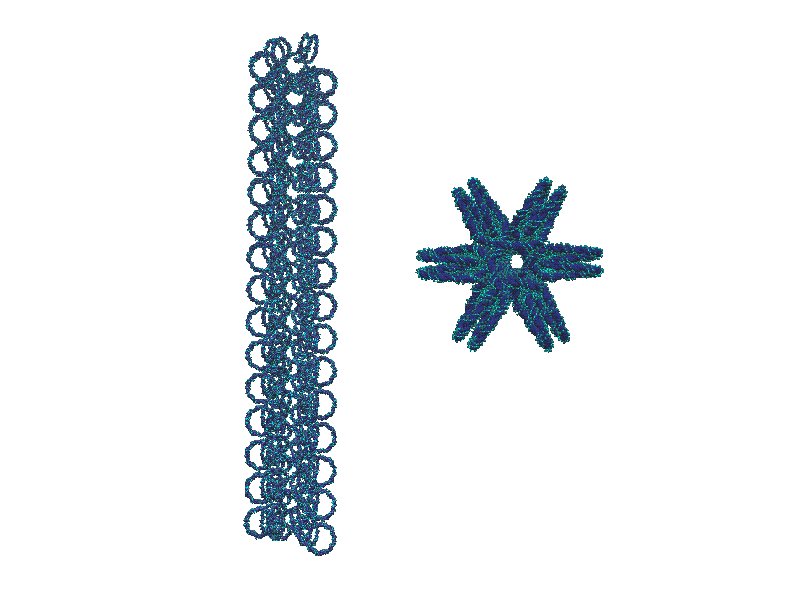 |
Figure 3: Two views of the solenoid DNA structure.
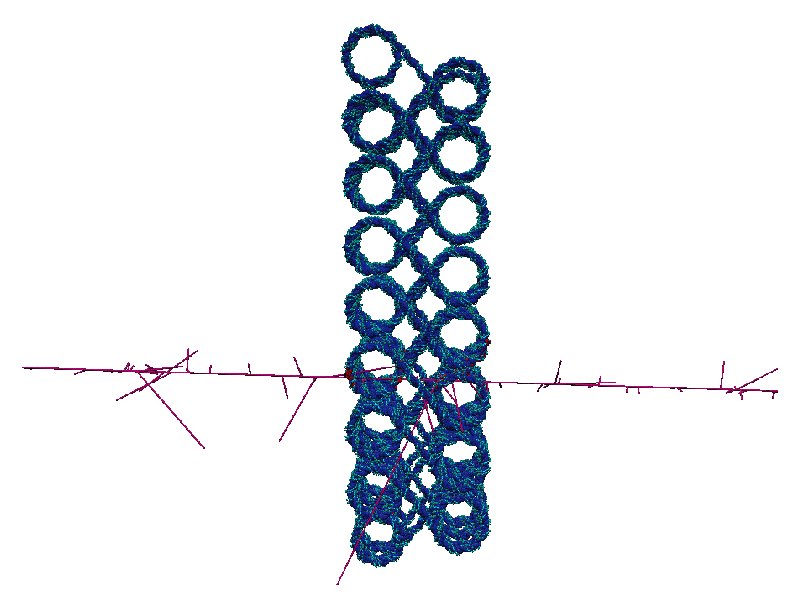
Figure 4 shows radiation damage to one such alternative structure. This is a zig-zag, ribbon structure. The simulation results for this structure agree much better with experiment in the case of radiation damage.
 |
 |
|
Figure 4: Radiation damage to DNA in a zig-zag, ribbon structure.
Finally, in Figure 5 there are multiple views of the zig-zag ribbon DNA structure which give some idea of how this is connected in a global sense.
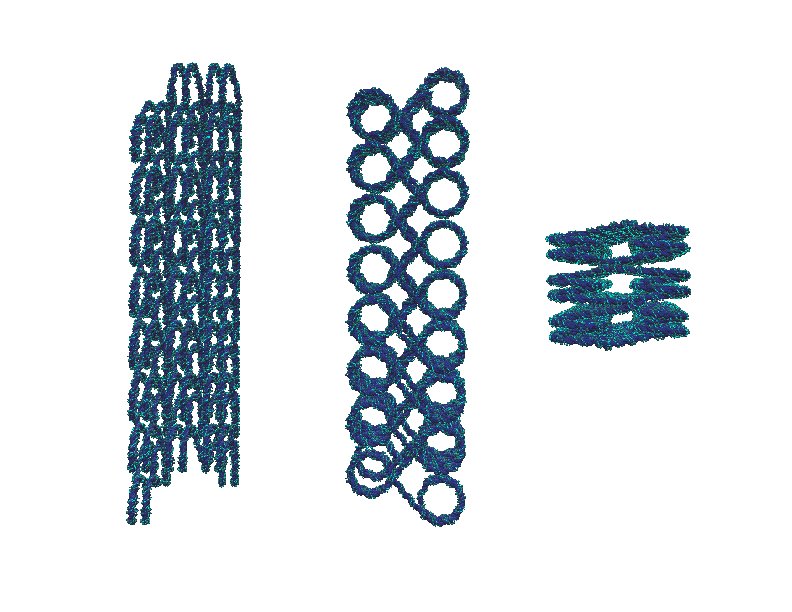 |
 |
Figure 5: Multiple views of the zig-zag, ribbon DNA structure.
Future Work
The current tools deal with a very specific type of input data (i.e. a modified form of the PDB format). As a result the visualization is tied very closely to this input format. The input data format needs to be generalized and with it the visualization tools which read it. Hierarchical representations and geometry need to generated automatically from the input based on its structure and hierarchies.