This is an archival copy of the Visualization Group's web page 1998 to 2017. For current information, please vist our group's new web page.
Visualization Vignettes
Visualization plays an integral role in the scientific process - allowing a way to see the unseen by creating images of experimental data or theoretical simulation results. The projects listed on this page represent recent or current collaborative efforts between the CRD Data Analytics and Visualization Group and others performing scientific research in both simulation/computational and experimental sciences.
| 2017 |2016 |2015 |2014 | 2013 | 2012 | 2011 | 2010 |
| 2009 | 2008 | 2007 | 2006 | 2005 | 2004 | 2003 | 2002 | 2001 | 2000 |
| 1999 | 1998 | 1997 | 1993 |
2017
| NWB:N -- Beta of Neurodata Without Borders 2.0 Format and Software Released | ||
|---|---|---|
 Image Credit: Oliver Ruebel |
| |
| BASTet: Berkeley Analysis and Storage Toolkit | ||
 Image Credit: Oliver Ruebel |
| |
2016
2015
| OpenMSI Receives R&D 100 Award | ||
|---|---|---|
 |
| |
| BrainFormat: A Data Standardization Framework for Neuroscience Data | ||
 Image Credit: Wikimedia Commons |
| |
2014
| Visible-Wavelength Polarized Light Emission with Small-Diameter InN Nanowires | ||
|---|---|---|

|
| |
| Petascale Study of Ion Foreshock Dynamics | ||

|
| |
2013
| OpenMSI: A Science Gateway to Sort Through Bio-Imaging's Big Datasets | ||
|---|---|---|

|
| |
2012
| High Performance Visualization—Reference Book | |
|---|---|

|
Visualization and analysis tools, techniques, and algorithms have undergone a rapid evolution in recent decades to accommodate explosive growth in data size and complexity and to exploit emerging multi- and many-core computational platforms. High Performance Visualization: Enabling Extreme-Scale Scientific Insight focuses on the subset of scientific visualization concerned with algorithm design, implementation, and optimization for use on today's largest computational platforms. (More information) |
| Streamline Integration using MPI-Hybrid Parallelism on a Large, Multi-Core Architecture | |
|
Studies show the hybrid-parallel implementation of streamline integration, a key visualization algorithm, performs better and moves less data than a traditional MPI-only implementation. (More information) | Efficient Parallel Extraction of Crack-free Isosurfaces from Adaptive Mesh Refinement Data |
|
Efficient parallel extraction of crack-free isosurfaces from AMR data in a distributed memory setting. (More information) | MetroMaps: Map-based Representations for Analyzing Optimization Solution Spaces |
|
Using the Morse complex to understand energy functions in chemical systems. (More information) | Topological Cacti: Combining Structural and Quantitative Information |
|
Visualizing topological and quantitative information about isosurfaces. (More information) | Pattern Detection in Climate Data |

|
New algorithms and tools help climate scientists study extreme weather events like hurricanes using large, parallel computational platforms. (More information) | Parallel I/O, Analysis, and Visualization of a Trillion-Particle Simulation |

|
First-ever trillion-particle runs of a plasma physics code, the computer science research needed to enable this feat, and the science discoveries that result. (More information) | Performance Optimization and Auto-tuning |

|
Studies show up to a 30x performance gain is possible on some codes and platforms depending upon settings for tunable algorithmic parameters, algorithmic optimizations, and use of device-specific features. (More information) |
| High-throughput Characterization of Porous Materials | |
 |
The goal of this work is to enable high-throughput screening of large material databases to characterize material properties and enable fast identification of candidate materials for application-specific problems such as carbon capture. (More information) |
| Query-Driven Analysis of Large Scale Time-dependent Data | |
 |
Query-driven analysis based on single timestep queries is a versatile tool for the identification and extraction of temporally persistent and instantaneous data features. Many questions of interest ---such as, which particles become accelerated, which locations exhibit high velocities during an extended timeframe, which particles reach a local maximum energy, or which particles change their state--- inherently depend on information from multiple timesteps and cannot directly answered based on single-timestep queries alone. The goal of this effort is to extend our query-driven analysis capabilities to enable scientists to formulate time-dependent queries that accumulate information from multiple timesteps, here called cumulative queries. (More information) |
| Linking PointCloudXplore and Matlab: Making Advanced Analysis Easily Accessible | |
 |
Three-dimensional gene expression PointCloud data, generated by the Berkeley Drosophila Transcription Network Project (BDTNP), provides quantitative information about the spatial and temporal expression of genes in early Drosophila embryos at cellular resolution. The goal of this work has been to maximize the impact of BDTNP PointCloud data by integrating the visualization system PointCloudXplore with Matlab to: i) make PointCloud data easy to comprehend for developers, ii) to enable developers to deploy their analyses within the context of an advanced easy-to-use visualizations system, and iii) to make novel, advanced analyses capabilities easily accessible to biologist users. (More information) |
| High-performance Computing for Computational Finance | |
 |
The SEC and CFTC recently proposed the development of a
Consolidated Audit Trail System (CATS), a next-generation system for market monitoring. The goal of our work has been to evaluate how high-performance computing can support financial data analysis and, in particular, the development and implementation of early warning systems for detection and analysis of market anomalies.. (More information) |
| Environmental Management: Hanford Site Nuclear Waste Clean-up | |

|
The U.S. Department of Energy's (DOE) Office of
Environmental Management (DOE/EM) supports an effort to understand and
predict contaminant fate and transport in natural and engineered
systems. Geologists, hydrologists, physicists and computer scientists
are working together to create models of existing, contaminated sites,
and to simulate their behavior. Simulation results are verified based
on historical data and extrapolated into the future. Visualization is
used for model setup verification, visual analysis of high-performance
computing simulation results, and uncertainty quantification. The image depicts simulated Technetium-99 contamination under six cribs at the Hanford site (volume rendering). (More information) MPEG4 Movie clip (3.3MB). |
| Parallel Stream Surface Computation for Large Data Sets | |

|
Stream surfaces, a useful flow visualization technique, are difficult to compute accurately and efficiently on large, parallel platforms. Our team has developed a new algorithm that addresses both of these challenges. (More information) |
| CO2 Sequestration and Storage: From Raw Micro-CT to Quality Measurements | |

|
Working closely with earth sciences researchers, we have developed a collection of algorithms and software tools that helps scientists to conduct quantitative analysis of 3D imaging data in order to better understand how to store CO2 in geologic reservoirs. (More information) |
| Flying Through the Known Universe in 3D | |

|
Berkeley Lab researchers created a 3D movie where the viewer flies through the known universe. (More information) |
2011
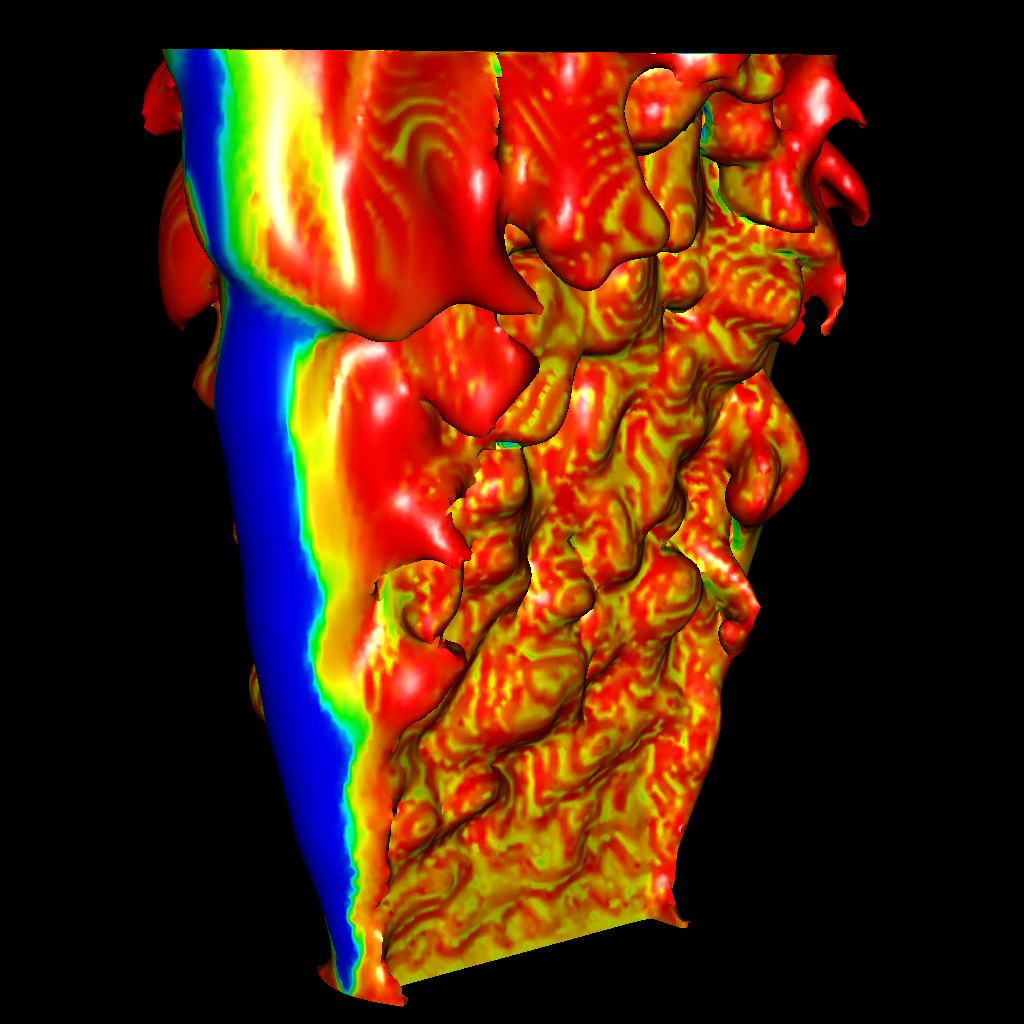
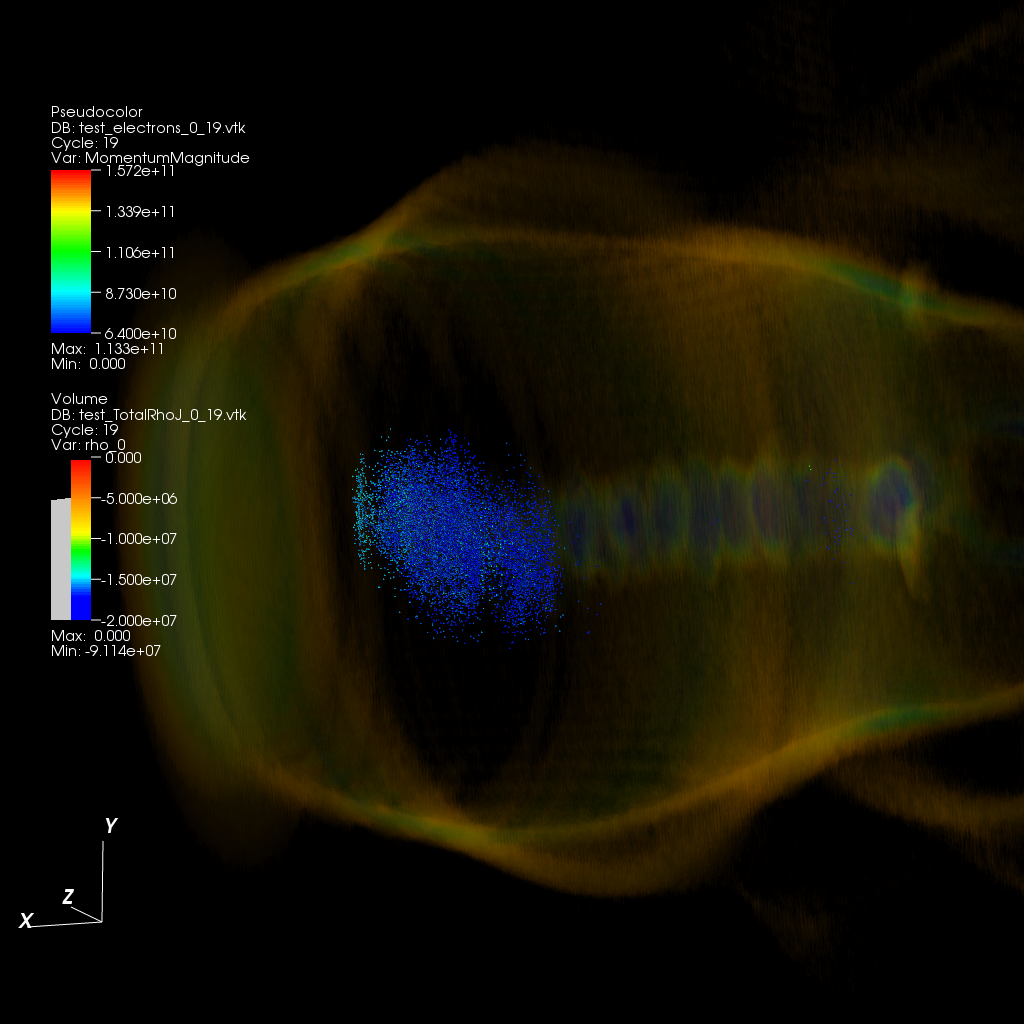
| Parallel Query-driven Analysis of Electron Linac Simulations | |
|---|---|

|
Researcher of the Accelerator & Fusion Research Division
at Lawrence Berkeley National
Laboratory (LBNL) utilize large-scale, high-resolution simulations of
beam dynamics in electron linacs for studies of a proposed next-generation
x-ray free electron laser (FEL) at LBNL
(external link). Particle-in-cell-based simulations of this type
of accelerator require large numbers of macroparticles (> 108)
to control the numerical macroparticle shot noise and to avoid
overestimation of the microbunching instability, resulting in massive
particle datasets. The sheer size of the data generated by these types
of simulations poses significant challenges with respect to data I/O,
storage, and analysis. For more information on how we address these
challenges see here.
|
| Visualizing the Universe @100Gbps | |

|
LBL Visualization group worked closely with ESnet personnel
to showcase a real-time streaming demo at SC11. The demo was able to
attain maximum bandwidth utilizaton on ESnet's 100Gbps link and showed
a live data stream from NERSC to Seattle. (More information) |
| Environmental Management: Nuclear Waste Site Clean-up | |
 |
The U.S. Department of Energy's (DOE) Office of
Environmental Management (DOE/EM) supports an effort to understand and
predict contaminant fate and transport in natural and engineered
systems. Geologists, hydrologists, physicists and computer scientists
are working together to create models of existing, contaminated sites,
and to simulate their behavior. Simulation results are verified based
on historical data and extrapolated into the future. Visualization is
used for model setup verification, visual analysis of high-performance
computing simulation results, and uncertainty quantification. The image depicts contamination under the Savannah River F-area basin as a contour plot over time along with a terrain model (structured mesh with elevation data) and well sites. (More information) MPEG4 Movie clip (341MB). |
Exploring How Advanced Architectures Can Accelerate Flow Visualization |
 |
(More information) |
2010
| Analysis of Void Space of Porous Materials Used in Energy-related Applications | |
|---|---|
 |
We have developed partial differential equations-based tools
that perform analysis of porous materials. These tools involve the
application of the Fast Marching Method (FMM) to predict if a molecule
can traverse through a channel system representing void space of the
materials, map accessible parts of these void spaces and calculate
accessible volumes and surfaces. (More information) MPEG4 Movie clip (2MB). |
| Unveiling the Interior of 3D Micro-CT from Iron-Sand Composite | |
 |
In this project, we apply computer vision techniques to
Micro-CT datasets with the eventual goal of characterizing materials
for carbon sequestration. (More information)
MPEG4 Movie clip (2MB). |
| Visualizing Type Ia Supernova Explosions | |
 |
Deep inside a dying star in a galaxy far, far away, a carbon
fusion flame ignites. Ignition may happen in the middle or displaced
slightly to one side, but this simulation explores the consequences of
central ignition. In a localized hot spot, represented here by a
deformed sphere with an average radius of 100 km, carbon is assumed to
have already fused to iron, producing hot ash (~10 billion K) with a
density about 20% less than its surroundings. As the burning
progresses, this hot buoyant ash rises up and interacts with cold fuel.
Rayleigh-Taylor fingers give rise to shear and turbulence, which
interacts with the flame, causing it to move faster. In about 2
seconds, the energy released blows the entire white dwarf star up,
leaving nothing behind but a rapidly expanding cloud of radioactive
nickel, iron, and other heavy elements. A Type Ia supernova is born. Credits: produced by Hank Childs of VACET in conjunction with members of the Computation Astrophysics Consortium (CAC): Haitao Ma and Stan Woosley of UC Santa Cruz, and John Bell, Ann Almgren, and Andy Nonaka of LBL. MPEG4 Movie clip (48MB). |
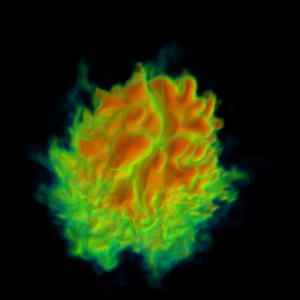
| Buoyant Burning Bubbles in Type Ia Supernovae | |
 |
Flame ignition in type Ia supernovae leads to isolated
bubbles of burning buoyant fluid. As a bubble rises due to gravity, it
becomes deformed by shear instabilities and transitions to turbulent
evolution. This simulation shows the temperature field of such a bubble
burning in a uniform background. The simulation was conducted using a
specialized low Mach number hydrodynamics code for thermonuclear
flames. Adaptive mesh refinement was used to focus resolution on the
bubble, reducing computational expense. The effective resolution was
4096^3. Research and Visualization courtesy of Andy Aspden and John
Bell (LBNL). (More
information) MPEG movie (1MB) |
| Turbulent Jets with Off-Source Heating | |
 |
Latent heat release associated with condensation during
cloud formation leads to enhanced buoyancy in atmospheric plumes, and
results in anomalous entrainment behavior. These simulations are based
on the laboratory experiment of Bhat and Narasimha (1996) who injected
an acidic jet into a deionized ambient, and used electrodes to
selectively heat the jet fluid, analogous to condensation. The
simulations were conducted with CCSE's incompressible Navier-Stokes
solver (IAMR), and shows the tracer fluid. Adaptive mesh refinement was
used to focus resolution on the jet fluid, reducing computational
expense. The effective resolution was 512 x 512 x 768. Analysis of the
data shed light on the complex feedback mechanism between heating,
turbulence and entrainment. Research and Visualization courtesy of Andy
Aspden and John Bell (LBNL). (More
information) MPEG movie (3MB) |
| Hurricane Season | |
 |
Visualization of hurricane formation and evolution. (More information)
MPEG movie (40MB) |
| Visualization of Jablonowski Test Case | |
 |
Visualization of the Jablonowski test case on a geodesic
grid. We plot temperature and vorticity fields. (More information) MPEG movie (20MB) |
| GPU Implementations of 3D Image Denoising Filters | |
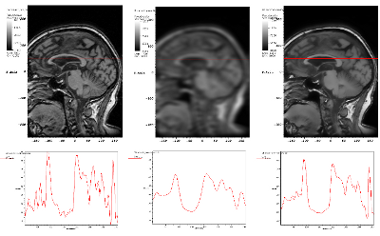 |
Denoising is a important step in many image processing pipelines for brain magnetic resonance imaging (MRI). Using GPUs, we have accelerated the runtime for two 3D filters, the bilateral filter and the anisotropic diffusion filter, that remove noise and smooth features within MR images while at the same time preserving edges. (More information) |
| Hybrid Parallelism for Volume Rendering at Large Scale | |
 |
We studied the performance and scalability characteristics of ``hybrid'' parallel programming and execution as applied to raycasting volume rendering — a staple visualization algorithm — on a large, multi-core platform. Our findings indicated that the hybrid-parallel implementation, at levels of concurrency ranging from 1,728 to 216,000, performs better, uses a smaller absolute memory footprint, and consumes less communication bandwidth than the traditional, MPI-only implementation. (More information) |
2009
| Smashing the Trillion Zone Barrier | |||
|---|---|---|---|
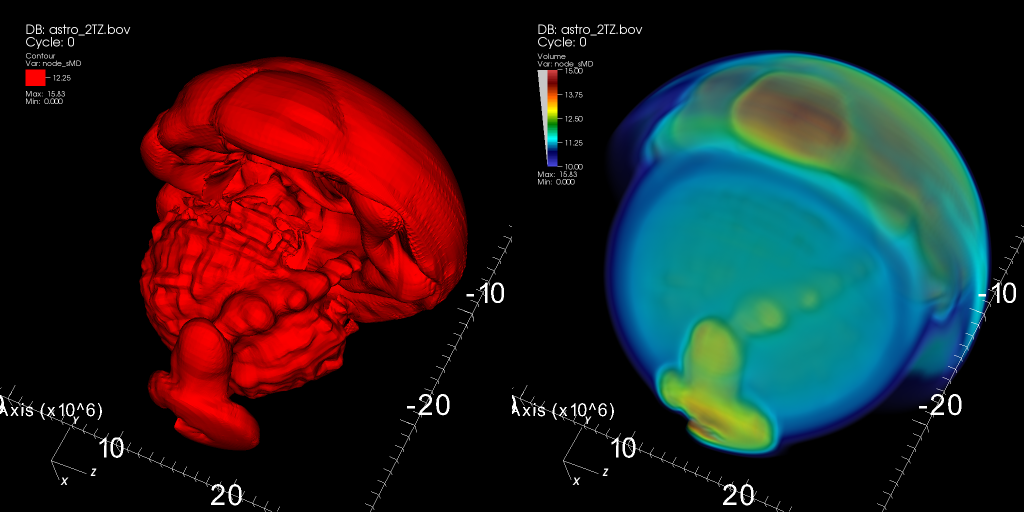 |
LBL visualization researchers helped lead an effort to test the scalability limits of production visualization software on very large data sets, including meshes with trillions of grid points. (More information) |
||
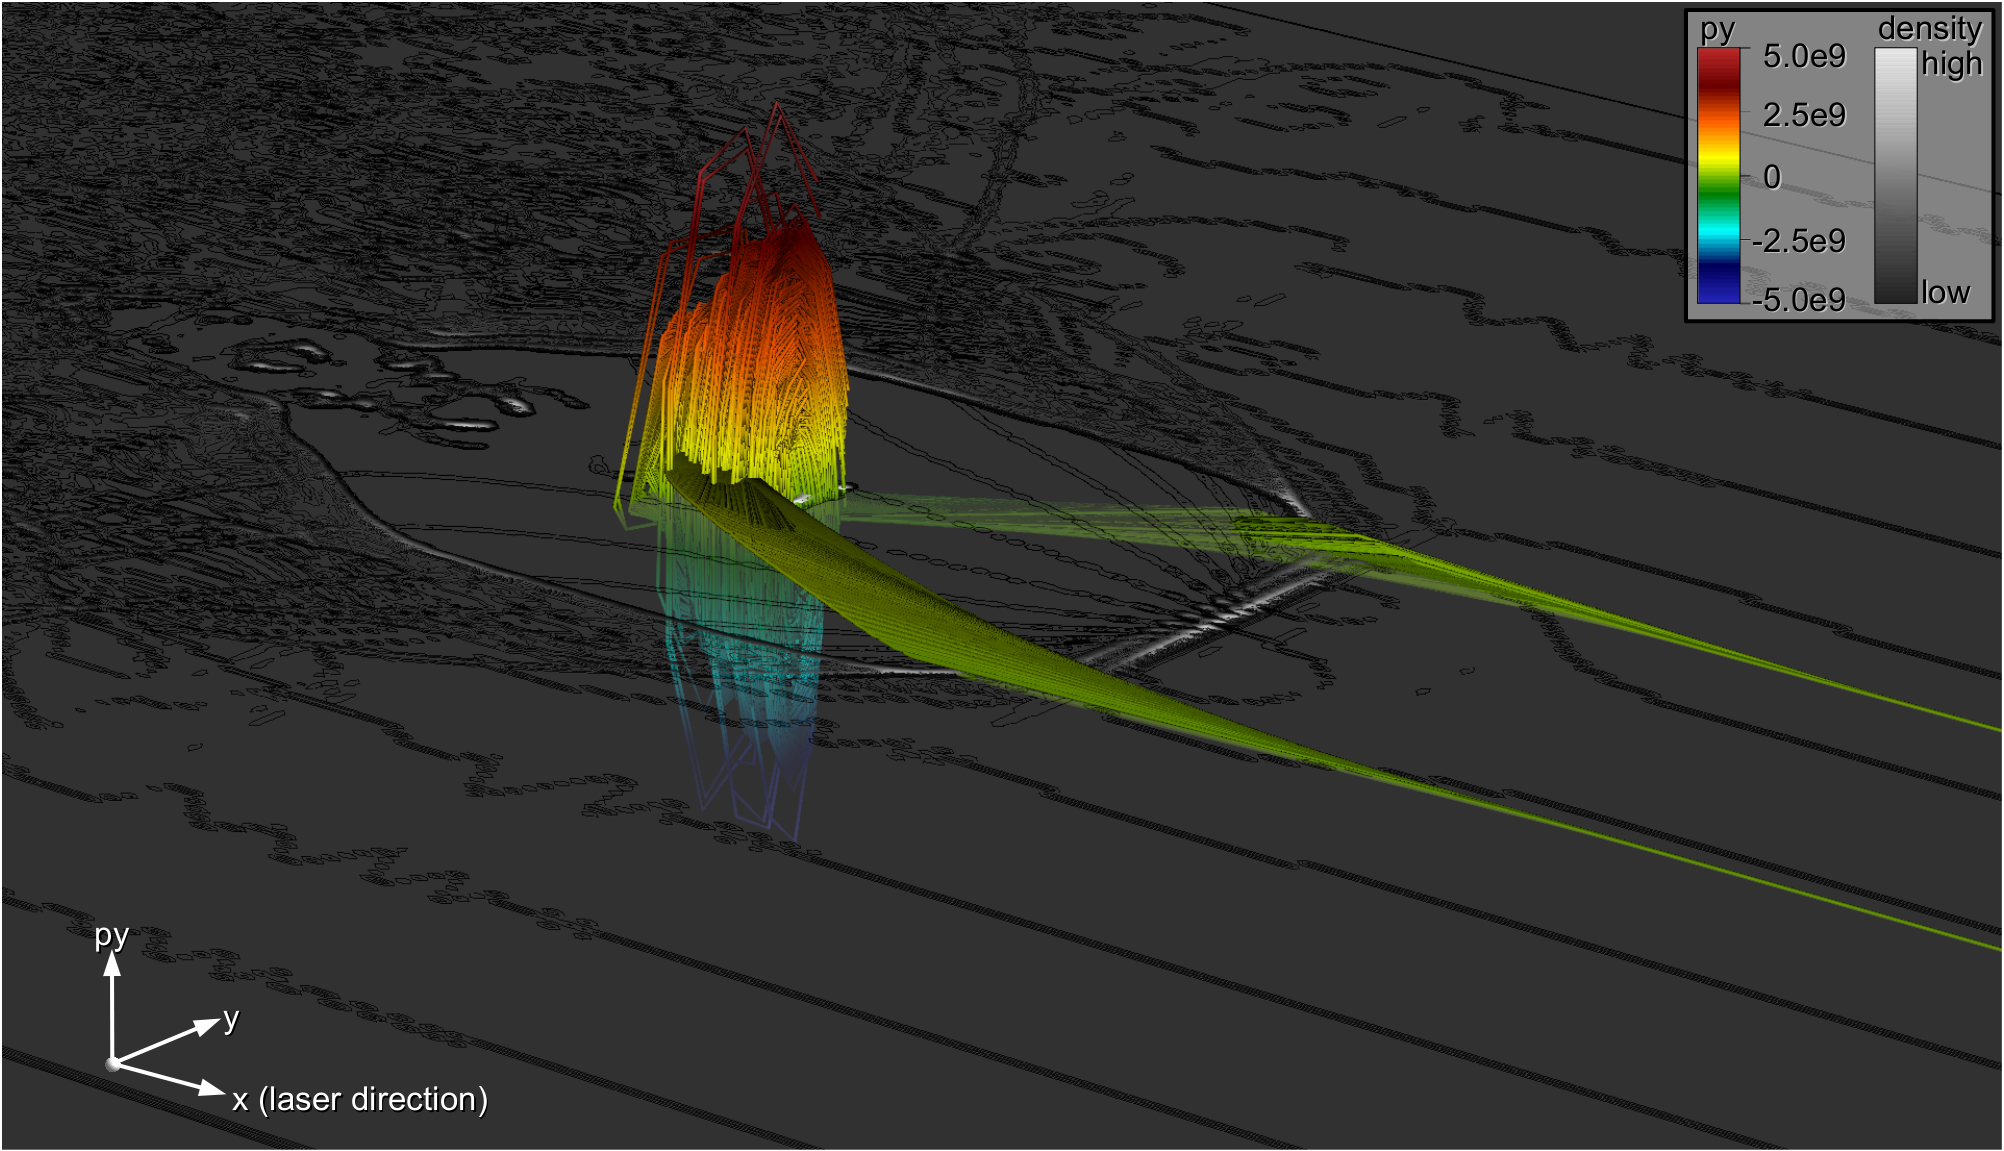
| Analysis of Laser
Wakefield Particle Acceleration Data |
|||
 |
In collaboration with researchers of the LOASIS
program (LBNL) and the SciDAC SDM center (LBNL) we have been working on
various efforts aimed at improving the analysis of laser wakefield
particle acceleration data. This page provides and overview of these
various efforts. (More
information) Visit also the other related vignette pages with more detailed information about the individual efforts. |
||
| Automatic Beam Path
Analysis of LWFA data |
|||
 |
Numerical simulations of laser wakefield particle
accelerators play a key role in the understanding of the complex
acceleration process and in the design of expensive experimental
facilities. As the size and complexity of simulation output grows, one
main challenge is the need for computational techniques that aid in
scientific knowledge discovery. The automatic beam path analysis
consists of a set of data-understanding algorithms that work in concert
in a pipeline fashion to automatically locate and analyze high energy
particle bunches undergoing acceleration in very large simulation
datasets. (More
information) This vignette is part of an ongoing collaboration with the LOASIS program at LBNL. For an overview of the various efforts within that project see here. |
||
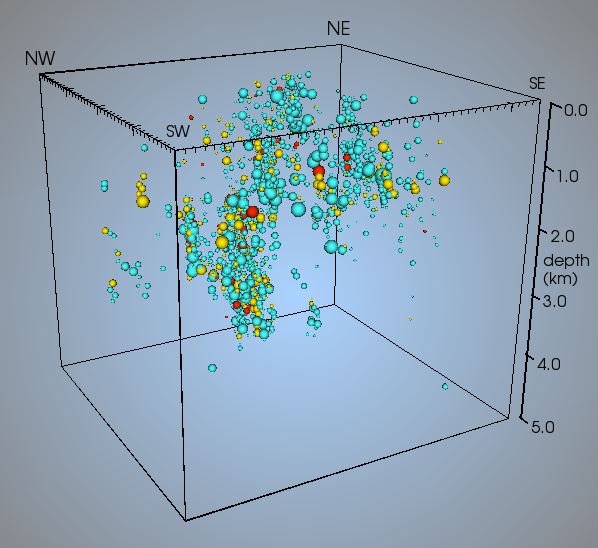
| Visualization of
Microearthquake Data from Enhanced Geothermal Systems |
|||
|
We are working with geophysicists in the Earth Sciences
Division (ESD)
at LBNL to generate 3D visualizations of microearthquake data from
geothermal sites. The importance of this work is that it provides the
means
for the geothermal site operators - and the public - to see where
microearthquakes are occurring as geothermal energy is produced at a
site.
The 3D visualizations are being made available via a Web
site hosted by the ESD. More information. |
||
| PointCloudXplore:
Visualization and Analysis of 3D Gene Expression Data |
|||
| |
In collaboration with the BDTNP at LBNL
and IDAV
at UC-Davis we developed PointCloudXplore, a visualization system
designed for the analysis of 3D gene expression data. PointCloudXplore
supports advanced physical and abstract visualizations linked via the
concept of cell selection. The user can select cells of interest in any
view and investigate further properties of the selected cells in any
other view. The BDTNP has made PointCloudXplore available for download
free of charge via their webpage. (More
information) |
||
| Visualization of Quantum Monte-Carlo simulations | |||
 |
NERSC Analytics personnel are supporting researchers at UC Berkeley and LBNL in aiding visualization of quantum monte-carlo simulations. We developed VisIt plugins to import CUBE and XML formats and generated visualizations demonstrating the interplay of electron densities, trajectories and energy configurations. (More information) |
||
| Global Cloud Resolving Models | |||
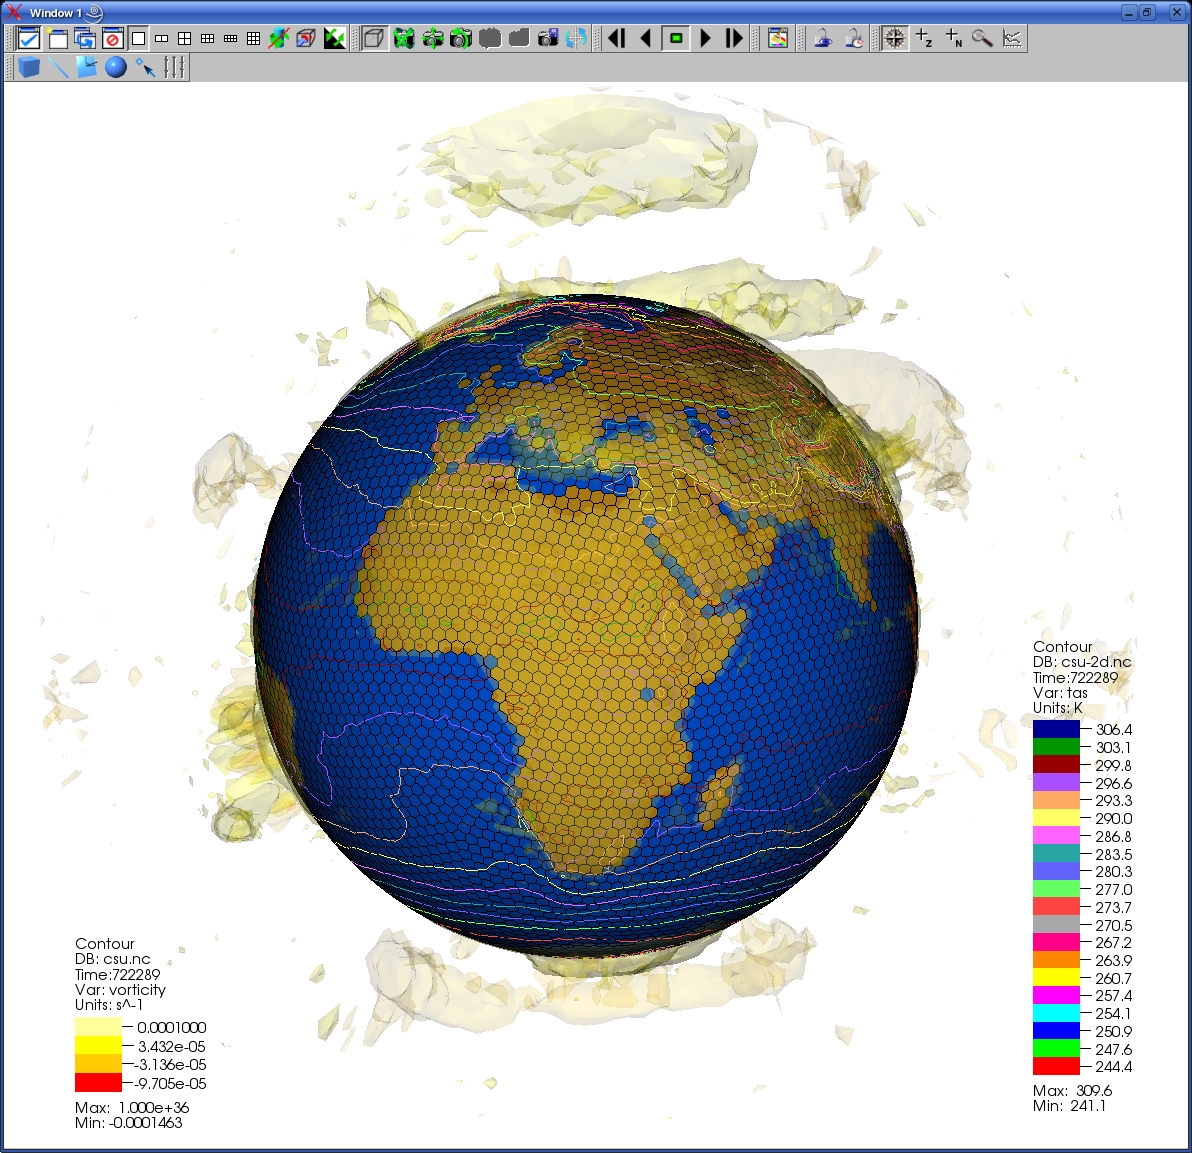 |
Climate researchers led by Dave Randall (CSU) are developing a novel Global Cloud Resolving Model based on a geodesic grid. We are supporting Dave Randall and collaborators from PNNL in facilitating high-performance I/O on franklin; developing a data model for the geodesic grid and developing plugins in VisIt to handle the large simulation datasets. (More information) |
||
2008
| High-performance interactive visualization of LWFA simulations | |
|---|---|
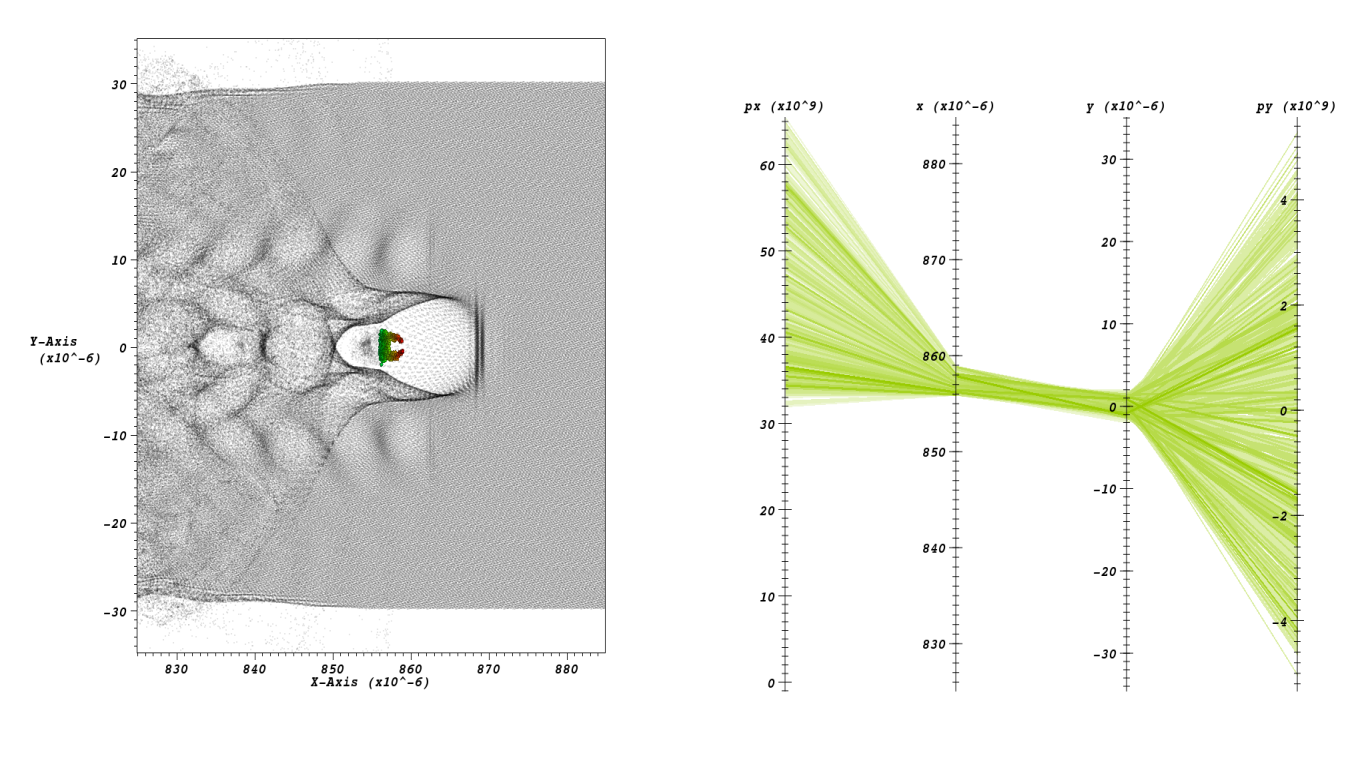 |
Analysis of laser wakefield particle acceleration data is a challenging task. Our approach combines and extends techniques from high performance scientific data management and visualization, enabling researchers to gain insight from extremely large, complex, time-varying laser wakefield accelerator simulation data. We extend histogram-based parallel coordinates which we use as visual information display and interface for guiding and performing data mining operations. We use multi-dimensional thresholding as vehicle for selecting particles of interest at a particular timepoint. We use FastBit, a state-of-the-art index/query system for data extraction and subsetting. (More information) This vignette is part of an ongoing collaboration with the LOASIS program at LBNL. For an overview of the various efforts within that project see here |
| Visualization of large-scale GFDL/NOAA climate simulations | |
 |
NERSC Analytics personnel supported climate scientists from
GFDL/NOAA in running large scale runs of their next generation CM2.4
and c180 models at very high resolutions. In order to efficiently
render the large datasets, VisIt plugins were developed for the file
formats. Custom visualizations depicting phenomena of interest
(hurricane formation, etc) were also developed. More
information. |
| Direct Numerical Simulation of Turbulent Flame Quenching by Fine Water Droplets | |
 |
NERSC Analytics staff supported Incite12 collaborators in
using VisIt for analyzing their simulation runs. We resolved a number
of data import issues and enabled generation of publication-quality
images. A number of tutorials on using VisIt for simulation data are
provided. More
information. |
2007
| Visualization of Magneto-rotational instability and turbulent angular momentum transport | |
|---|---|
 |
This project, led by by Fausto Cattaneo, University of Chicago, used a previous allotment of 2 million processor-hours to study the forces that help newly born stars and black holes increase in size. In space, gases and other matter often form swirling disks around attracting central objects such as newly formed stars. The presence of magnetic fields can cause the disks to become unstable and develop turbulence, thereby causing the disk material to fall onto the central object. This run at NERSC was used to set up initial conditions for a larger scale simulations. The Visualization Group assisted this project in generating High-quality visualizations of data produced in these runs. Based on these initial results, the project continues to carry out large-scale simulations to test theories on how turbulence can develop in such disks. (More information) |
| Visualization Research | |
 |
One fundamental element of scientific inquiry is the discovery of relationships. We have developed a new technique suitable for computing and displaying relationships, thereby accelerating knowledge discovery in large and complex scientific datasets. (More information) |
| Sunfall: Visual Analytics for Astrophysics | |
 |
The Visualization Group participated in the design and
implementation
of Sunfall, a
collaborative visual analytics system for the Nearby Supernova Factory
(SNfactory),
the largest data volume supernova search currently in operation.
Sunfall utilizes interactive
visualization and analysis techniques to facilitate insight into
complex, noisy, high-dimensional,
high-volume, time-critical data. The image at left is from the
"supernova details view" from
the Supernova Warehouse, one component of Sunfall. The details view
enables access to photometric supernova images, spectral data,
lightcurves, and associated metadata. More information. |
| Fusion: NIMROD HDF5 VisIt Plugin | |
 |
The Visualization group is writing a NIMROD HDF5 database
plugin for
VisIt (http://www.llnl.gov/visit). The plugin can be recompiled in unix
platforms to use with a local version of VisIt or it can be used
directly in davinci.nersc.gov. The HDF5 data model is specified in the
Fusion Simulation Markup Language (FSML)
project. More information. |
| SciDAC Computational Astrophysics | |
 |
This project, "When Good Stars Go Bang", is part of the SciDAC Computational Astrophysics Consortium studying supernovae, gamma-ray bursts, and nucleosynthesis More information. |
2006
| Fast Contour Descriptor Algorithm for Supernova Image Classification | |
|---|---|

|
Members of the Visualization Group collaborated on the
development
of a fast contour descriptor algorithm which was applied to a
high-volume supernova detection system (the Nearby Supernova Factory)
Our shape-detection algorithm
reduced the number of false positives generated by the supernova search
pipeline by 41% while producing no measurable impact on running time.
Because the number
of Fourier terms to be calculated is fixed and small, the algorithm
runs
in linear time, rather than the O(n log n) time of an FFT. More information. |
| Supernova Recognition Using Support Vector Machines | |
 |
This work demonstrates the great potential impact that
supervised
learning has to improve the efficiency of large-scale digital sky
surveys
that are slated to collect terabytes of nightly imagery in search of
celestial objects
(SNAP, LSST, DES, Pan-STARRS).
The Nearby Supernova Factory
(SNfactory)
is an international project to obtain spectrophotometry data on a large
sample of Type Ia supernovae in a nearby redshift range in order to
measure the expansion history of the universe.
Members of the Visualization Group have used supervised learning
techniques (Support Vector
Machines (SVMs), boosted decision trees, random forests) to
automatically
classify all incoming subimages on a nightly basis and rank-order them
by
the classifier decision value, allowing astrophysicists to quickly
examine
the 20 or so most promising candidates arriving each morning. More information. |
| Laser Wakefield Particle Acceleration | |
 |
Particle-in-Cell Simulation of Laser Wakefield Particle
Acceleration: A 2006 INCITE Project. This project, led by Cameron Geddes of Berkeley Lab, was awared 2.5 million hours to perform detailed 3D models of laser-driven wakefield particle accelerators. These plasma-based accelerators are not subject to electrical breakdown and have demonstrated accelerating gradients thousands of times those obtained in conventional accelerators. The particle-in-cell simulations proposed in this study will interpret recent experiments and assist in the planning of the next generation of particle accelerators and ultrafast applications in chemistry and biology. More information. This vignette is part of an ongoing collaboration with the LOASIS program at LBNL. For an overview of the various efforts within that project see here |
| SciDAC2 Visualization and Analytics | |
 |
A fundamental aspect of large-scale, data-intensive
computational
and experimental science is the ability to quickly gain knowledge
from large and complex collections of scientific data. To respond
to this challenge, we have assembled a leading team of researchers
and developers to tackle this very problem over a five-year period
as part of DOE's SciDAC2 program. This effort marks the first
SciDAC Visualization Center, and will play a key role in scientific
knowledge discovery in the latter half of the first
decade of the 21st Century. At the 2006 SciDAC meeting in Denver, CO held during June 2006, we presented a white paper and poster describing out team's approach. |
| Biophysics | |
 |
Cryo-EM and single molecule biophysical studies of dsDNA
packaging in Bacillus subtilis bacteriophage Phi 29. Luis R. Comolli 1, Andrew Spakowitz 2, Cristina E. Siegerist 1, Shelley Grimes 3, Paul Jardine 3, Kenneth H. Downing 1, Dwight Anderson 3 and Carlos Bustamante 1,2. 1 Lawrence Berkeley National Laboratory, 2 Physics Department, University of California at Berkeley, 3 Academic Health Center, University of Minnesota. |
| High Performance Visualization — Query-Driven Network Traffic Analysis | |
 |
Query-driven visualization plays an important role in high
performance
visualization and data-intensive knowledge discovery. This case
study explains the technology and shows how it is applied to
a "hero-sized" network traffic analysis problem. More information. E. Wes Bethel (CRD/LBNL), Scott Campbell (NERSC/LBNL), Eli Dart (ESnet/LBNL), Kurt Stockinger (CRD/LBNL), Kesheng (John) Wu (CRD/LBNL). |
| Climate Modeling | |
 |
This plot is a 3D view of 6000 months of net primary
productivity, 2m air temperature and soil moisture at Harvard Forest
generated by a coupled climate model (CSM1.4+Carbon) with
biogeochemistry component in the land model. Yun Helen He, LBNL |
| Physical Chemistry: Journal Cover | |
 |
Computational studies of molecular hydrogen binding affinities: The role of dispersion forces, electrostatics, and orbital interactions , Rohini C. Lochan and Martin Head-Gordon, Physical Chemistry Chemical Physics, 2006, 8, 1357 - 1370 Rohini Lochan, Martin Head-Gordon, UC Berkeley |
2005
| Beam Dynamics: new images of particle tracking | |
|---|---|
 |
More images. Andreas Adelmann, PSI |
| Visualization of Magneto-rotational instability and turbulent angular momentum transport | |
 |
In space, gases and other matter often form swirling disks
around attracting central objects such as newly formed stars. The
presence of magnetic fields can cause the disks to become unstable and
develop turbulence, thereby causing the disk material to fall onto the
central object. This project carries out large-scale simulations to
test theories on how turbulence can develop in such disks. More information on this project. For more information on the NERSC 2005 Incite projects click here Fausto Cattaneo et al. University of Chicago |
| Life Sciences: Cell Division of Caulobacter Crescentus. | |
 |
Composite image showing original 2D cryo electron microscopy
image
(center) and membrane models and volume rendering of the 3D
recontruction (right upper corner and left lower corner). More information. Ken Downing, Luis Comolli, LBNL. |
| Combustion: Rod-stabilized V-flame | |
 |
Curvature of a premixed combustion front. CCSE web page. More images J.Bell et al., CCSE, LBNL |
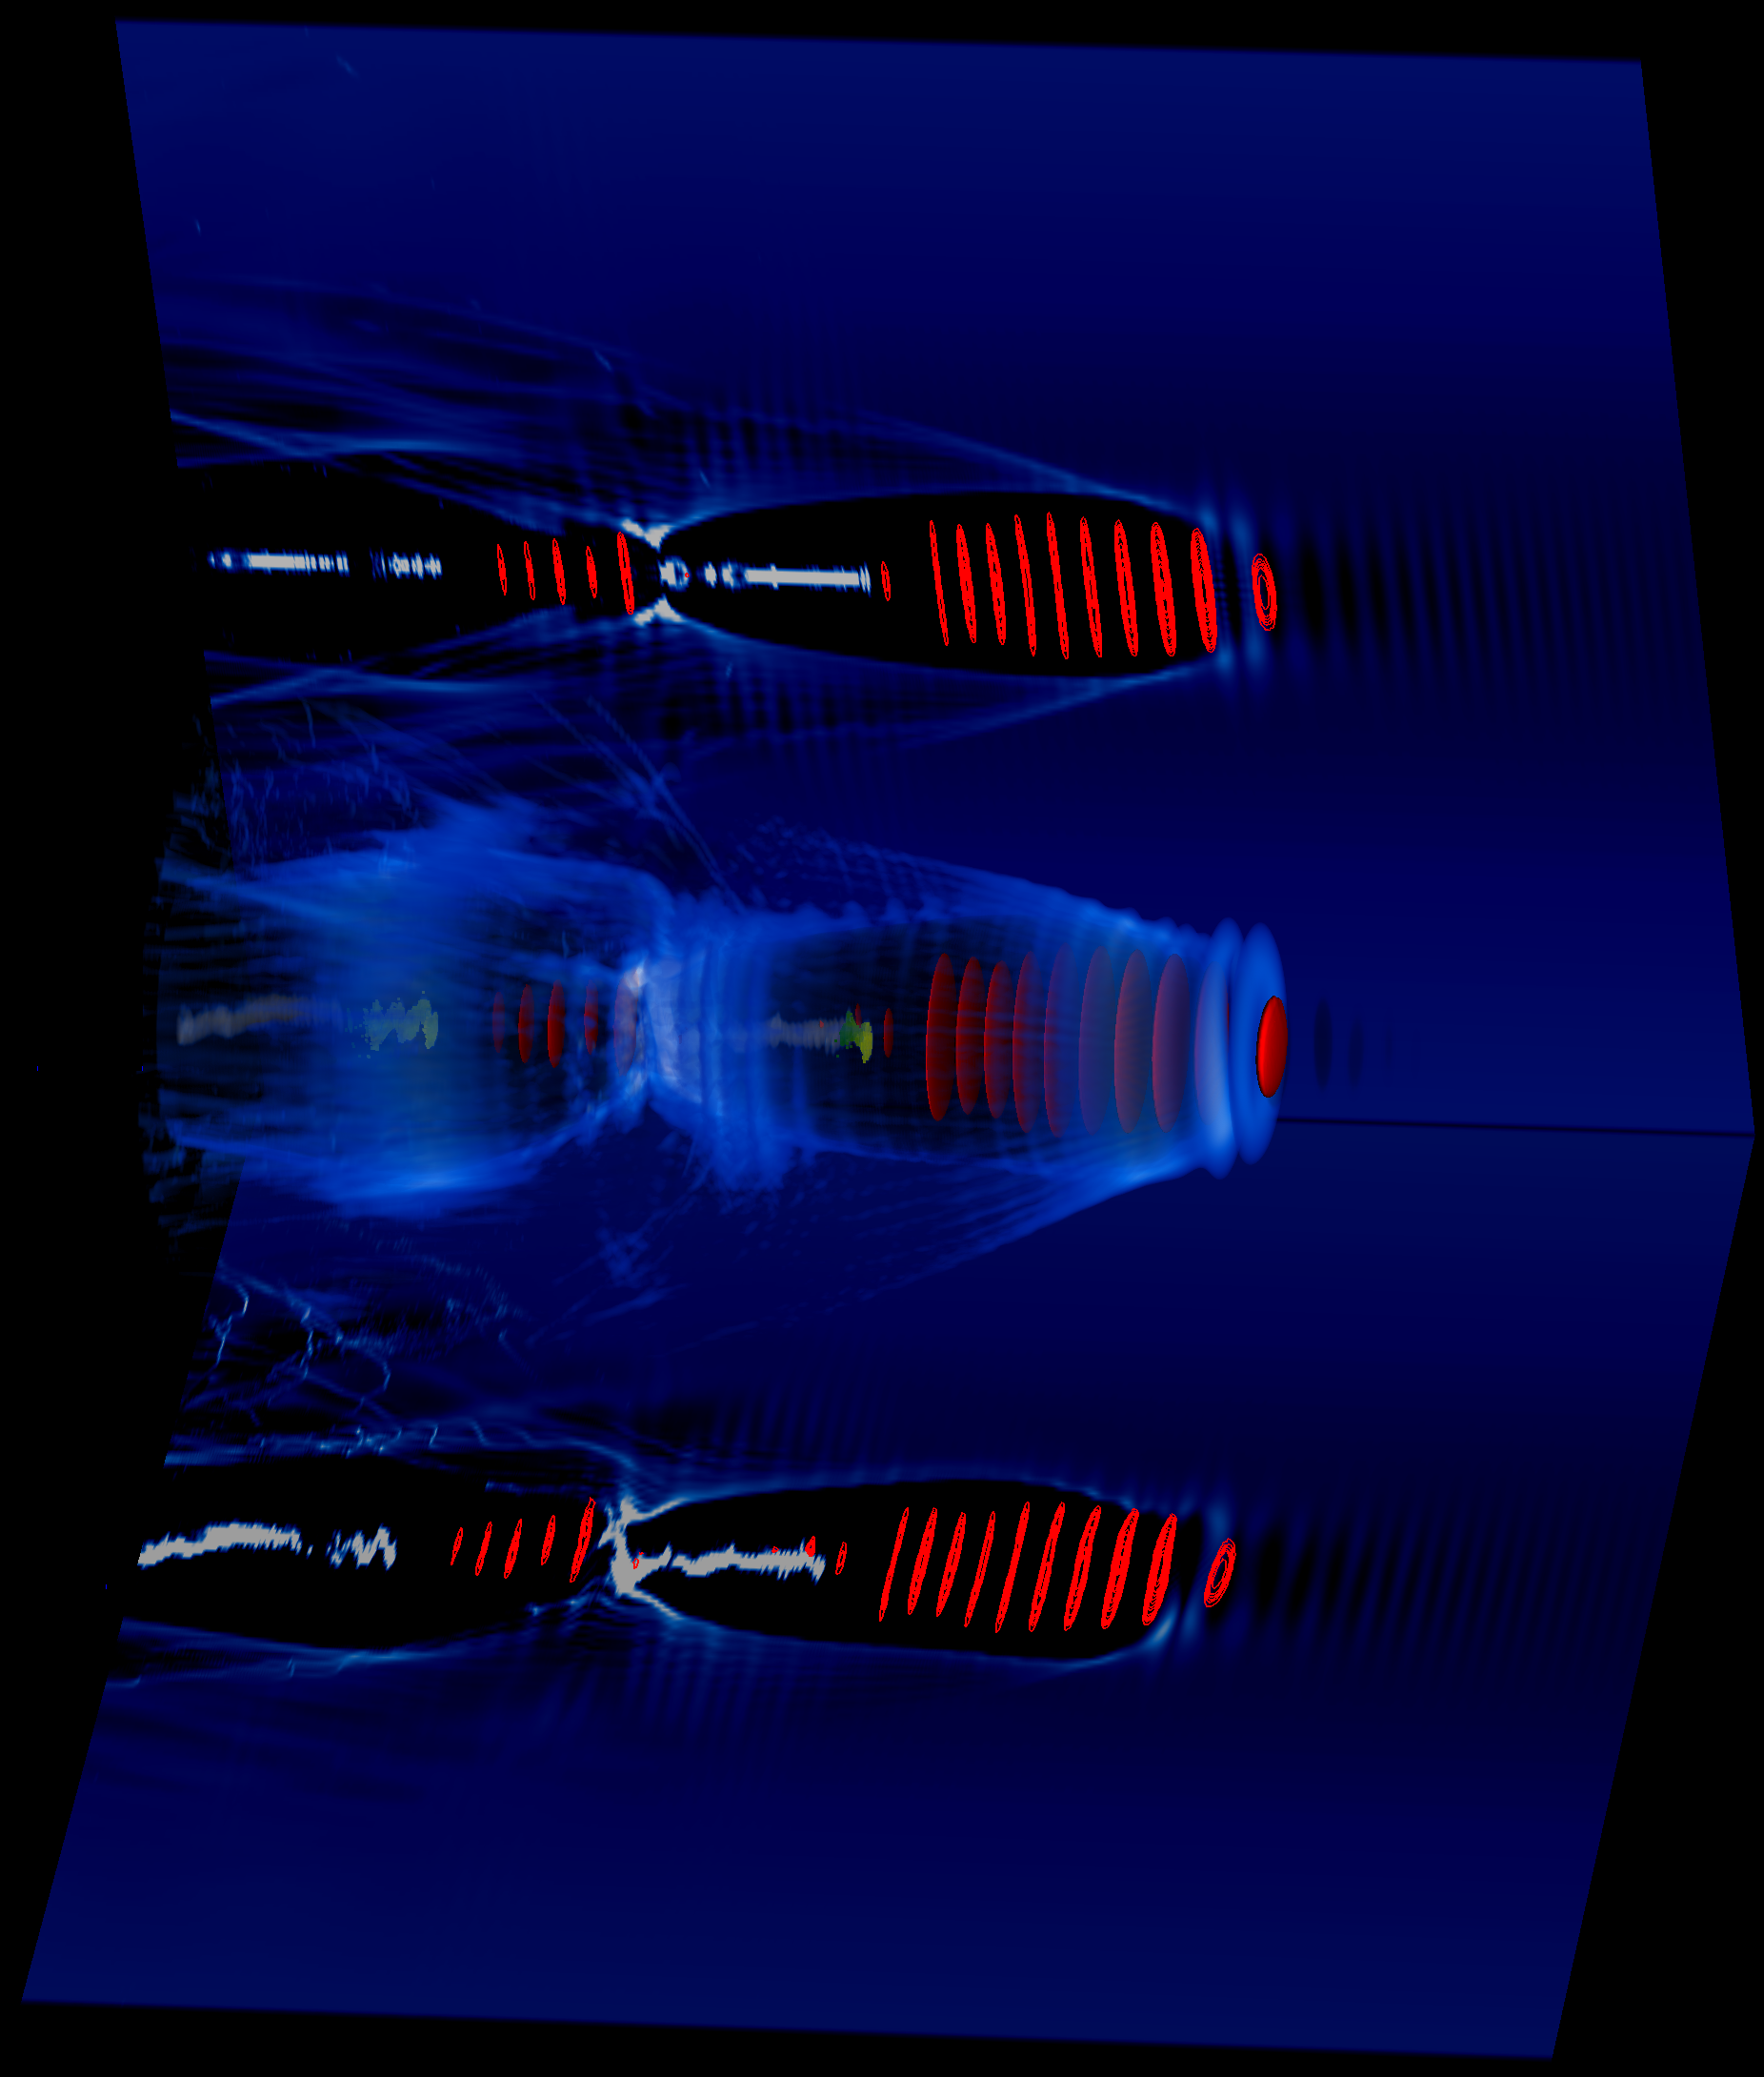
| Electron Cloud Simulations | |
 |
This image shows a proton beam moving along the beam pipe
(z-axis) in
the presence of an electron cloud. The proton beam is shown in red in
the center of the pipe. The model, incomplete, you will see no velocity
component for the electrons along the z-axis, was a first approximation
to model the proton-electron interaction in the beam line. The pipe is
colored by the electron density, the same information is shown in the
upper graph. MPEG Movie of the
simulation (4.8MB). More images soon. A. Adelmann, PSI |
| Fluid Turbulence | |
 |
Visualization of Fluid Turbulence using AVS/Express,
CEI/Ensight and
Paraview. More images. P.K.Yeung, D.Donzis, Georgia Tech |
| Electron Pair Localization Function Visualization | |
 |
EPLF of F2 More information. W.Lester, UC Berkeley |
2004
| Incite3: Fluid Turbulence | |
|---|---|
 |
Visualization Helps Provide Insight into 3D Fluid Turbulence
and Mixing
at High Reynolds Number. More information. |
| Incite1: Quantum Chemistry | |
 |
Visualization of Electron Walkers Computed by Quantum Monte
Carlo
Simulation of Energy Pathways in Photosynthesis Reactions More information. |
| Delivering Interactive, 3D Visualization to the Desktop | |
 |
The MBender project explores the use of QuickTime VR
Object
Movies
to deliver interactive, 3D scientific visualization to the desktop in a
remote and distributed visualization setting. More information. |
| Adaptive Mesh Refinement Visualization | |
 |
Adaptive Mesh Refinement (AMR) is a technique for
automatically
refining (or de-refining) regions of a computational domain during a
numerical calculation based upon application-specific criteria, like
flamefront tracking during a combustion simulation. The multiresolution
and hierarchical nature of AMR grids presents special challenges for
mainstream visualization tools, which typically can operate only on
single grid domains. At SC04, the LBNL Visualization Group will show
ongoing AMR visualization activities. First, LBNL's
hardware-accelerated volume renderer is being used to create images for
a PBS special movie on cosmology. Second, the group will demonstrate
use of custom data converters that permit AMR grids to be visualized
using CEI's Ensight and LLNL's Visit, both of which are applications
that implement a pipelined/parallel architecture and are effective in
remote and distributed visualization contexts. More information. |
| Tomography - 3D Reconstruction | |
 |
Cryo-electron microscopy Reconstruction of tomographic data from a tilt series of images using cryo-electron microscopy. Click here for details Ken Downing's Lab, LBNL |
| AVS/Express ModelBuilder | |
 |
Model Builder ModelBuilder is an application to build a model of surfaces from 3D volume data (uniform mesh). Click here for details . |
| SciDAC: Terascale Computational Atomic Physics for Controlled Fusion Energy | |
 |
Visualization of Computational Atomic Physics for Fusion Atomic physics plays a central role in many of the high temperature and high density plasmas found in magnetic and inertial confinement fusion experiments, which are crucial to our national energy and defense interests, as well as in technological plasmas important to the US economic base. In turn, the development of the necessary atomic physics knowledge depends on advances in both experimental and computational approaches. The Computational Atomic Phyics for Fusion SciDAC project hosted at NERSC is producing early results simulating time evolution of a wavepacket scattering from a Helium atom. Click here for details. M. Pindzola, Auburn University. |
| Accelerator Modeling SciDAC | |
 |
Particle Viewer, PartView PartView is a lightweigth application to preview results of beam dynamics simulations. Click here for details John Shalf, Cristina Siegerist, CRD/LBNL Andreas Adelmann, PSI |
| Protein Folding | |
 |
Protein energy minimization using OPT++. The AMBER empirical energy of protein t209 was minimized using OPT++. In this visualization, the atoms are colored according to their displacement on consecutive minimization iterations. Folding evolution MPEG movies: t209(13M), t209(27M), t209(27M), t209 backbone(26M), t209 log color scale(27M), t209 log color scale no box(27M) Ricardo Oliva, Juan Meza, Silvia Crivelli, CRD/LBNL more images. |
| Fusion | |
 |
Visualization of 3D surface vector data from a plasma flow
simulation
on an irregular grid with AVS/Express. The AVS/Express streamlines or
advector modules do not display streamlines of a vector field on a 2D
surface in 3D space, binning the field to a uniform 3D grid allowed the
user to visualize streamlines in the 2D surface. D. Spong, ORNL more images. |
| Electron Cloud Simulation | |
 |
Trajectories of electrons selected interactively with a box
widget in
the projection of the last simulation step along the z direction. The
proton beam is rendered as volume density data. The trajectories are
rendered as splines colored by the magnitude of the velocities. more images. A. Adelmann, PSI |
 |
Electron cloud rendered as volume
density and proton beam rendered as particles (MPEG, 5.8M) (Quick Time, 84M). The
color bar on the left encodes the magnitude of the proton velocities
and the one on the left the density of electrons. more images. A. Adelmann, PSI |
 |
Electron cloud and proton beam rendered as particles (MPEG, 5.8M) more images. A. Adelmann, PSI |
| Computational Spin Dynamics | |
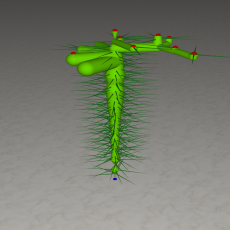
 |
Monte Carlo simulation of the D'yakonov-Perel' spin
relaxation mechanism: Simulation showing the time evolution of the
individual spins of an ensemble of 169 electrons in a zincblende. The
local effective magnetic fields (white) and the precessing spins
(green) are shown subject to pseudorandom scattering events as
determined from Monte Carlo techniques. The time dependence of the
three components of the total magnetization is shown in the line graph.
Movies are presented for a [001] substrate with structural inversion
asymmetry (SIA) effects only (MPEG), bulk
inversion asymmetry (BIA) and SIA when these effects have equal
magnitude (MPEG),
and for a [111] substrate with, again, BIA and SIA effects equal, where
the spin lifetime of all three components is enhanced (MPEG). more images. Xavier Cartoixà, LBNL, David Z.-Y. Ting, JPL |
2003
| Computational Astrophysics | |
|---|---|
 |
Continuing the work with the calculation of a supernova
atmosphere for different geometries. Simulation of photons emitted from
the supernova. To see a small test MPEG movie of the emission of
photons click here
(29M). For a larger MPEG click here (132M). A
montage of the emission of photons and the spectrum is here. more information more images. P.Nugent, D.Kasen, LBNL |
| Fusion | |
 |
more images. PPPL |
| Computational Astrophysics | |
|---|---|
  |
Continuing the work with the calculation of a supernova
atmosphere for different geometries.
Flux as a function of viewing angle QuickTime(133M). QuickTime(74M) MPEG(1.5M) more images. P.Nugent, D.Kasen, LBNL |
| Protein Folding | |
|---|---|
 |
Protein energy minimization using OPT++. The AMBER empirical energy of protein 1e0m was minimized using OPT++. In this visualization, the atoms are colored according to their displacement on consecutive minimization iterations. The initial configuration was constructed using ProteinShop. Folding evolution MPEG movies: with backbone(22M) and without backbone(21M), QuickTime movies: with backbone(133M) and without backbone(127M). MPEG movie colored with the absolute distance with respect to the initial position. Ricardo Oliva, Juan Meza, Silvia Crivelli, CRD/LBNL more images. |
 |
Protein energy minimization using OPT++. The AMBER empirical energy of protein T162 was minimized using OPT++. Folding evolution MPEG. Ricardo Oliva, Juan Meza, Silvia Crivelli, CRD/LBNL more images. |
| Simulations | |
 |
Accumulated Activity of 1D heterogeneous diffusion. Time Evolution Mpeg Salil Akerkar, University of Arizona more images |
2002
| Accelerator Modeling SciDAC | |
|---|---|
 |
Simulation Studies of Beam Dynamics: Simulation showing halo
particles being tracked backwards in an accelerator to their starting
points. Such simulations and associated visualizations provide insight
into the halo formation mechanism in high intensity beams. Color
encodes the magnitude of the velocity of the particles. (MPEG) A.Adelmann, LBNL more images |
 |
Simulation Studies of Beam Dynamics: Time dependent density
isosurfaces of a particle beam injected into an accelerator. The spiral
arms show the result of the interaction of the beam with the
environment. (MPEG) A.Adelmann, LBNL more images |
 |
May 2002. Large scale simulations performed on NERSC's IBM/SP supercomputer help accelerator physicists understand the electromagnetic interaction between beams in a collider. These figures show a collision between two bunches of particles. (MPEG) See below for more information. J.Qiang, R. Ryne, LBNL more images new collision images |
 |
March 2002. New work with the Beam Simulation data shows the time evolution in the x-PhaseX (MPEG) plane and in the y-PhaseY plane (MPEG) for 409 time steps. The color encoding shows the magnitude of the velocities. More information. JQiang, R. Ryne, LBNL |
| Imaging and Visualization | |
 |
2002 Summer Research Sample Results on 3D Morphing (MPEG) M.Eser, B. Parvin, LBNL |
 |
This visualization shows the automatic detection of cell
structures
and localization of protein expression from a volumetric dataset. This
is an important step in large scale analysis of cultured colonies and
understanding their intercellular interactions. The focus of this
initial study is to determine the frequency of gap junction protein
complexes as a function of various treatments. For more information: Examples of low dose radiation studies Click on the image to see a 360 degree view of the dataset. Bahram Parvin, Staff Scientist, LBNL |
| Computational Astrophysics | |
 |
Simulation of the collapse of iron cores in the explosion of
a supernovae. The image represents the entropy values during a
particular timestep of a supernova formation. Salil Akerkar, University of Arizona |
 |
There is mounting evidence that galaxy interactions play an
important
role in galaxy evolution. Elliptical galaxies, spiral bulges, and a
significant fraction of all the stars in the universe may be
byproducts of galaxy mergers, especially mergers at high redshift.
Hydrodynamical simulations of galaxy interactions have given evidence
of the role mergers play in galaxy evolution, but the galaxies used in
these simulation have primarily been of equal mass, with low gas
fractions typical of spiral galaxies in the local universe. In order
to better understand the roles mergers play in galaxy evolution we are
using high resolution simulations, including hydrodynamics and star
formation, to investigate the full parameter space of pre-merger
galaxy properites and interaction parameters. A main goal of our work
is modeling the star formation rates and the morphology of
interacting galaxies in various wavelengths.
Time evolution MPEGs of Gas stars with sfr > 0 zoomed, zoomed with a reference grid, not zoomed. Time evolution of all Gas
stars MPEG . Time
evolution of the trayectories of stars
MPEG . J. Primack, Thomas Cox, UCSC more images |
  |
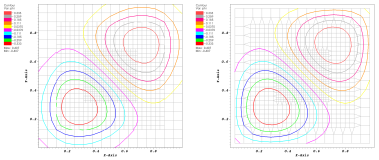
These figures show a spectrum synthesis calculation of a
supernova atmosphere
surrounded by a toroid. The layout of the atmosphere is presented on
the
right while at the left we have a graph of the flux vs. wavelength vs.
viewing
angle (Figure A) and of the polarization vs wavelength vs. viewing
angle
(Figure B). For viewing angles where the toroid obscures the underlying
atmosphere, a strong absorption feature appears in the flux spectrum.
Observations
of such a feature allows one to determine the 3-dimensional geometry of
the
supernova ejecta, and hence put strong constraints on the progenitors
and
explosion physics of Type Ia supernovae. Flux as a function of viewing angle MPEG. Polarization as a function of viewing angle MPEG. P.Nugent, D.Kasen, LBNL more images |
| Materials Sciences | |
| Surface Physics. S.Tomassone, Rugters University more images |
|
| Earth Sciences | |
 |
Montmorillonite is a common clay mineral with a layered
structure and a range
of permanent negative charge which allows cations and water molecules
to
enter the space between clay layers, also known as the interlayer.
Click
on the image to see a 50 ps portion of a molecular dynamics simulation
of
the interlayer region of Cs-montmorillonite. More information. R.Sutton and G.Sposito, UC Berkeley |
2001
 |
This figure shows three electron microscope images of DNA
toroids accompanied by computer simulations of toroids in corresponding
orientations. This work is motivated by interest in the behavior of
DNA, which is sometimes naturally packed into toroidal arrays, and has
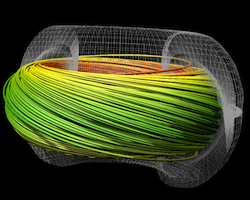
application for DNA packing in genetic therapies. More information. Ken Downing, Life Sciences Division |
 |
This image shows a 3-D reconstruction of an intact
microtubule, obtained using cyro-electron microscopy and image
processing at a resolution of about eight Angstroms. Microtubules play
fundamental roles throughout the life of eukaryotic cells. More information. Ken Downing, Life Sciences Division |
 |
The nonlinear Schrodinger equation (NLS) is a ubiquitous
equation that naturally arises in weakly nonlinear systems whose wave
dispersion relation is also a function of amplitude. It is an ideal
testing ground for quantum lattice gas algorithms because exact
solutions are known for the NLS equation. In particular, some of these
exact solutions are solitons - nonlinear localized wavepackets that
retain their identity even after collisions with other wavepackets.
Click on the image to see the time evolution of two soliton-like intial
conditions under the NLS equation with potential V = |psi|. The two
solitons are unstable and break up resulting in coherent
structures(solitons) interacting with a turbulent sea of very small
amplitude solitons. The collisions of the coherent structures do not
destroy these structures. George Vahala, Physics Dept., William & Mary |
 |
The LEDA experiment is an experiment at Los Alamos National
Laboratory to study the generation of halo particles in a periodic
transport system. These images and the movie clips: rotating view of a
time step MPEG, time evolution MPEG, show the particle phase space
(i.e. particle positions and transverse velocities), computed using
IMPACT, for the beam propagating in the LEDA Halo Experiment. The
colorbar shows the encoding of the magnitude of the velocities. More information. R. Ryne and J.Qiang, LBNL |
 |
Electron-Atom and Electron-Molecule Collision Processes.
Click here
for more information. C. William McCurdy et al. |
2000
 |
This 28 MB movie shows a time-evolving visualization of a numerical Tokomak simulation. (We found this movie in the dust bin, and are unable to provide appropriate citation information. If you know something about his work, please let us know and we'll provide the appropriate citation.) It was most likely computed by a research from the Princeton Plasma Physics Laboratory on a NERSC machine, with visualization performed by the LBL/NERSC Visualization Group. |
| |
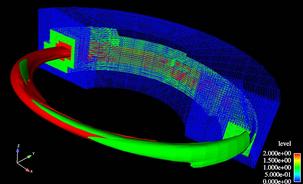
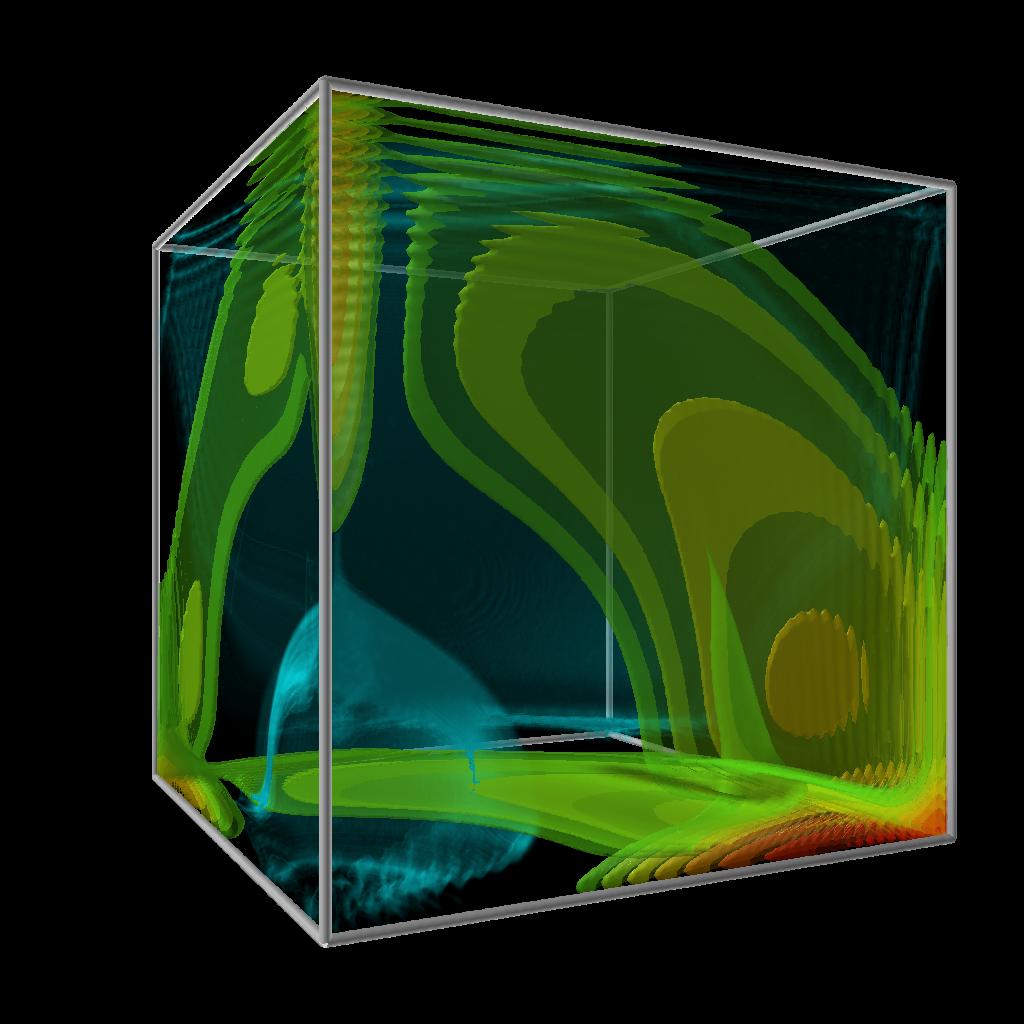
Visualizing the
Interactions of Two Fluids, The goal was to develop a tool to view
two interacting fluid
species at one time for a NERSC user at the College of William &
Mary.
The final product was to create movies so that the time
dependent nature could be studied.
The final tool was written in IDL and the tool and documentation
was released to the user.
Some examples movies are:
George Vahala, Physics Dept., William & Mary |
1999
 |
Semi-local cosmic string simulation performed at NERSC. More information. Julian Borrill, NERSC |
| |
An understanding of Cs-smectite systems is necessary to
predict the
permeability of clay liners at nuclear waste containment facilities to
137-Cs radioactive waste. More
information. Rebecca Sutton, UCB, and Gary Sposito, UCB/LBNL |
1998
 |
This image, which appeared on the cover of Forbes ASAP
magazine in 1998, shows the "data fusion" resulting from visualization
of simulated and theoretical protein models. Using high performance
visualization tools and Virtual Reality interfaces, we explore model
rectification and comparison. More
information. Ken Downing, UC Berkeley and LBNL. |
 |
The overall goal of this visualization is to highlight the differences between "layers" of molecular movement. In particular, molecules closer to the surface (towards the top of the picture) appear to move more than those further away from the surface (lower in the picture). More information. |
 |
More information. |
 |
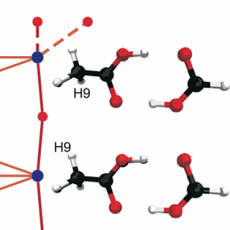
These images show a theoretical chemical reaction: the
dehydrogenation of ethylene. Two H atoms are removed from the ethylene
C2H4 molecule upon interaction with a substrate of Nickel. More information. Michel Van Hove, Lawrence Berkeley National Laboratory |
 |
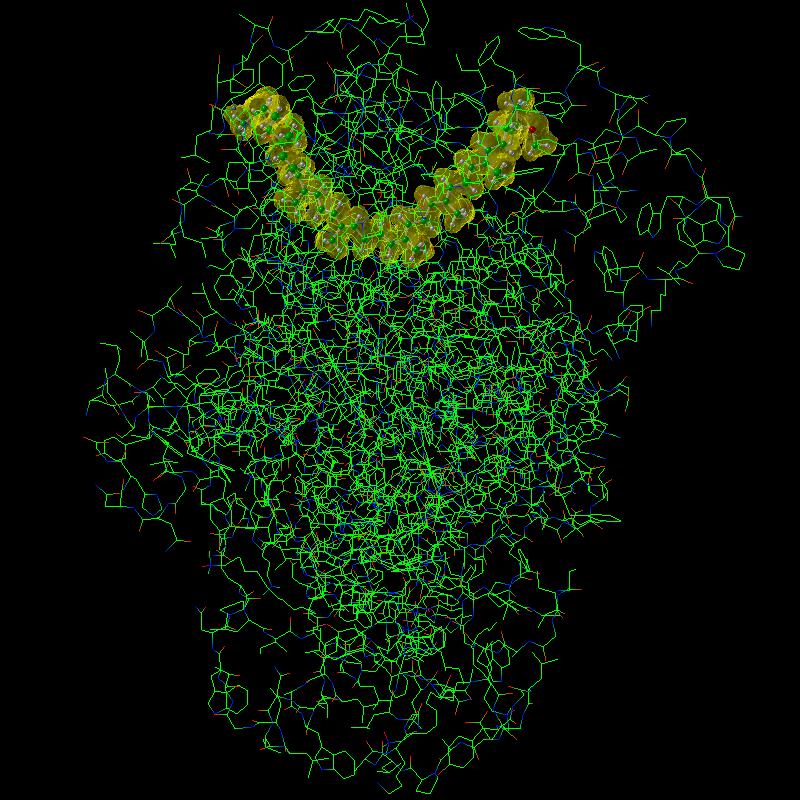
Researchers at Northwestern University are studying the
enzyme beta-lactamase. Specifically, the research is focused upon
uncovering the specific molecular mechanisms employed by the enzyme to
hydrolyse penicillin G, thus rendering it biologically inactive. More information. Paul Bash, Northwestern University |
1997
 |
This project focused on visualization of quantum physics
simulation
data generated on the (then) new Cray T3E at NERSC. More information. G. Kilcup, The Ohio State University. |
|
 |
In a 1997 LDRD, Karsten Pruess (Earth Sciences Division,
LBNL) and George Brimhall (Geophysics, UC Berkeley) studied and modeled
geophysical and geochemical processes that resulted in an ore body of
particular interest in the desert of the Andes Mountains in the El
Salvador district of Chile. The images presented on this page show a
collaboration with the Visualiztion Group. More information. K. Pruess, LBNL and G. Brimhall, UCB. |
|
 |
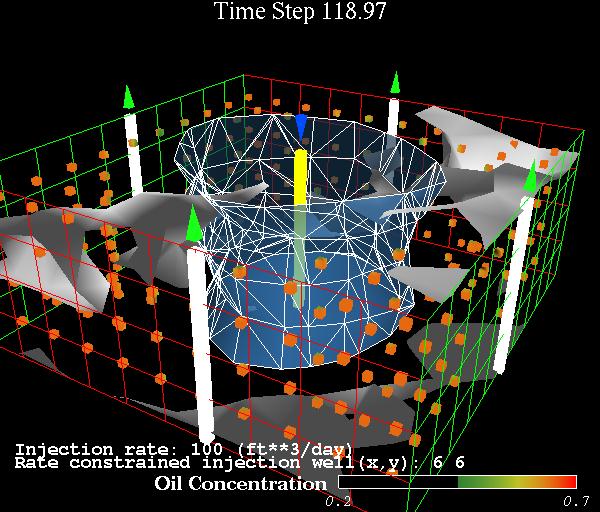
Reservoir characterization involves predicting production.
Production is a function of geophysical and geochemical parameters.
Typically, these parameters are estimated from samples. The challenge
is better predictions of these unknowns, as well as better tools for
calculating production given a set of parameters. Two separate projects
were demonstrated at Supercomputing 1997 in San Jose, CA. More Images. Don Vasco, Earth Sciences Division, LBNL. |
|
 |
Spring 1997: The VisGroup is working with scientists in ESD
to create a visualization showing the Yucca Mountain storage facility.
This visualization integrates divergent types of data, and will be used
to ask "what if" questions pertaining to water flow through the site.
Look for this model soon in in LBNL's Washington DC office. More information. Mark Feighner, Earth Sciences Division, LBNL. |
|
 |
Material Science research relies heavily on the use of
Nuclear Magnetic Resonance (NMR) to study materials. Researchers at
LBNL and UC Berkeley are working with the Visualization Group to
explore the results of computer simulations of NMR physics run on the
NERSC T3E. More information. Bernd Pfrommer, UCB/LBNL. |
|
 |
Radiation damage to DNA and the repair thereof is being
investigated at LBNL by the Department of Radiation Biology and DNA
Repair in the Life
Sciences Division. Data sets contain tens of thousands atoms are
generated. Hierarchical methods of visualization are being investigated
on these data sets. More information. Saira Mian, Bill Holley, Life Sciences Division, LBNL |
|
| |
Reservoir characterization involves predicting production.
Production is a function of geophysical and geochemical parameters.
Typically, these parameters are estimated from samples. The challenge
is better predictions of these unknowns, as well as better tools for
calculating production given a set of parameters. Two separate projects
were demonstrated at Supercomputing 1997 in San Jose, CA. More Information. Don Vasco, Earth Sciences Divsion, LBL |
1993-94
 |
Our earliest work in combining scientific visualization, virtual reality and scientific computing occured in late 1992 and early 1993 with researchers from LBL's Earth Science Division. More information. |