[an error occurred while processing this directive]
Visualization Group Gallery - On Display at LBNL
The following images appear on display outside the Visualization
Laboratory at LBNL. Using a patented technology,
these PHSColograms by (Art)n Laboratory
produce a stereo-like effect when viewed.
Follow this
link
to an (Art)n gallery page including images generated by LBNL/NERSC for
Supercomputing '98.
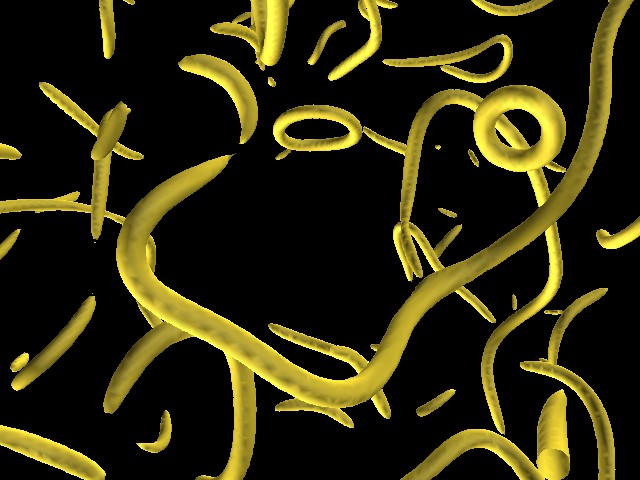
Semilocal Strings
Ten to 35 seconds after the Big Bang, objects called "semilocal strings"
may have condensed out of interacting quantum fields. Some strings
linked with other strings into space-spanning filaments. Others
joined head to tail and shrank away to nothing. Semilocal string
theory may help explain how the universe developed "lumpy" structures
like stars and galaxies despite its perfectly homogeneous beginnings.
Acknowledgement
Lattice Gauge Theory
Computations suggest that the quarks which compose protons are
confined in space. How they are confined determines the size of
protons which are a fundamental part of all atoms. We show a single
three dimensional slice of a four dimensional space depicting the
probable location densities using colored volumes and surfaces. Such
visualization techniques allow researchers to explore and understand
the results of their complex computations done on supercomputers. The
underlying computations were accomplished using NERSC's 128 processor
Cray T3E supercomputer.
A 65-frame
MPEG Movie
showing camera movement (45kbytes).
Acknowledgement
Petroleum Reservoir Engineering
Petroleum reservoir simulators are software tools that permit reservoir
engineers to evaluate the results of different production strategies. The
simulators compute, among other things, oil saturation and flow over time.
By using Virtual Reality technology, engineers can interact with a
visualization tool the computes the path taken by weightless particles
released into an oil flow field along the depth of a virtual well.
A 65-frame MPEG Movie showing
camera movement (572 kbytes). Or, here's one that's a
little smaller (194 kbytes).
Acknowledgement
Funded by ACTI (Advanced Computational Technology Initiative) through ER-LTT
(Energy Research and Laboratory Technology Transfer).
- Industrial Partners:
- Andy Austin and Mark Lederer, BP Exploration, Houston Texas.
- Todd Little, Landmark Graphics Corporation, Houston Texas.
- Visualization: The LBNL/NERSC Visualization Group
Shock Wave Physics
Dramatic and complex structures evolve as a shock wave passes through two
gases. As a shock wave passes from oxygen (below) into helium (above), the
gases mix in such a way that long spikes of oxygen penetrate into the
helium. Mixing is represented with orange, while the velocity of the
mixing process is visualized using yellow streamlines. Researchers at the
Center for Computational Sciences and Engineering at LBNL use visualization
tools to examine and gain insight into physical processes modeled on
supercomputers.
A 65-frame MPEG Movie showing camera movement (410 Kbytes).
Acknowledgement
- Science:
- William Crutchfield, Center for Compuational Sciences and Engineering, LBNL.
- Jeff Greenough, Center for Compuational Sciences and Engineering, LBNL.
- Visualization: The LBNL/NERSC Visualization Group
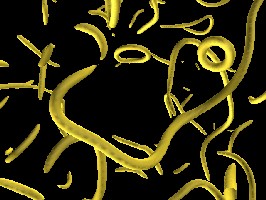
Life Sciences
Actin, a protien, is a major component of muscle. Muscles are formed from
millions of fibers, which in turn are built from protien molecules. One
represenation of the actin molecule is the structural backbone, which shows
the bonds between atoms using a "stick" model. A different representation
of actin is electron density. We show electron density at two different
resolutions. The brown surface is a high resolution surface obtained by
X-Ray crystallography. The blue surface is computed from a simulation
where the resolution has been artificially reduced. The purpose of the
visualization is to aid in interpreting experimental data that is limited
in resolution. Researchers make use of visualization tools to verify that
structures apparent in lower resolution data correspond to structures in
higher resolution data.
A 65-frame MPEG Movie (86 Kbytes).
Acknowledgement
[an error occurred while processing this directive]