SC02 Visgroup Demos
Official Demos
Unofficial Demos
Astrophysics
Black Hole Collision Simulation
Researchers at the Albert Einstein Instititute/Max Planck Institut for Gravitationphysics in Potsdam Germany used NERSC's 5 Teraflop SP2 system (seaborg) to simulate the inspiralling collision of two black holes in 3D using the Cactus code to directly evolve Einstein's Equations. Ed Seidel, leader of that research group, and his team will describe the results of this feat and its importance in the context of emerging gravitational wave observatories in the US and Europe. They and the LBNL Visualization group will demonstrate a variety of remote visualization tools, such as Visapult, (or Visapult 2.0) that enable such large scale calculations to be analyzed rapidly by research groups distributed around the globe. This demonstration will also be part of the an SC2002 Bandwidth Challenge entry where this code will be visualized and steered live by the LBNL Visapult remote visualization tool.
Scince: Ed Seidel, AEI/Max Planck Institute -- Potsdam
Demoee: Ed Seidel
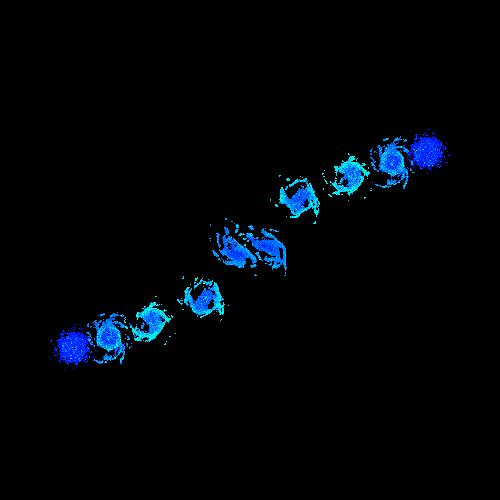
Galaxy Formulation Simulations
There is mounting evidence that galaxy interactions play an important role in galaxy evolution. Elliptical galaxies, spiral bulges, and a significant fraction of all the stars in the universe may be byproducts of galaxy mergers, especially mergers at high redshift. Hydrodynamical simulations of galaxy interactions have given evidence of the role mergers play in galaxy evolution, but the galaxies used in these simulation have primarily been of equal mass, with low gas fractions typical of spiral galaxies in the local universe. In order to better understand the roles mergers play in galaxy evolution we are using high resolution simulations, including hydrodynamics and star formation, to investigate the full parameter space of pre-merger galaxy properites and interaction parameters. A main goal of our work is modeling the star formation rates and the morphology of interacting galaxies in various wavelengths.
 |
Science: Joel Primack, UCSC
Demoee: Ken Schwartz, LBNL/NERSC
Demo Created by: Cristina Siegerist, LBNL/NERSC
Computational Physics
SciDAC Advanced Computing for 21st Century Acclerator Science and Technology
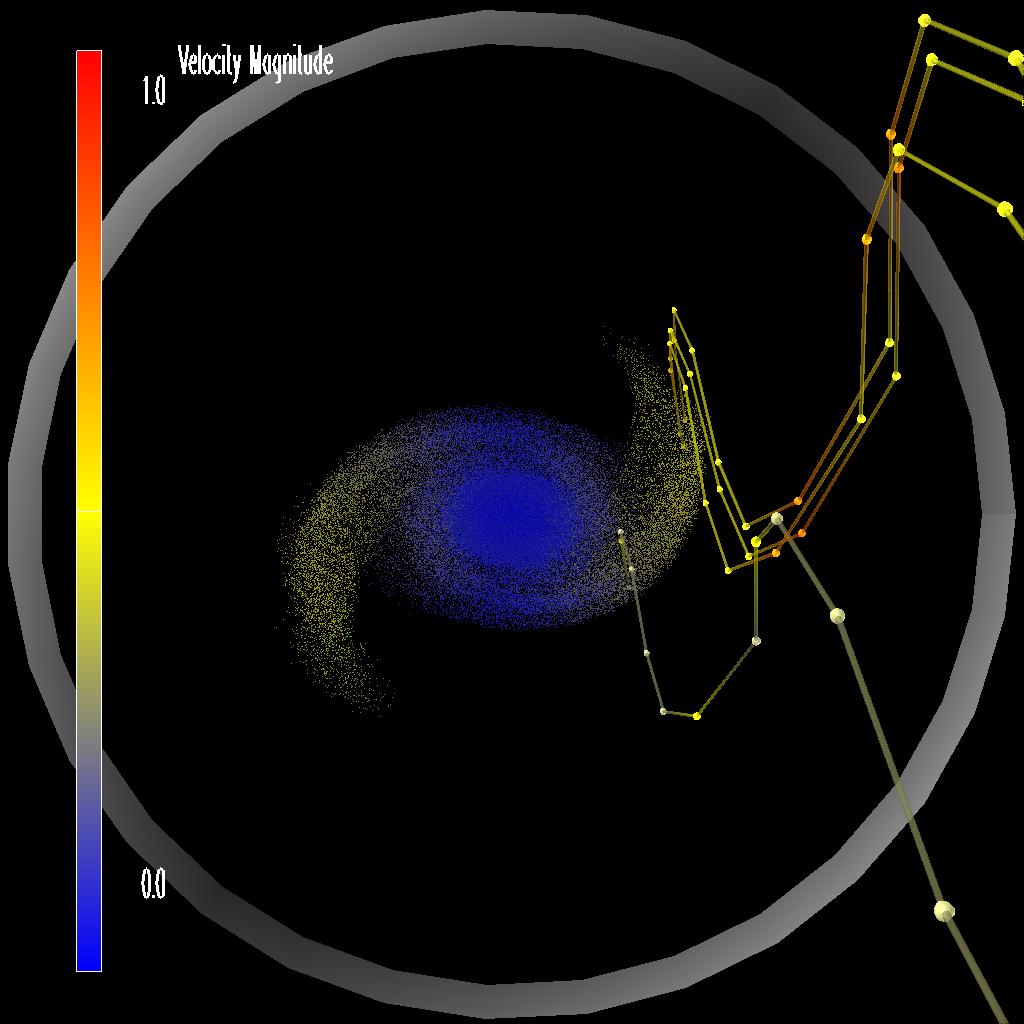
Title:Accelerator Modelling.Simulation showing the evolution of a high intensity beam in a cyclotron. The simulation exhibits the phenomenon of halo formation which can occur when a beam is improperly injected. This visualization starts at the end of the beamline, and halo particles are tagged and tracked backward to determine their points of origin. Such simulations and associate visualizations provide insight into the halo formation mechanism in high intensity beams. Six dimensional phase space data (x, px, y, py, z, pz) plus the unique particle identification with geometry information was stored for each timestep of the simulation.
An AVS-Express application allows the user to select particles at any timestep and to track them along their trayectories while displaying context information of the rest of the particles and the beam line.
 |
Science: Andreas Adelmann, LBNL/NERSC.
Demoee: Ken Schwartz, LBNL/NERSC.
Demo Created by: Cristina Siegerist, LBNL/NERSC.
Computational Biology
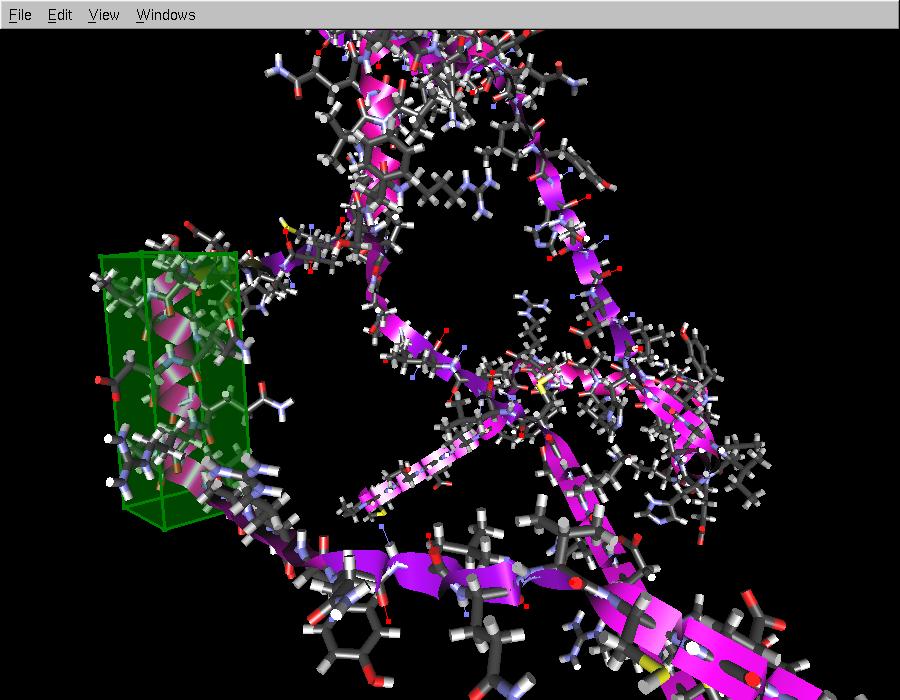
Interactive Manipulation of Protein Structures
Protein folding, the prediction of a protein's native shape from its DNA sequence alone, is one of the grand challenges of computational biology. In recent years, progress has been made in treating protein folding as a global optimization problem - it is widely believed that a protein's native shape is the one that minimizes internal energy. We demonstrate "ProtoShop", an interactive tool that allows creating initial configurations for subsequent global optimization, and that can be used to remotely monitor and steer the optimization's progress.
 |
Demoee: Oliver Kreylos, UCD & LBNL/NERSC.
Science: Silvia Crivelli, LBNL/NERSC & UCB.
Grid-based Visualization Portal
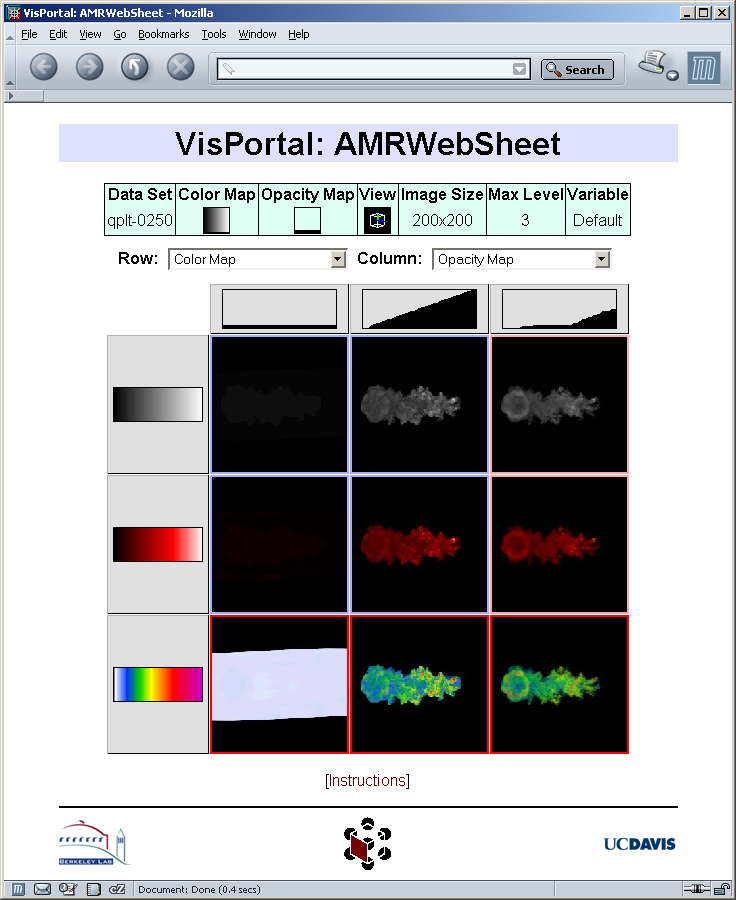
Visualization Spreadsheets - Visual Tools for Web-based Data Exploration Over the Grid
We discuss a web-based portal for the exploration, encapsulation, and dissemination of visualization results over the Grid. This portal integrates three components: an interface client for structured visualization exploration, a visualization web application to manage the generation and capture of the visualization results, and a centralized portal application server to access and manage grid resources. We demonstrate the usefulness of the developed system using an example for Adaptive Mesh Refinement (AMR) data visualization.
 |
Demoee: TJ Jankun-Kelly, UCD & LBNL/NERSC; Oliver Kreylos, UCD & LBNL/NERSC.