This is an archival copy of the Visualization Group's web page 1998 to 2017. For current information, please vist our group's new web page.
Visualization of Laser Wakefield Accelerator Simulations
Table of Contents
- Introduction
- Development of a VisIt Database Reader
- Images of the Current
- Next Steps
- References
- There are visualizations of the electric, density, and particle fields on the SC06 page for this project.
Introduction
Plasmas are not subject to the electrical breakdown that limits conventional particle accelerators, and Laser Wakefield Accelerators (LWFA's) have demonstrated accelerating gradients thousands of times those obtained in conventional accelerators using the electric field of a plasma wave (the wakefield) driven by the radiation pressure of an intense laser. Plasma based accelerators hence offer a path to more compact machines for high energy physics, and also to high current ultrashort electron bunches which may revolutionize applications of accelerators to radiation sources and applications in chemistry and biology. The plasma interaction in this regime is fully nonlinear, and particle distribution effects are important, making simulation essential but extremely challenging.
Experiments at LBNL demonstrated for the first time the production of high quality electron beams for the first time in a high gradient laser wakefield accelerator (high quality beams also were reported at the same time at RAL/Imperial and LOA). This was achieved at LBNL by extending the interaction distance using a pre-formed plasma density structure, or channel, to guide the drive laser pulse over many diffraction ranges [1]. Initial experiments produced beams with several billion electrons above 80 MeV energy with percent energy spread and low divergence [1], and experiments this year have extended the bunch energy to 1 GeV [2]. Such beams allow laser-plasma accelerators to be considered seriously as alternatives to conventional accelerators for a wide variety of applications that demand high-quality electron bunches, making simulations to understand their behavior imperative.
The INCITE7 project has enabled researchers to run three-dimensional simulations of a few select cases, clarifying mechanisms of beam formation and evolution as well as laser driver behavior, and has begun to identify potential optimizations to improve performance. The large-scale three-dimensional simulations show important differences in trapping and beam evolution compared to previous two dimensional simulations. Detailed two dimensional runs are also being done to carefully understand convergence and parameter optimization. Examples of the current field from recent simulations are shown below.
Initially, we wrote an AVS/Express reader for the HDF5 field and particle data for 2D simulations. This work is described on the SC06 page this project, which shows examples of visualizations done with AVS/Express. Initial tests using AVS/Express showed that the datasets are too big to do volume rendering on a 'normal' AMD-64 workstation with 8GB of memory. The next step was to partition the data for parallel processing using VisIt. This work also is described on the SC06 page.
Development of a VisIt Database Reader
Recently, TechX Corporation has developed a suite of VisIt database readers (aka "plugins") for simulation codes used by the accelerator and fusion community. Starting with the TechX plugin for VORPAL, we modified it slightly to work with existing VORPAL simulations that do not conform to the new data format standards proposed by TechX. Using a VisIt plugin to read the simulation results directly into VisIt saves having to convert VORPAL output to vtk format (VisIt's native format), which results in the generation of many, large intermediate files.
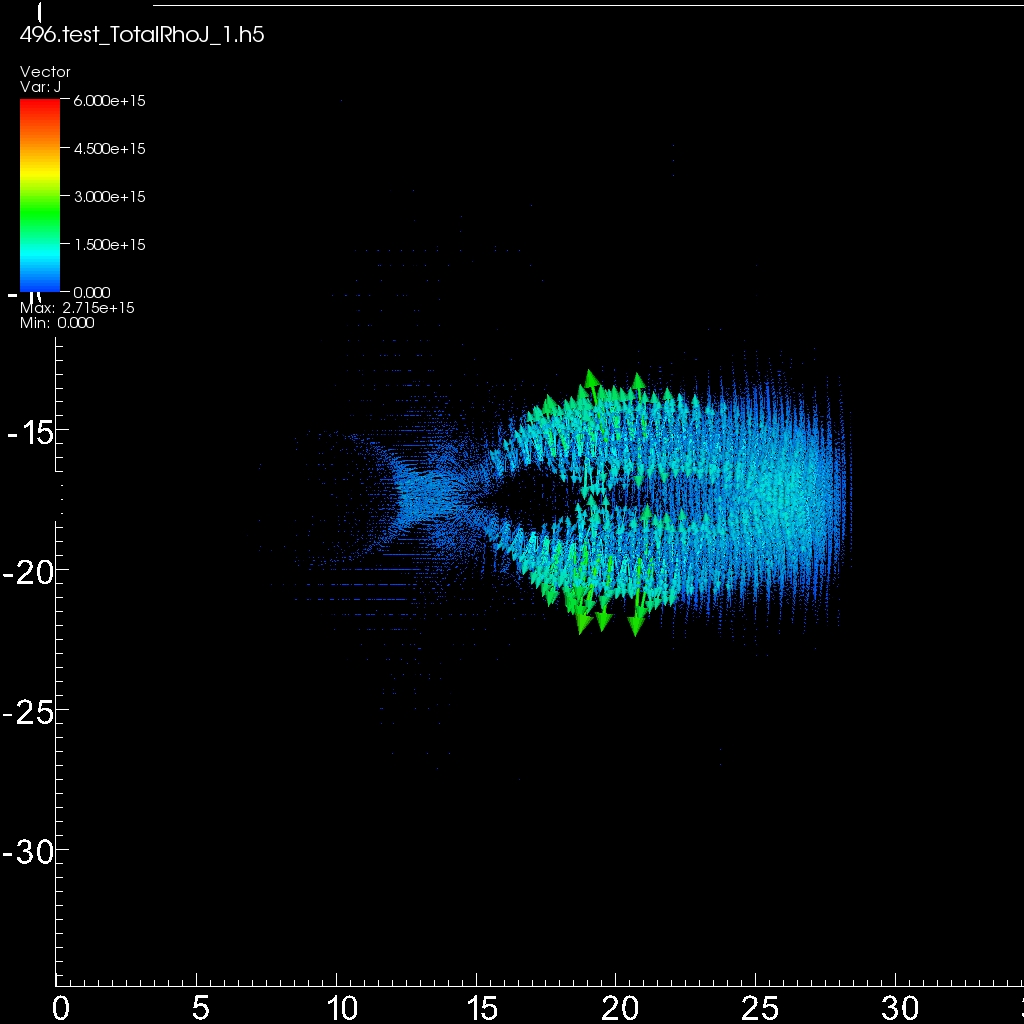
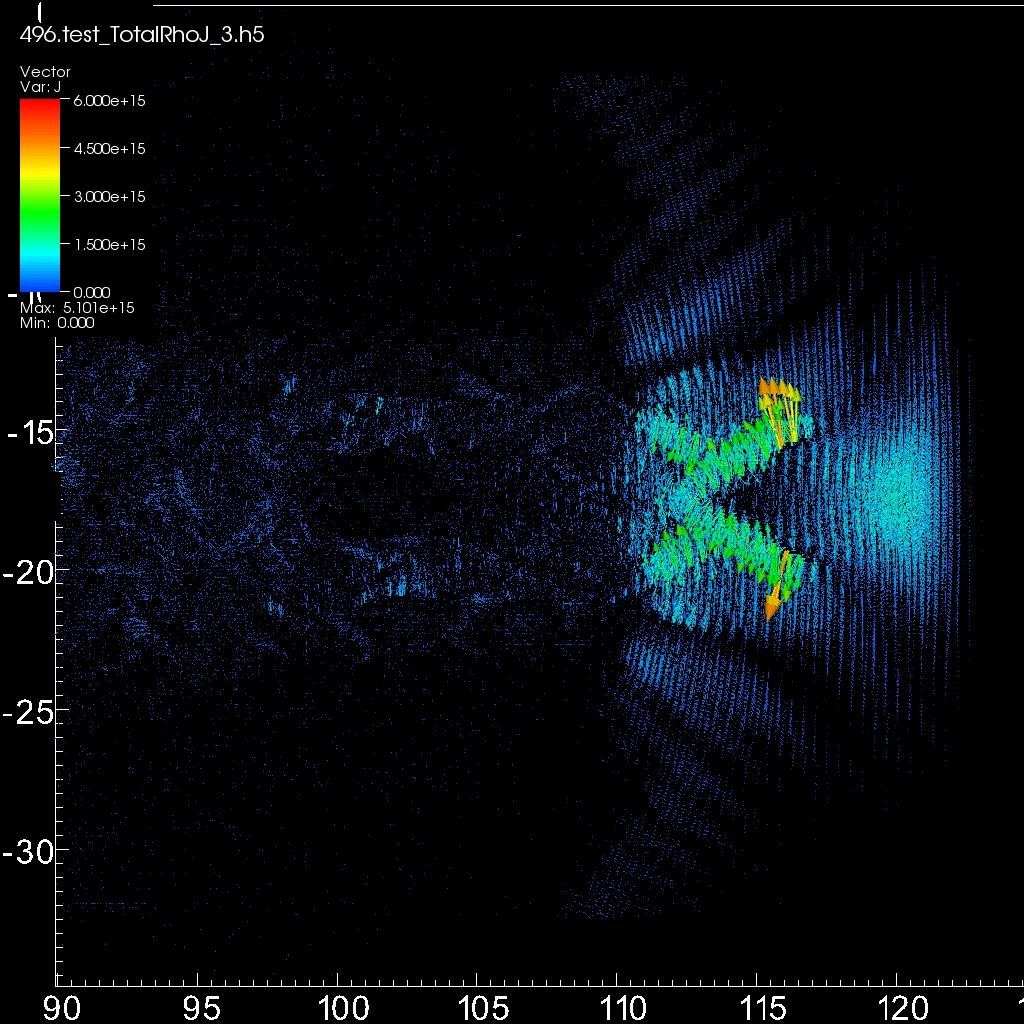
Images of the Current
The images below show the current from four early times steps from a 2D simulation. In the first four images, the vectors are colored and scaled by magnitude; the data range is fixed to be the same for these images. While the evolution of the field is clear from these images, it is difficult to tell whether the field is symmetric. Click on an image to see a higher resolution version.
|

|
|
|

|
|
|
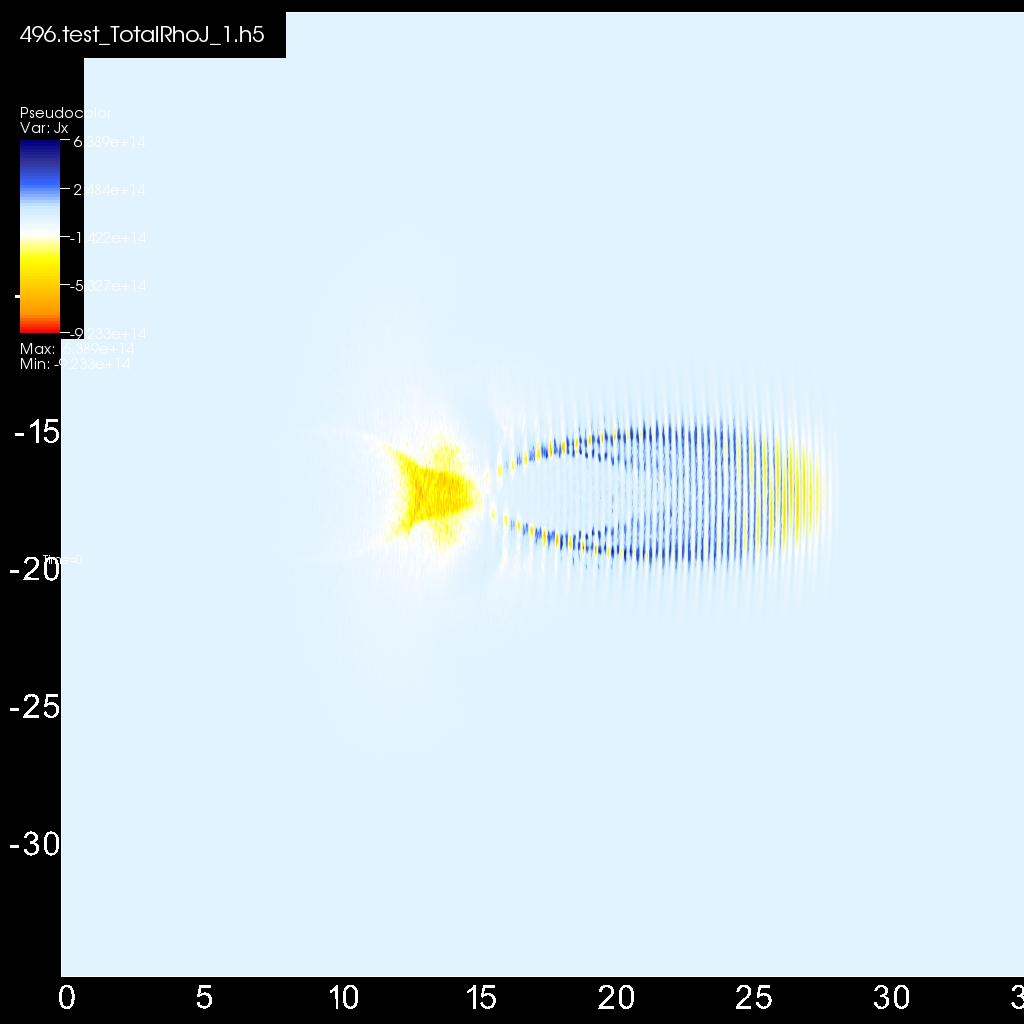
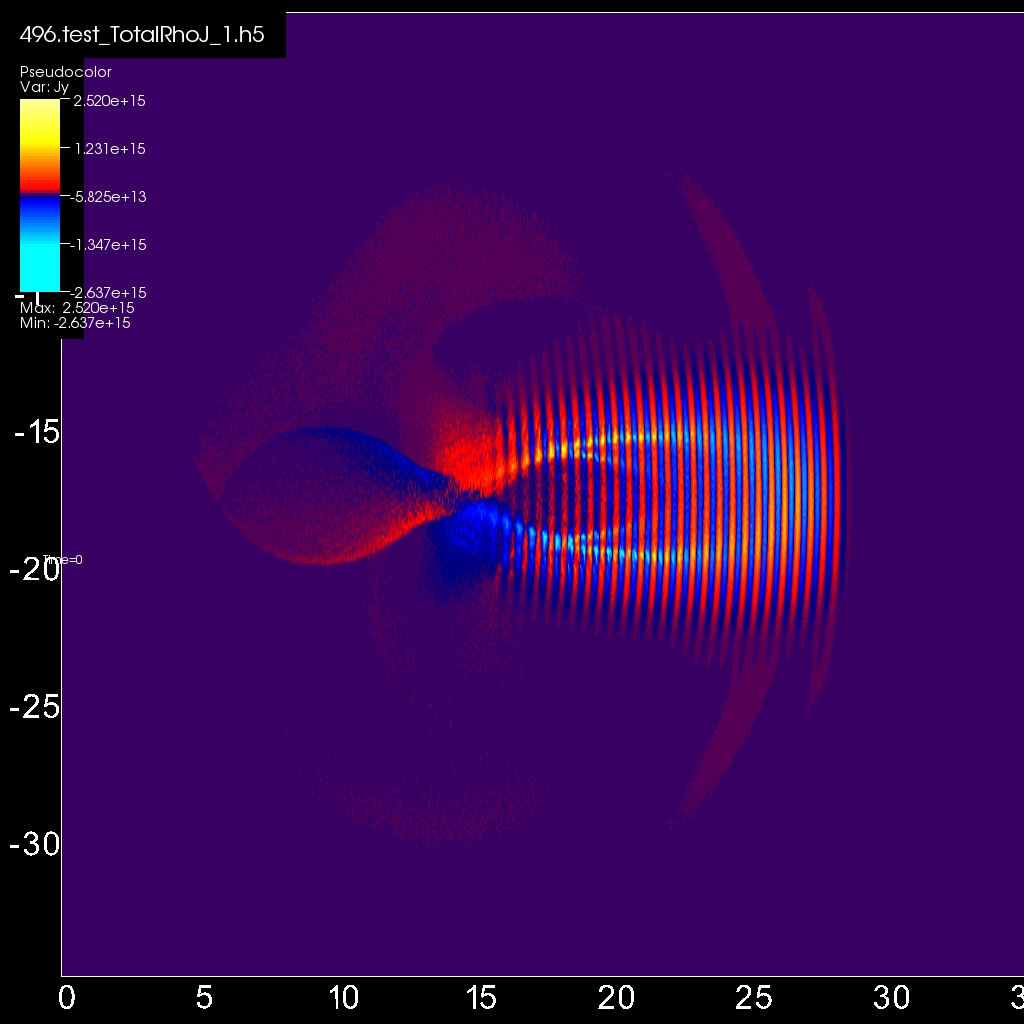
The two images below show the x and y components of the
current. The asymmetry in Jy is clear from the
second image. Note that different color maps were used for these two images
in order to enhance the structure in the field.
Click on an image to see a higher resolution
version.
|
||
|
|
|