Drosophila Gene Expression Data Exploration and Visualization
Table of Contents
- Introduction
- What is gene expression and why is it important
- Data- and Visualization Pipeline
- Previous Work
- PointCloudXplore: Interactive 3D Visualization
-
3D Gene Expression Surface Graphs
- Discussion and Next Steps
- References
Introduction
Together with the Berkeley Drosophila Transcription Network (BDTNP) we have developed PointCloudXplore, a tool aimed at helping biologists to understand the relationship between expression patterns of genes in three dimensions. As part of this project, novel 3D point cloud data sets are created from 3D confocal microscopy images containing information about gene expression in fruit fly embryos at cellular resolution. To support analysis of these high dimensional data sets, PointCloudXplore integrates multiple views to ease analysis of complex gene expression data. Each view emphasizes different data properties, and interaction between the views makes it possible to perform detailed analyses of the presented data. This type of interaction blends high-dimensional information exploration with interactive, 3D visualization.
What is gene expression and why is it important
The genetic information needed to create and maintain an organism is stored in strands of deoxyribonucleic acid (DNA). The DNA itself is subdivided into functional subregions the genes. Genes itself are not responsible for executing any function in a cell but they are coding for proteins. In the transcription process genes are copied into mRNA. Afterwards the genetic information of the gene, which is now available in the mRNA, is used in the translation process to produce protein. Gene expression therefore can be defined as the amount of protein produced using the genetic information stored in a gene. Proteins now are involved in practically every function performed by a cell e.g. as enzymes, structural proteins or as regulatory proteins which are responsible for regualtion of gene expression. In this way complex genetic regulatory networks are build up. Genetic regulatory networks are also responsible for guiding the developmental process of any organism.
The goal of the BDTNP is to decipher how the patterns of gene expression underlying animal development are directed by the regulatory information contained in DNA sequences. To achieve this goal the fruitfly ( Drosophila Melanogaster ) has been chosen as model organism. For more detailed information about the development of Drosophila Melanogaster see e.g.: http://flymove.uni-muenster.de/Data- and Visualization Pipeline
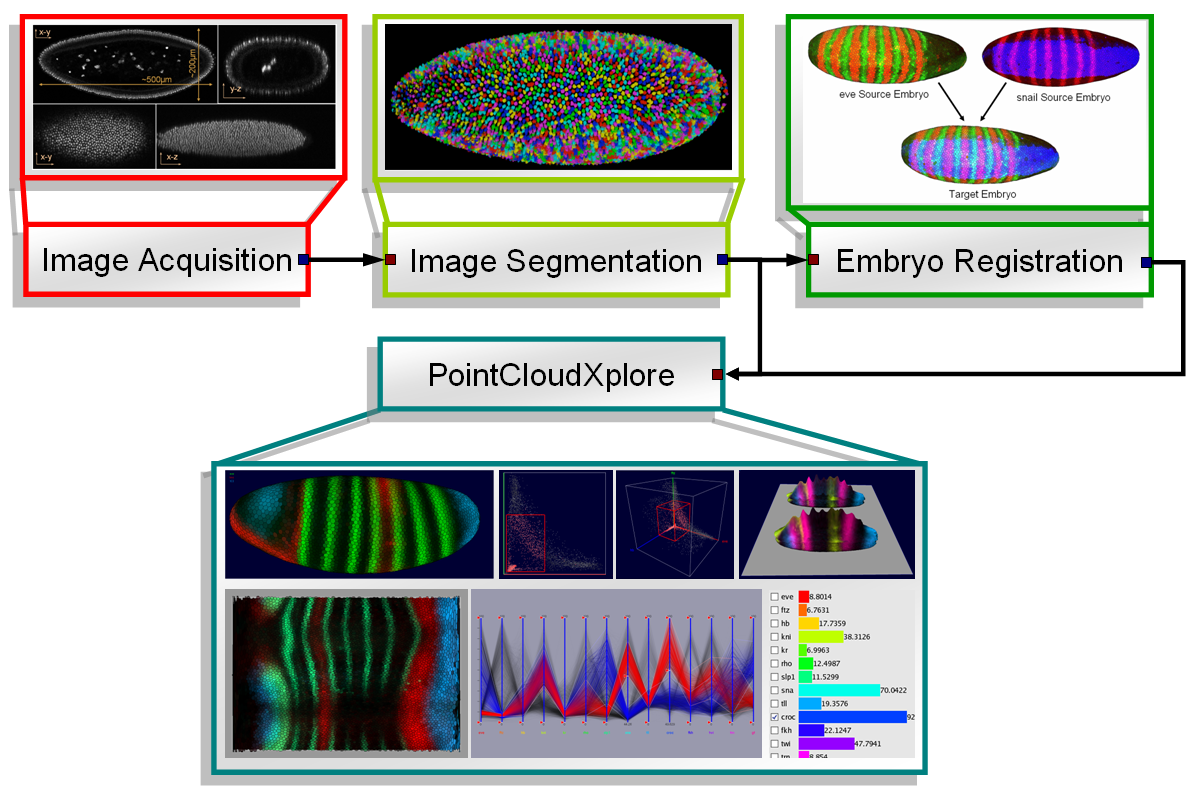
As part of the BDTNP 3D pointcloud datasets are produced. Such pointcloud datasets can be interpreted as 3D matrices describing the relative concentration of gene product, e.g. RNA or protein, in each cell. The creation-process of pointcloud datasets can be divided in three major steps. The first step is the actual image acquisition where Drosophila embryos are imaged by confocal microscope. Afterwards the created images are segmented to extract cell positions, cell and nucleus volume, surface normals and gene expression data. The result of the segmentation process are so called raw pointcloud datasets containing data gathered from one single embryo. Since the used confocal microscope operates with three laser channels it is possible to measure expression values of up to three genes per embryo. Since in general one channel is used for detection of cell/nucleus position, only two genes can be measured per embryo. Because of this, in the third and last step raw pointcloud datasets are used to generate virtual pointcloud datasets containing expression values of many more genes. PointCloudXplore is then used to visualize both raw- and virtual point cloud datasets.
|
|
|
Figure1: Data- and Visualization Pipeline |
Previous Work
Up to now studies of animal gene expression patterns have not captured 3D context. The 3D point cloud datasets described above contain information about gene expression on cellular resolution. Such information have never been available before in such detail and quality. Available visualization tools are not sufficient for comparing and analyzing the generated 3D pointcloud datasets. PointCloudXplore is a tool specially designed for visualization of 3D gene expression data in early stage embryos of Drosophila Melanogaster. Many diffrent views and interactive interaction with the data open a way to interactive data analysis like it was never possible before in this specific area of research.
PointCloudXplore: Interactive 3D Visualization
PointCloudXplore is based on two simple but powerful basic principles. Multiple views allow to view the data from different perspectives without being overwhelmed by the high dimensionality of the data. Each view emphasizes different data properties and the interplay between all views makes detailed data analysis possible. The second basic principle is called Brushing&Linking. Brushing refers to the fact that the user can select parts of the data according different data properties in all views. Selected data parts are then highlighted visually in all data displays. In this way all views are linked together. Linking simply means that it is possible to identify visually which parts of one data display correspond to that of another one.
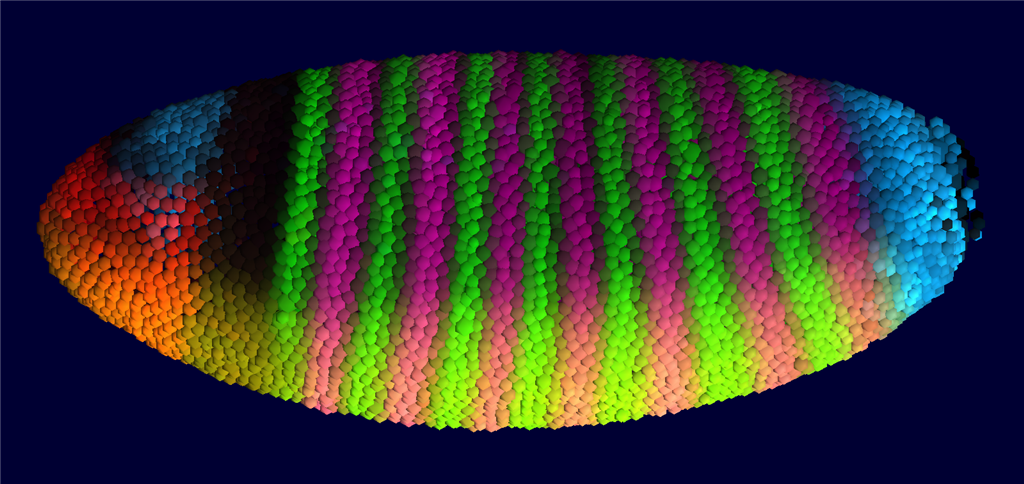
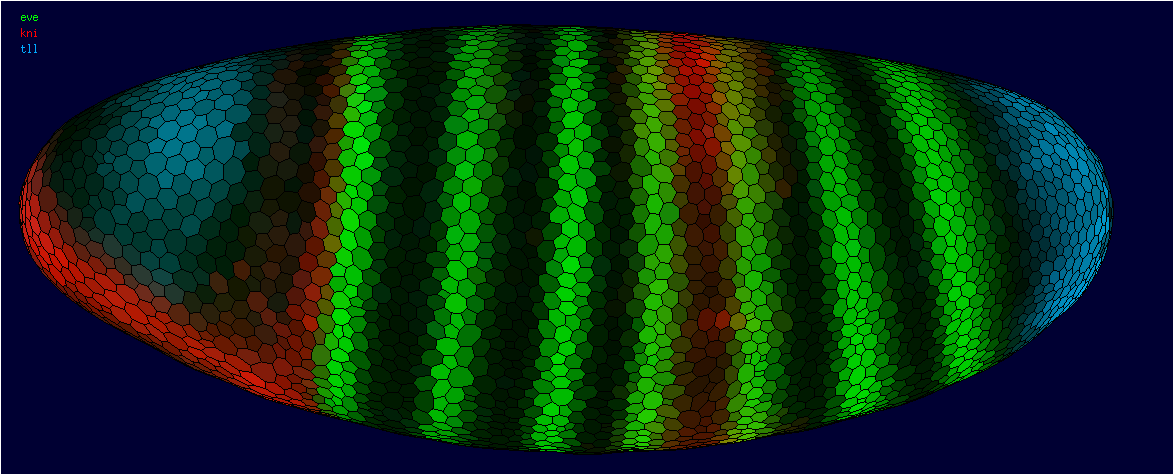
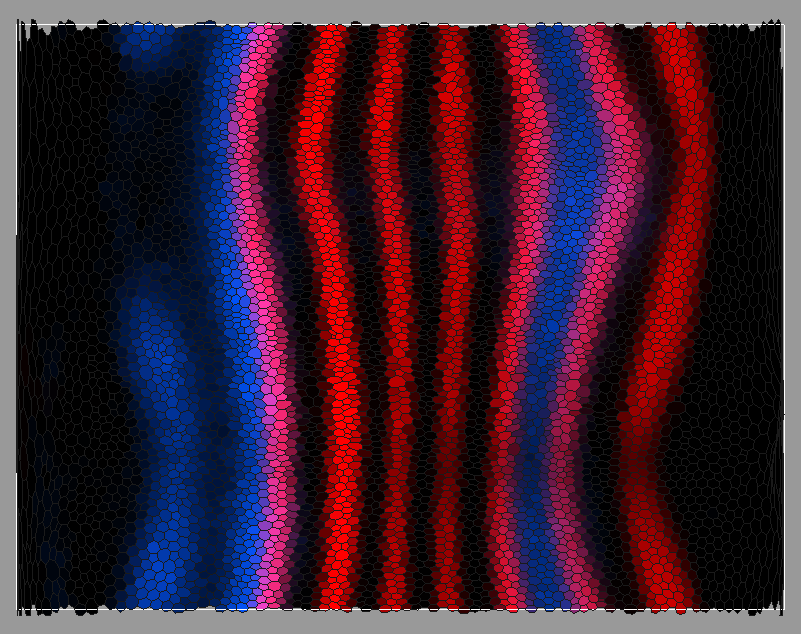
Several models of the embryo have been created to allow analysis of spatial gene expression pattern. Each cell is represented by one 3D graphical object positioned in space according the physical position of the cell it represent. Gene expression values are then visualized using color. In addition to 3D embryo models also 2D embryo views have been created to make it possible to look at all cells in parallel. Cells of interest can be selected in any of these views just by drawing on the surface of the embryo using the mouse cursor. Selected data parts are highlighted using color.
|
|
|
|
|
|
Figure2: Sphere View |
Figure3: Cell View |
Figure4: Unrolled View |
Figure 5: 2D Projection View |
3D Gene Expression Surface Graphs
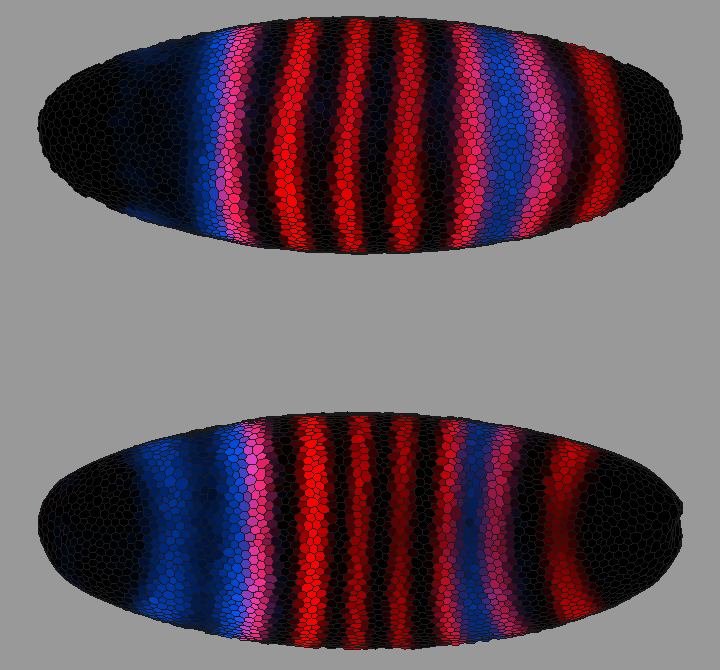
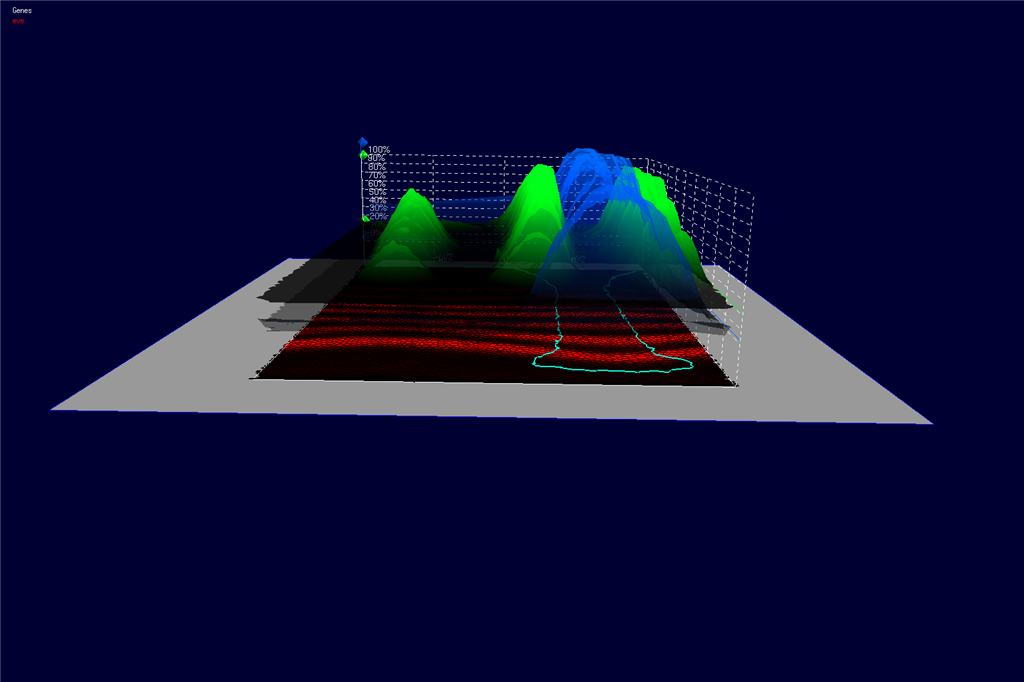
3D graphs defined over the 2D embryo views allow qualitative and quantitative analysis of gene expression data. The x/y position of surface points are determined by the position of cells in the underlying 2D embryo view whereas the height of a gene expression surface is determined by the expression values meassured for the gene it represents. By looking at several gene expression offset surfaces at once relationships between genes can be revealed. Intersectionlines of gene expression surfaces are projected back onto the underlying 2D embryo view which can provide hints to biologically meaningful regions.
|
|
|
|
Figure 6: 3D Offset Surfaces on Unrolled View |
Figure 7: 3D Offset Surfaces on AP Projection View |

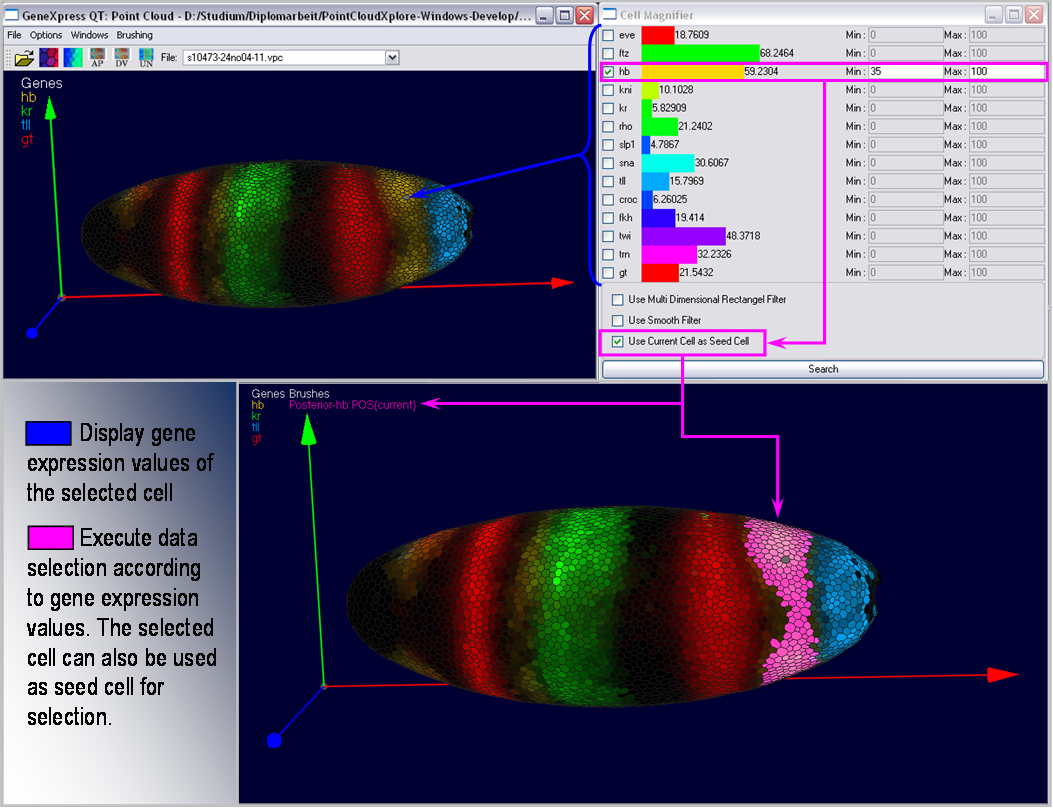
By selecting one cell in an embryo view it is possible to view all expression values measured in this cell as bar graph in the Cell Magnifier. By comparing graphs of different cells it is possible to identify some general behavior. This information can then directly be used to execute automatic selection of cells according to ranges in gene expression defined by the user.
|
|
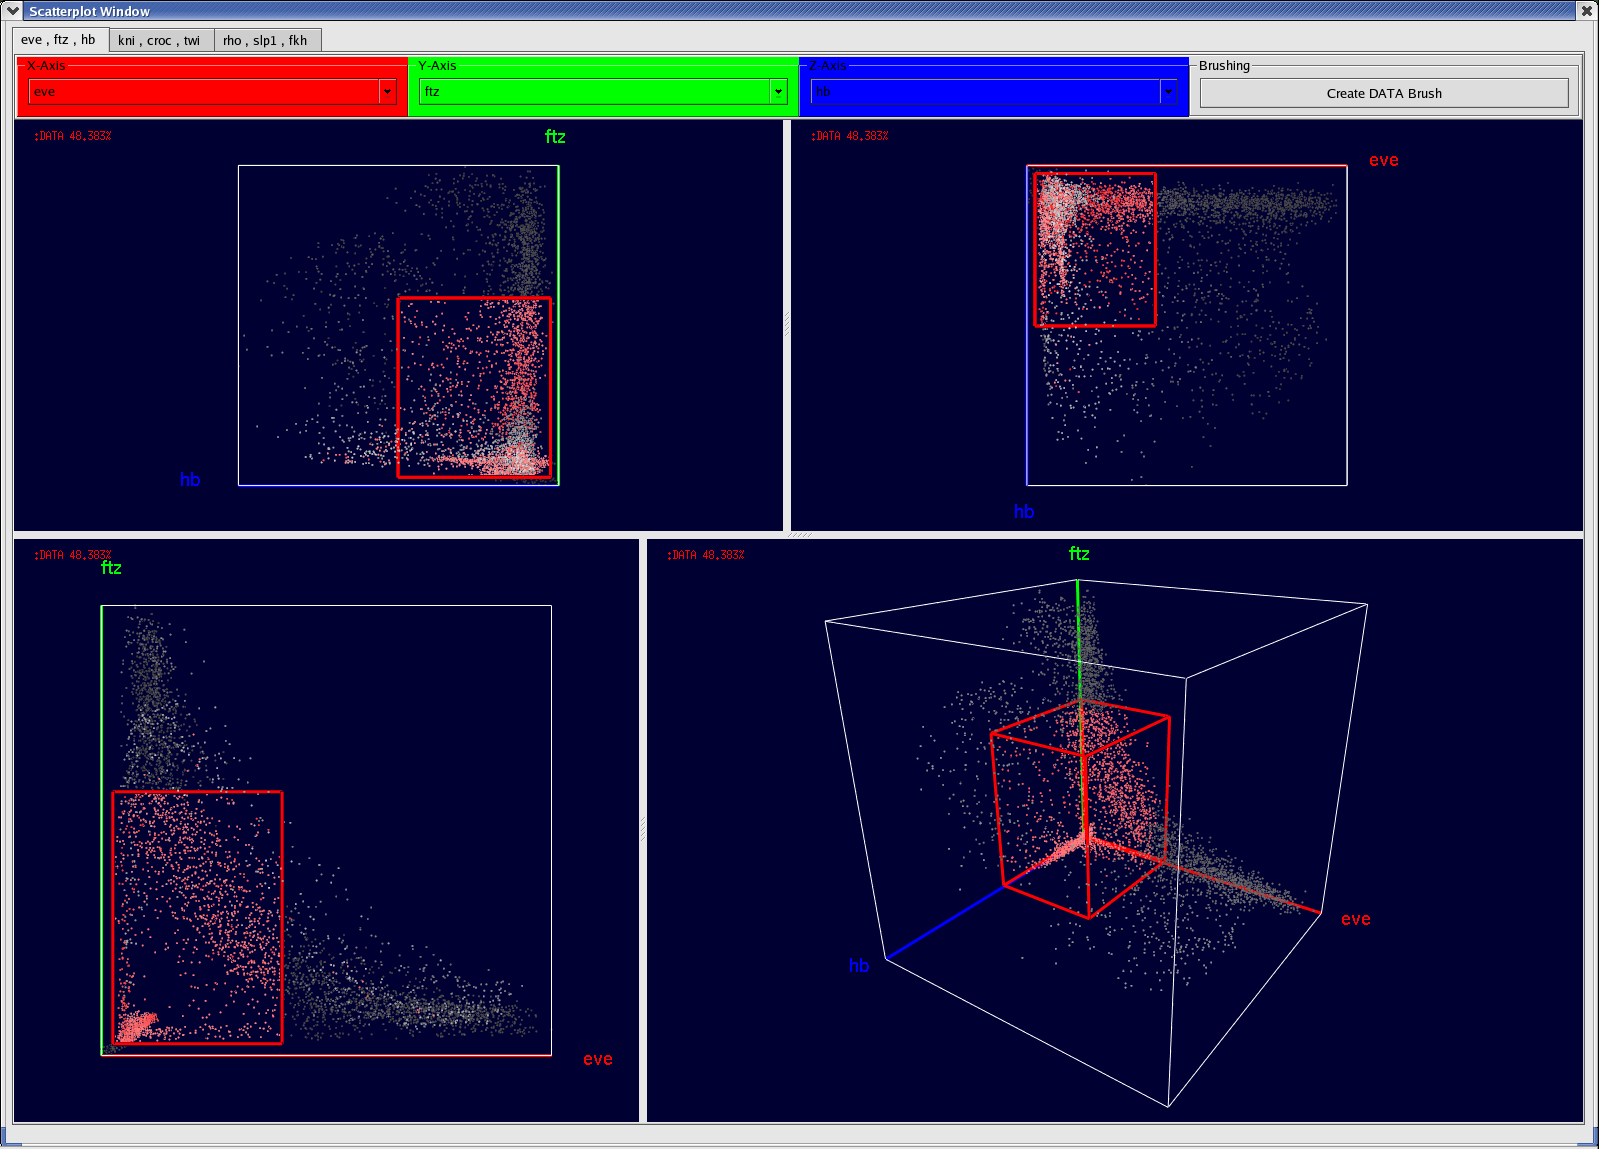
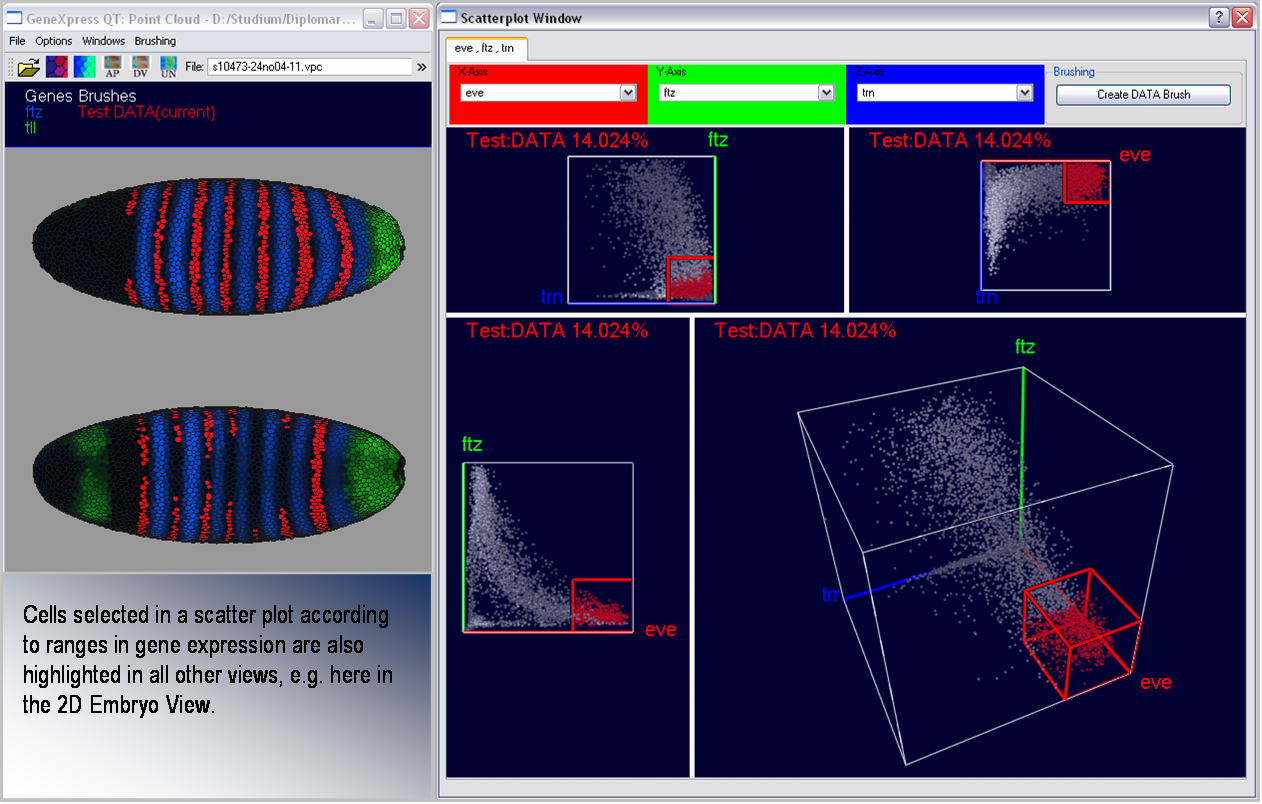
The basic concept of scatterplots is rather simple. In a 2D scatterplot for each original data point one point is drawn on the plane the scatterplot is defined on. Position of points in a scatterplot depends only on the data dimensions displayed in the scatterplot. This means even if the original data point is defined in N dimensional space, only the two dimension displayed in the scatterplot are used to define the position of the according point in the scatterplot. 3D scatterplots are an extension of 2D scatterplots and are defined on a cube in 3D space rather then a plane in 2D. Selection of data points can be executed in scatterplots using a rectangular box. Selected data parts are highlighted in the plot using color.
|
|
|
|
Figure 9: 2D and 3D Scatterplots |
Figure 10: Scatterplots and Embryo View in interaction |
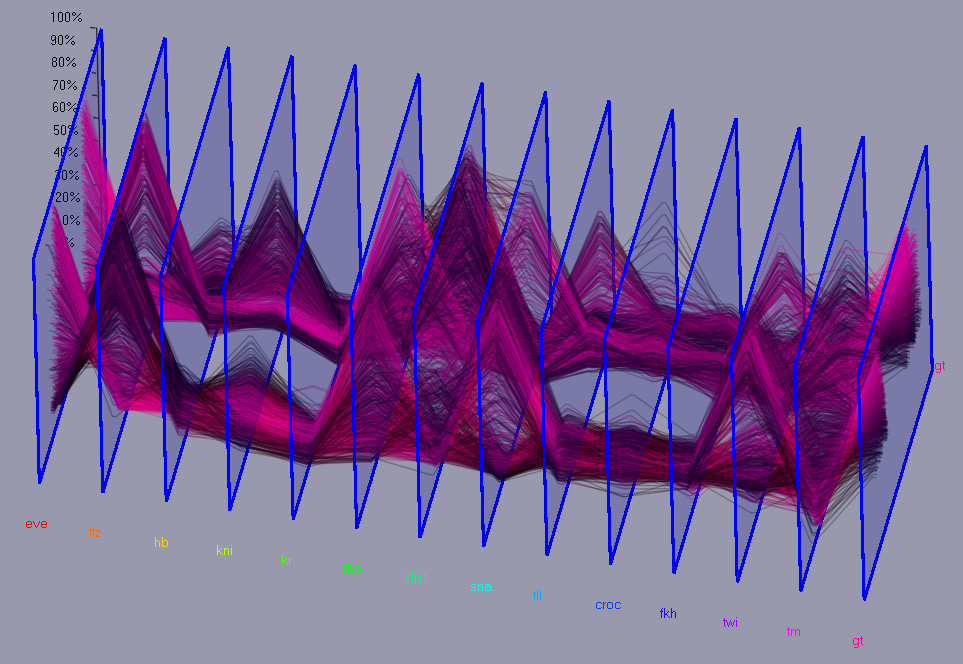
For each cell a N dimensional vector of gene expression values is given. In parallel coordinates each gene is represented by a parallel axis. For each cell a polyline is drawn from axis to axis. Parallel coordinates make it possible to display and analyze many data dimensions in parallel. To also provide some spatial information the parallel axis have been extended into the third dimension. Data lines are then ordered according to their physical position in the embryo e.g. anterior/posterior , or dorsal/ventral. Data selection can be executed in parallel coordinates by defining data ranges in the different data dimensions using sliders displayed on the axis. Selected data parts are displayed using line color, color bands, or min/max or average lines defined by the according data selection.
|
|
|
|
Figure 11: 3D Parallel Coordinates |
Figure 12: Parallel Coordinates in interaction with Scatterplots and the 3D Embryo View |

Multi View: Visualization of Embryo-Registration
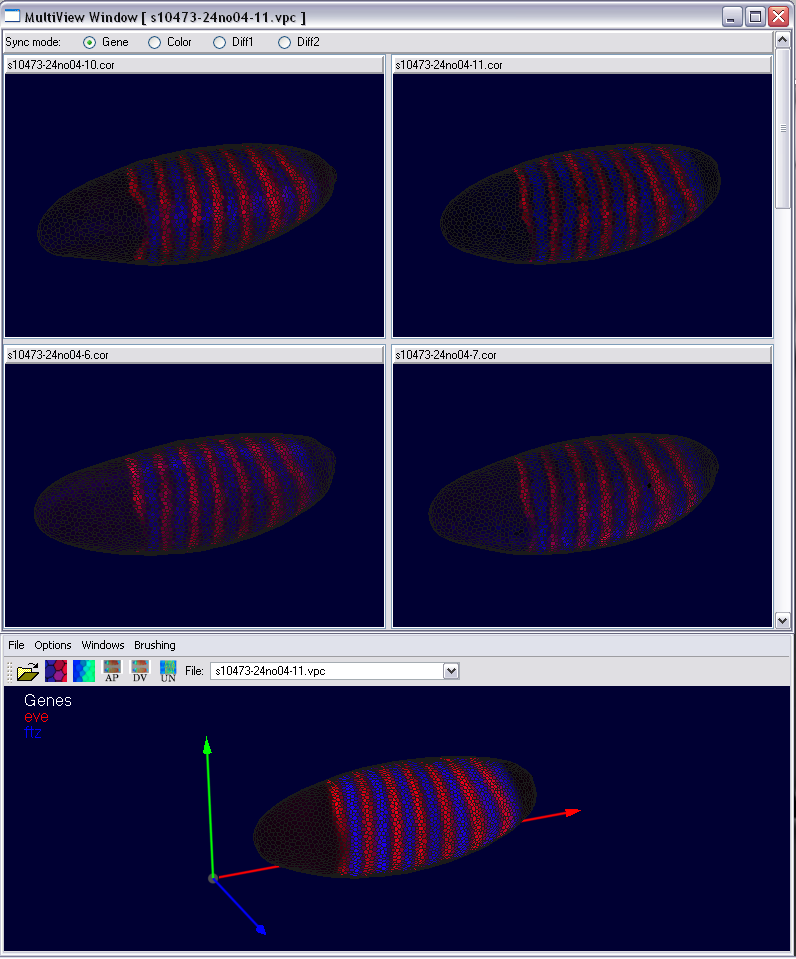
The Multi View has been developed for evaluation of the embryo registration process. While a virtual point cloud is displayed in the main view the user can view and compare the raw point cloud datasets used to create the virtual point cloud in the Multi View. The Multi View supports all 3D/2D embryo views and the gene expression surfaces. The view has been synchronized with the main window to make fast and easy validation of the embryo registration process possible. Several modes for displaying either the raw data, virtual data or differences between both in the Mulit View have been developed.
|
|
|
|
Figure 13: Multi View (gene color mode) |
Figure 14: Multi View (diff mode) |

Data selections defined in different views can be combined using logical operations like AND, OR and NOT. Therefore a centralized brush management system has been developed. Here it is possible to change and combine all user defined data selections (brushes).
Discussion and Next Steps
Future work will concentrate on integration of data analysis tools into PointCloudXplore. Clustering is widely used in analysis of gene expression data (e.g. in microarray analysis) and can also be applied here e.g. to find cells showing similar behavior in gene expression or to find coexpressed genes. Other promising approaches to improve analysis of the presented data are e.g. analysis of gene expression gradient fields, or singular value decomposition. Future work will also include comparative visualization of different timesteps in embryo development or of different fly mutants.
References
[1] C.L. Luengo Hendriks, D.W. Knowles, S.V.E. Keränen, G.H. Weber, M.D. Biggin, and D. Sudar. Automated delineation of cells and nuclei and quantification of
gene expression in 3D images of whole Drosophila blastoderm embryos. Poster at the 46th Drosophila Research Conference,
March 30 - April 3, 2005, San Diego, CA.
[2] Gunther H. Weber, Cristian Luis Luengo Hendriks, Scott E. Dillard, Derek Y. Ju, Oliver Rübel, Soile Vanamo Elisabet Keränen, Damir Sudar and Bernd Hamann,
Visualization tools for three-dimensional gene expression data in Drosophila, Poster at the 46th Drosophila Research Conference,
March 30 - April 3, 2005, San Diego, CA.
[3] Charless C. Fowlkes, C.L. Luengo Hendriks, S.V.E. Keränen, M.D. Biggin, DW Knowles, D. Sudar, and J. Malik. Building Composite Maps of Gene Expression
Pattern and Morphology: Registering 3D Representations of Drosophila Embryos. Poster at the 46th Drosophila Research Conference,
March 30 - April 3, 2005, San Diego, CA.
[4] G.H. Weber, C.L. Luengo Hendriks, S.V.E. Keraenen, E.Dillard, D.Y. Ju, D.Sudar, and B. Hamann. Visualization for Validation and Imporvement of Three-
dimensional Segmentation Algorithms. EUROGRAPHICS- IEEE VGTC Symposium on Visualization 2005.
[5] Harald Piringer, Robet Korsara, Helwig Hauser. Interactive Focus+Context Visualization with Linked 2D/3D Scatterplots. 2nd International Conference on
Coordinated and Multiple Views in Exploratory Visualization (CMV), 2004.
[6] Robert Krosara, Gerald N. Sahling, Helwig Hauser. Linking Scientific and Information Visualization with Interactive 3D Scatterplots. Short Communication Papers
Proceedings of the 12th International Conference in Central Europe on Computer Graphics, Visualization, and Computer Vision (WSCG), pp. 133-140, 2004.
[7] Alfred Inselberg. Visualizing High Dimensional Datasets \& Multivariate Relations. Tutorials for KDD 2000. University of Tel Aviv, Israel. August 20, 2000.
[8] A. Inselberg and B. Dimsdale. Parallel coordinates: A tool for visualizing multidimensional geometry. Proceedings of the 1st IEEE Conference on Visualization
(Vis '90), pages 361--378, 1990.
[9] Ying-Huey Fua , Matthew O. Ward , Elke A. Rundensteiner. Hierarchical
parallel coordinates for exploration of large datasets. IEEE Visualization,
Proceedings of
the conference on
Visualization '99. San Francisco, California, United States Pages: 43 - 50. 1999
ISBN:0-7803-5897.
[10] Helwig Hauser, Florian Ledermann, and Helmut Doleisch. Angular Brushing of
Extended Parallel Coordinates. INFOVIS, Proceedings of the IEEE Symposium on
Information Visualization
(InfoVis'02), Page: 127. 2002 ISBN:0-7695-1751-X.
[11]. Visually Effective Information Visualization of Large Data. Matej Novotny
VRVis Research Center for Virtual Reality and Visualization. Vienna / Austria.
2004.
[12] Jing Yang, Wei Peng, Matthew O. Ward and Elke A. Rundensteiner. Interactive
Hierarchical Dimension Ordering, Spacing and Filtering for Exploration of High
Dimensional Datasets. IEEE
Symposium on Information Visualization 2003 (InfoVis 2003), pp 105 - 112,
October 2003.
[13] Jing Yang, Matthew O. Ward, Elke A. Rundensteiner and Shiping Huang,
"Visual Hierarchical Dimension Reduction for Exploration of High Dimensional
Datasets",
VisSym 2003.