The Accelerated Strategic Computing Initiative (ASCI) vision is to rapidly shift from nuclear test-based Stockpile Stewardship to a high-performance computing and data analysis environment with performance, reliability and confidence which is unprecedented in numerical simulation. ASCI applications will use extremely high fidelity computer models (on the order of 1 billion cells) to generate terabytes of raw data, which will be analyzed by physicists who rely on the visualization expertise of the three defense programs laboratories, Los Alamos National Laboratory, Lawrence Livermore National Laboratory, and Sandia National Laboratories. The challenge of analyzing and visualizing the tera-scale datasets is being addressed with a combination of high-performance storage and networking with a scaleable visualization architecture which permits interactive exploration of large volumes of data.
Visualization Architecture
Tera-scale visualization architecture is
driven by the need to visualize the
results of simulations which may have
been computed on the desktop, down
the hall, or thousands of miles away.
Flexibility and adaptability of data
access mechanisms are required in
order to accommodate orders-of-magnitude
variations in processing
capability, memory, and storage.
This flexibility is realized through a
segmented architecture which
separates data services from the
interactive front-end. The data server
and the front-end are designed such
that they can inter-operate in a variety
of configurations.
Data Services
Intelligent data storage and caching
are key to the ability to interact with
tera-scale data. The data server lies
conceptually between the simulation
code and the visualization application,
providing access to the portions of
the data required for processing. The
principal responsibilities of the data
server are to satisfy client queries for
sub-meshes and slices, both at full
resolution and at adaptive resolutions.
Hierarchical data representations
permit spatial queries and selective
refinement based on preprocessed
error metrics which are stored in the
hierarchy. The data server may be
located on the MPP running a
simulation, or on an auxiliary server
or cluster of workstations with large
aggregate memory and access to
high-performance storage.
Visual Browser
The data browser allows interactive
navigation of tera-scale scientific data
by acting as a client of the data
server. The user interactively
manipulates slices and isocontours of
the data while gaining a global view
of the time dynamics of the
simulation through an intuitive
interface for navigating the time
dimension. The browser may be
integrated into existing visualization
systems in order to leverage the
comprehensive visualization tools
available.
Compression
In order to make efficient use of
available memory and storage, we are
evaluating approaches to caching of
compressed data in primary memory,
in addition to paging and high-speed
transmission of compressed
representations for distance
visualization. Research is currently
being conducted in 3D and 4D
wavelet compression with adaptive
sparse decompression and paging
capabilities.
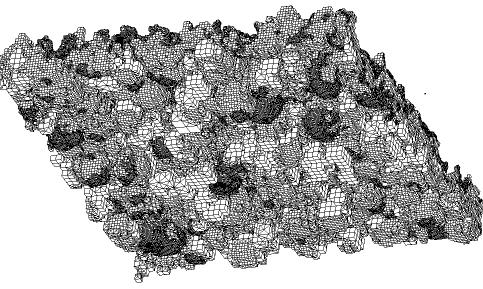
Adaptive Isocontouring
The data server is currently being
used to extract adaptive meshes which
conform to a user-selected set of
isovalues. The resulting adaptive
mesh is transparently downloaded
from the data server to a desktop
running MeshTV, a visualization
package developed at Lawrence
Livermore National Laboratory. The
adaptive data selection is performed
through octree approximation of a
regular grid of volume data. The
resulting adaptive mesh is composed
of mixed cell-types and enforces
continuity of the approximate scalar
field. Figure 1 illustrates the resulting
adaptive mesh and a contour
extracted from the mesh. This
example illustrates a common
situation, in that the desktop
visualization tool frequently cannot
deal with the original tera-scale data,
however adaptive approximations and
subsets bring the data to a level which
is manageable for existing tools.
Fig 1: Visualization of a Rayleigh-Taylor Instability simulation in MeshTV. A continuous, adaptive mesh extracted in preprocessing for isocontouring (above) and the resulting adaptive isocontour (below)
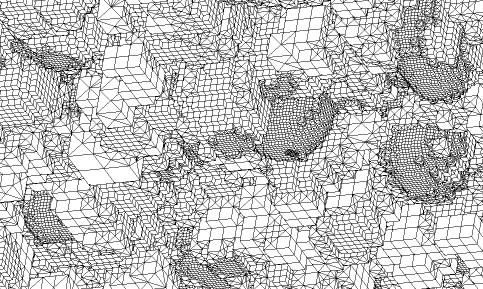
Fig 2: Detail of the adaptive mesh in Figure 1
Interactive Techniques
Scaleable visualization requires
efficient algorithmic techniques for
accessing only the data which is
required for a particular visualization.
Preprocessing of hierarchical data representations allows the computation of view-dependent error estimates from the hierarchical error bounds on the data. We are using these view-dependent error measures to adapt the rendering of meshes, contours and slices to the current user view during interactive exploration of the data. The eventual goal is to develop rendering approaches which are bound by the complexity of the output images, rather than the input data, while maintaining a guaranteed level of accuracy at the pixel level. The image in Figure 3 demonstrates adaptive triangulation of a large terrain mesh based on viewer perspective, developed collaboratively with researchers at Los Alamos National Laboratory. As the viewer location or orientation are changed, the triangulation is updated in time proportional to the number of changes rather than the size of the data, while error bounds in the geometry distortion in screen space are minimized.
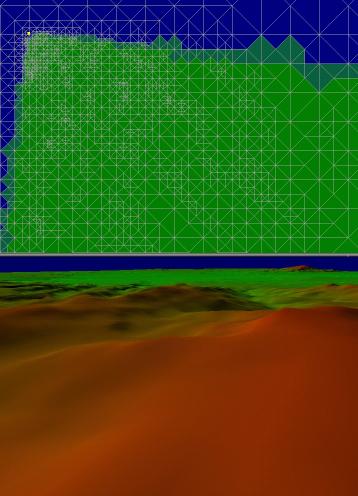
Fig 3: Adaptive view-dependent meshing of a terrain (top) and the viewer perspective (bottom)
We are also addressing the need for interactive computation as well as interactive display. Current isocontour extraction approaches are output sensitive in computational complexity, however the resulting surface lacks the hierarchical properties that are required for view-dependent rendering. Figure 4 illustrates a typical surface (composed of several million triangles) extracted from an ASCI turbulence simulation. We are currently developing an integrated approach which performs both computation and rendering in a view-dependent, output-sensitive manner. For increased interactivity during modification of the isovalue, computation may be short-circuited by increasing a variable error tolerance in the output image.
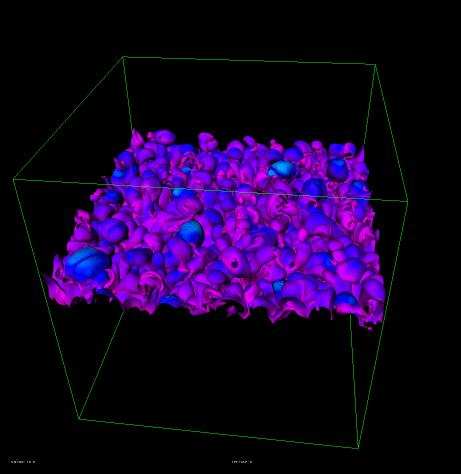
Fig 4: Full resolution contour surface extracted using an accelerated value-space cell search technique. The surface is colored by the gradient magnitude of the scalar field at each point.
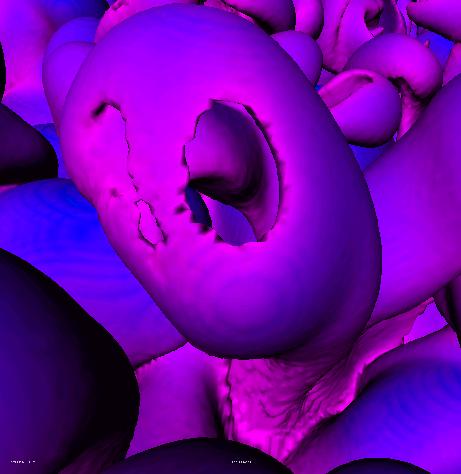
Fig 5: Close-up of the isocontour in Fig 4
For more information on ASCI Visualization efforts at LLNL contact Mark Duchaineau, 510-423-1320, duchaine@llnl.gov; or Daniel R. Schikore, 510-424-5799, schikore@llnl.gov